Unlocking Deeper Insights with the HALO® High Dimensional Analysis Module
As highly multiplexed imaging becomes increasingly prevalent in digital pathology, researchers are generating more complex datasets than ever before. Image analysis results containing dozens of markers across millions of cells are now common and have incredible potential for increasing our understanding of tumor microenvironments, immune landscapes, and cell-cell interactions. However, the complexity of these datasets brings new challenges. Extracting meaningful biological insights requires not only powerful image analysis tools but also intuitive methods to navigate high-dimensional data and identify key phenotypic patterns across cell populations. We’re excited that with the launch of our new High Dimensional Analysis module, all of these capabilities can be leveraged natively by HALO® users.
Throughout the development of our HALO image analysis platform, support for researchers working with highly multiplexed data has been a core focus. The platform offers a robust selection of tools for segmentation, biomarker quantification, and spatial analysis. With the ability to generate and export object-level data, HALO users can also leverage third-party software for external clustering analysis. External results can then be imported back into HALO to overlay cell phenotypes on whole slide images or perform spatial analysis using the HALO Spatial Analysis module. This export-import workflow supports high dimensional workflows but relies on users switching between platforms.
With the latest version of HALO, the recently released HALO 4.1, users working with highly multiplexed images can leverage powerful new capabilities using the High Dimensional Analysis module. The module offers dimensionality reduction and unsupervised clustering with interactive plotting natively within HALO, helping researchers explore and understand complex datasets faster. In this blog, we’ll cover the basics of dimensionality reduction and unsupervised clustering before exploring the High Dimensional Analysis module in more depth.
An Introduction to Dimensionality Reduction and Unsupervised Clustering
In quantitative image analysis for pathology, morphological and expression data is measured on a cell-by-cell basis across entire tissue sections. When each cell in an image is quantified for potentially dozens of biomarkers, the result is a high-dimensional dataset where every cell is described by numerous features. Analyzing these datasets manually can be laborious and time intensive, and important details can be missed in a sea of data.
Dimensionality reduction techniques help address this challenge by reducing the number of variables under consideration while preserving the relationships between data points. This makes it possible to visualize complex patterns in two dimensions and explore trends that might otherwise go unnoticed. While there are multiple dimensionality reduction techniques, the High Dimensional Analysis module uses Uniform Manifold Approximation and Projection (UMAP). UMAP is a relatively fast technique, scalable, and effective at preserving both the global and local structure of data, making it a powerful tool for revealing cellular phenotypes and population structure in multiplexed imaging data.
In unsupervised clustering, objects are grouped into clusters based on similarities in their underlying features. This technique allows researchers to discover phenotypes that were not pre-defined—such as rare immune subpopulations or transitional states between cell types.
The High Dimensional Analysis module offers two powerful clustering methods:
- K-means, which is fast and efficient but requires the user to define the number of clusters.
- PhenoGraph, which is more computationally intensive but does not require pre-specifying the number of clusters, making it well suited for discovering subtle population structures.
Together, dimensionality reduction and unsupervised clustering provide a robust framework for phenotyping cells in complex datasets.
Capabilities of the High Dimensional Analysis Module
The new High Dimensional Analysis module integrates these techniques directly into the HALO user interface, making them readily accessible to researchers working with multiplexed data. Users can now perform UMAP-based dimensionality reduction and unsupervised clustering within HALO and interactively explore results, all without leaving the platform.
The module can be used in conjunction with any cell- or object-based analysis HALO module, such as Highplex FL and Multiplex IHC, and data can be pooled from multiple images if they were analyzed with the same settings. After selecting their data, users can choose from a broad range of features to include in the high dimensional analysis, including biomarker intensity, nuclear shape, object area, class defined by AI algorithm, and more, depending on context.
The High Dimensional Analysis module interface provides intuitive controls for selecting algorithms and tuning hyperparameters. Users can easily change the number of nearest neighbors considered in UMAP and PhenoGraph analysis, as well as the number of clusters generated by K-means. Access to these parameters enables users to influence how UMAP favors global trends relative to local groupings, as well as the number of clusters subsequently detected.
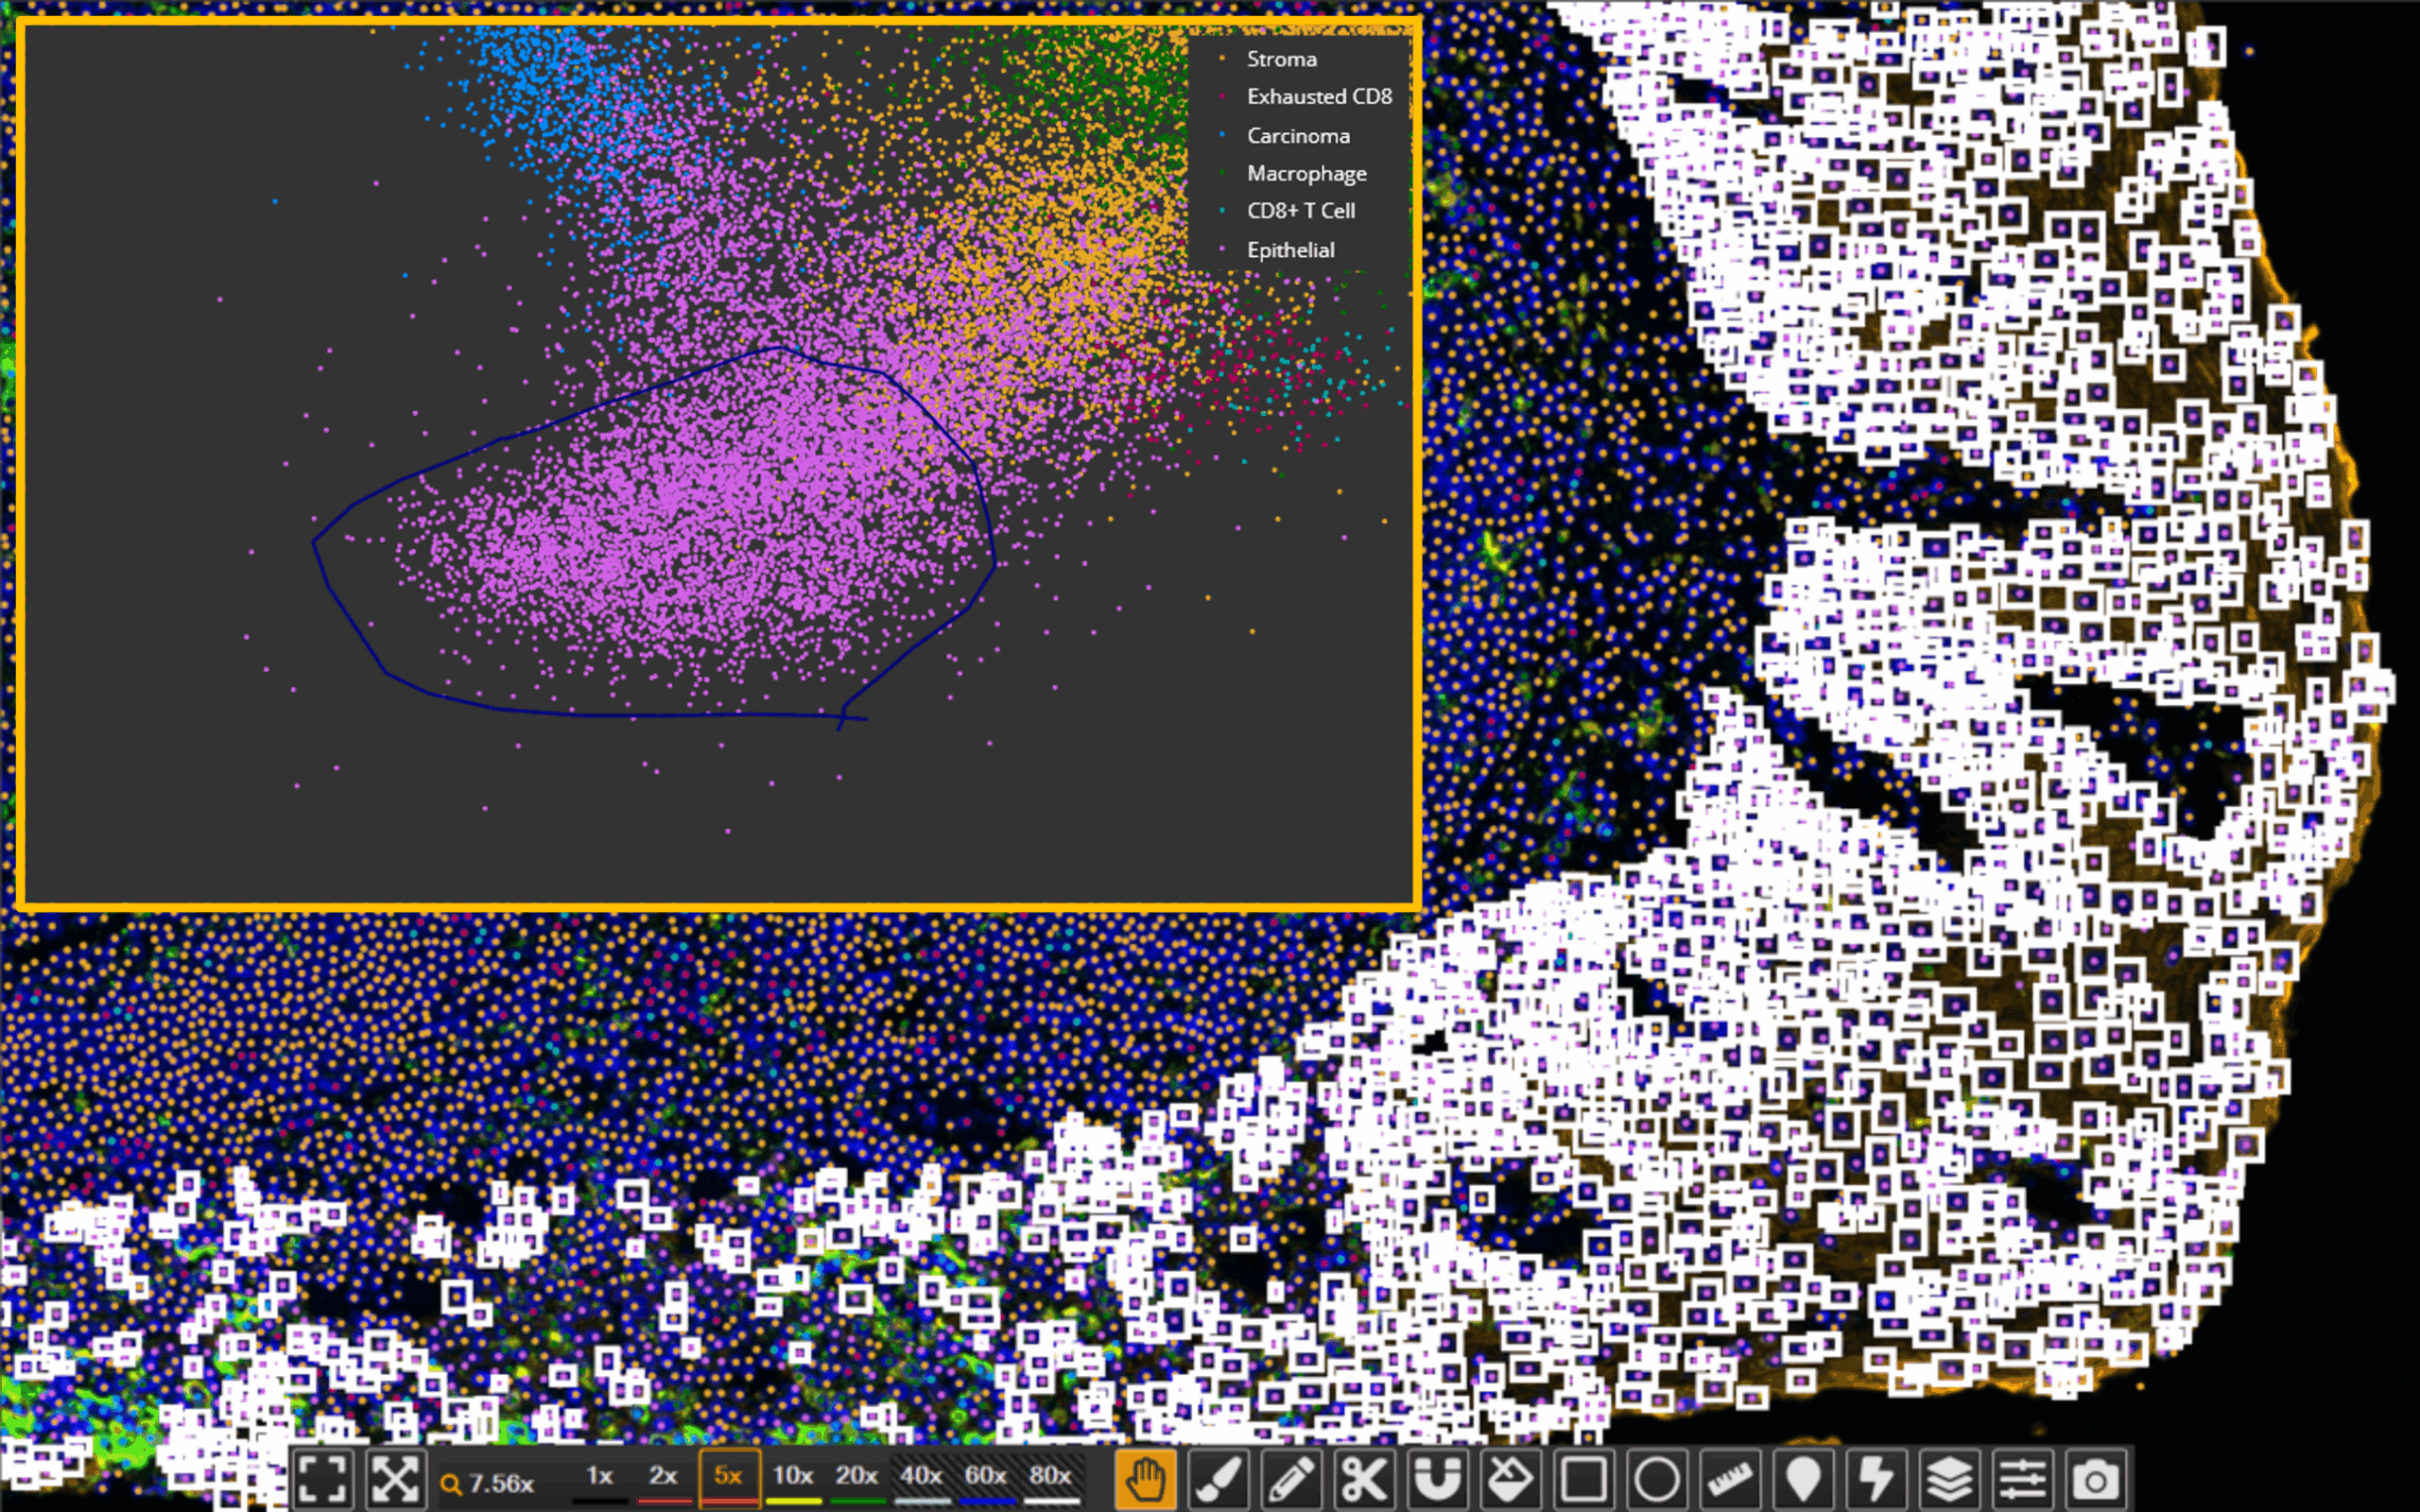
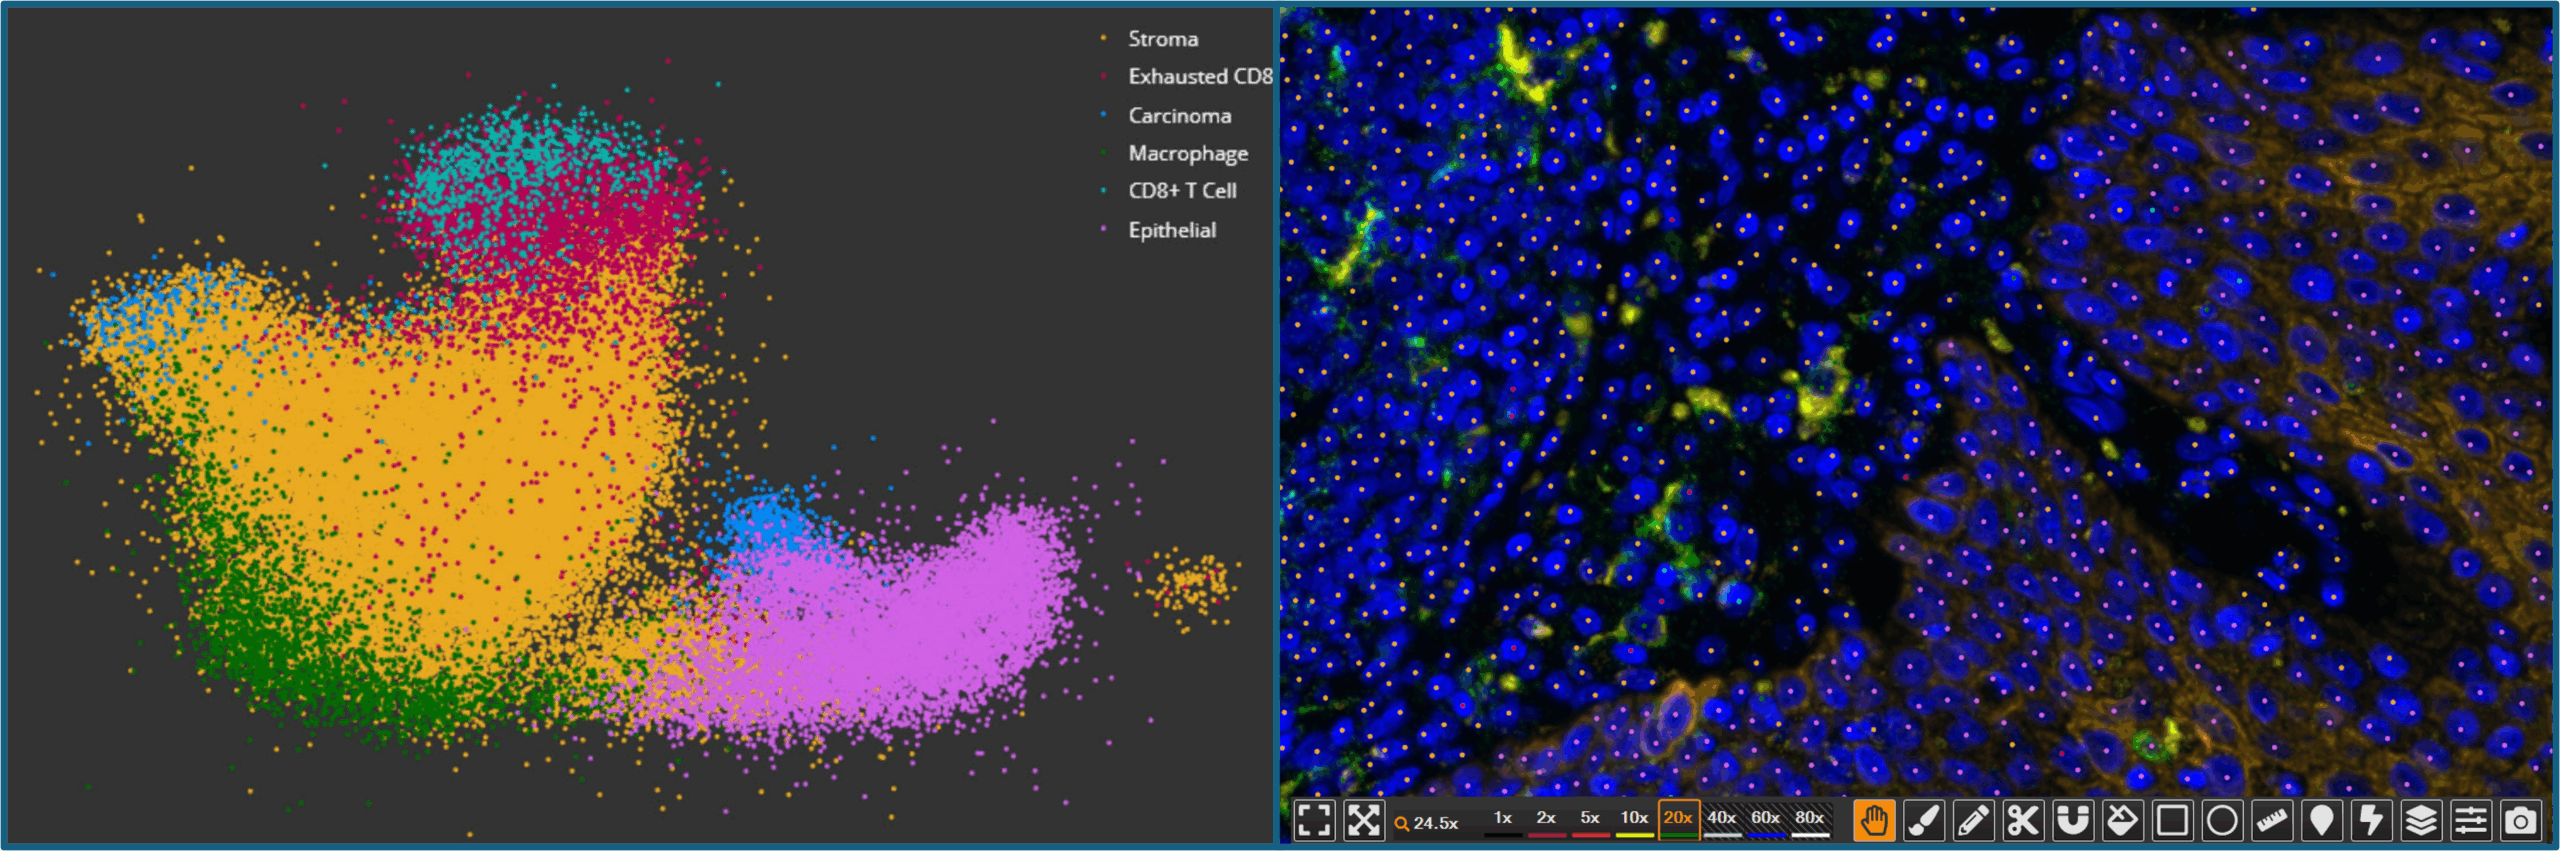
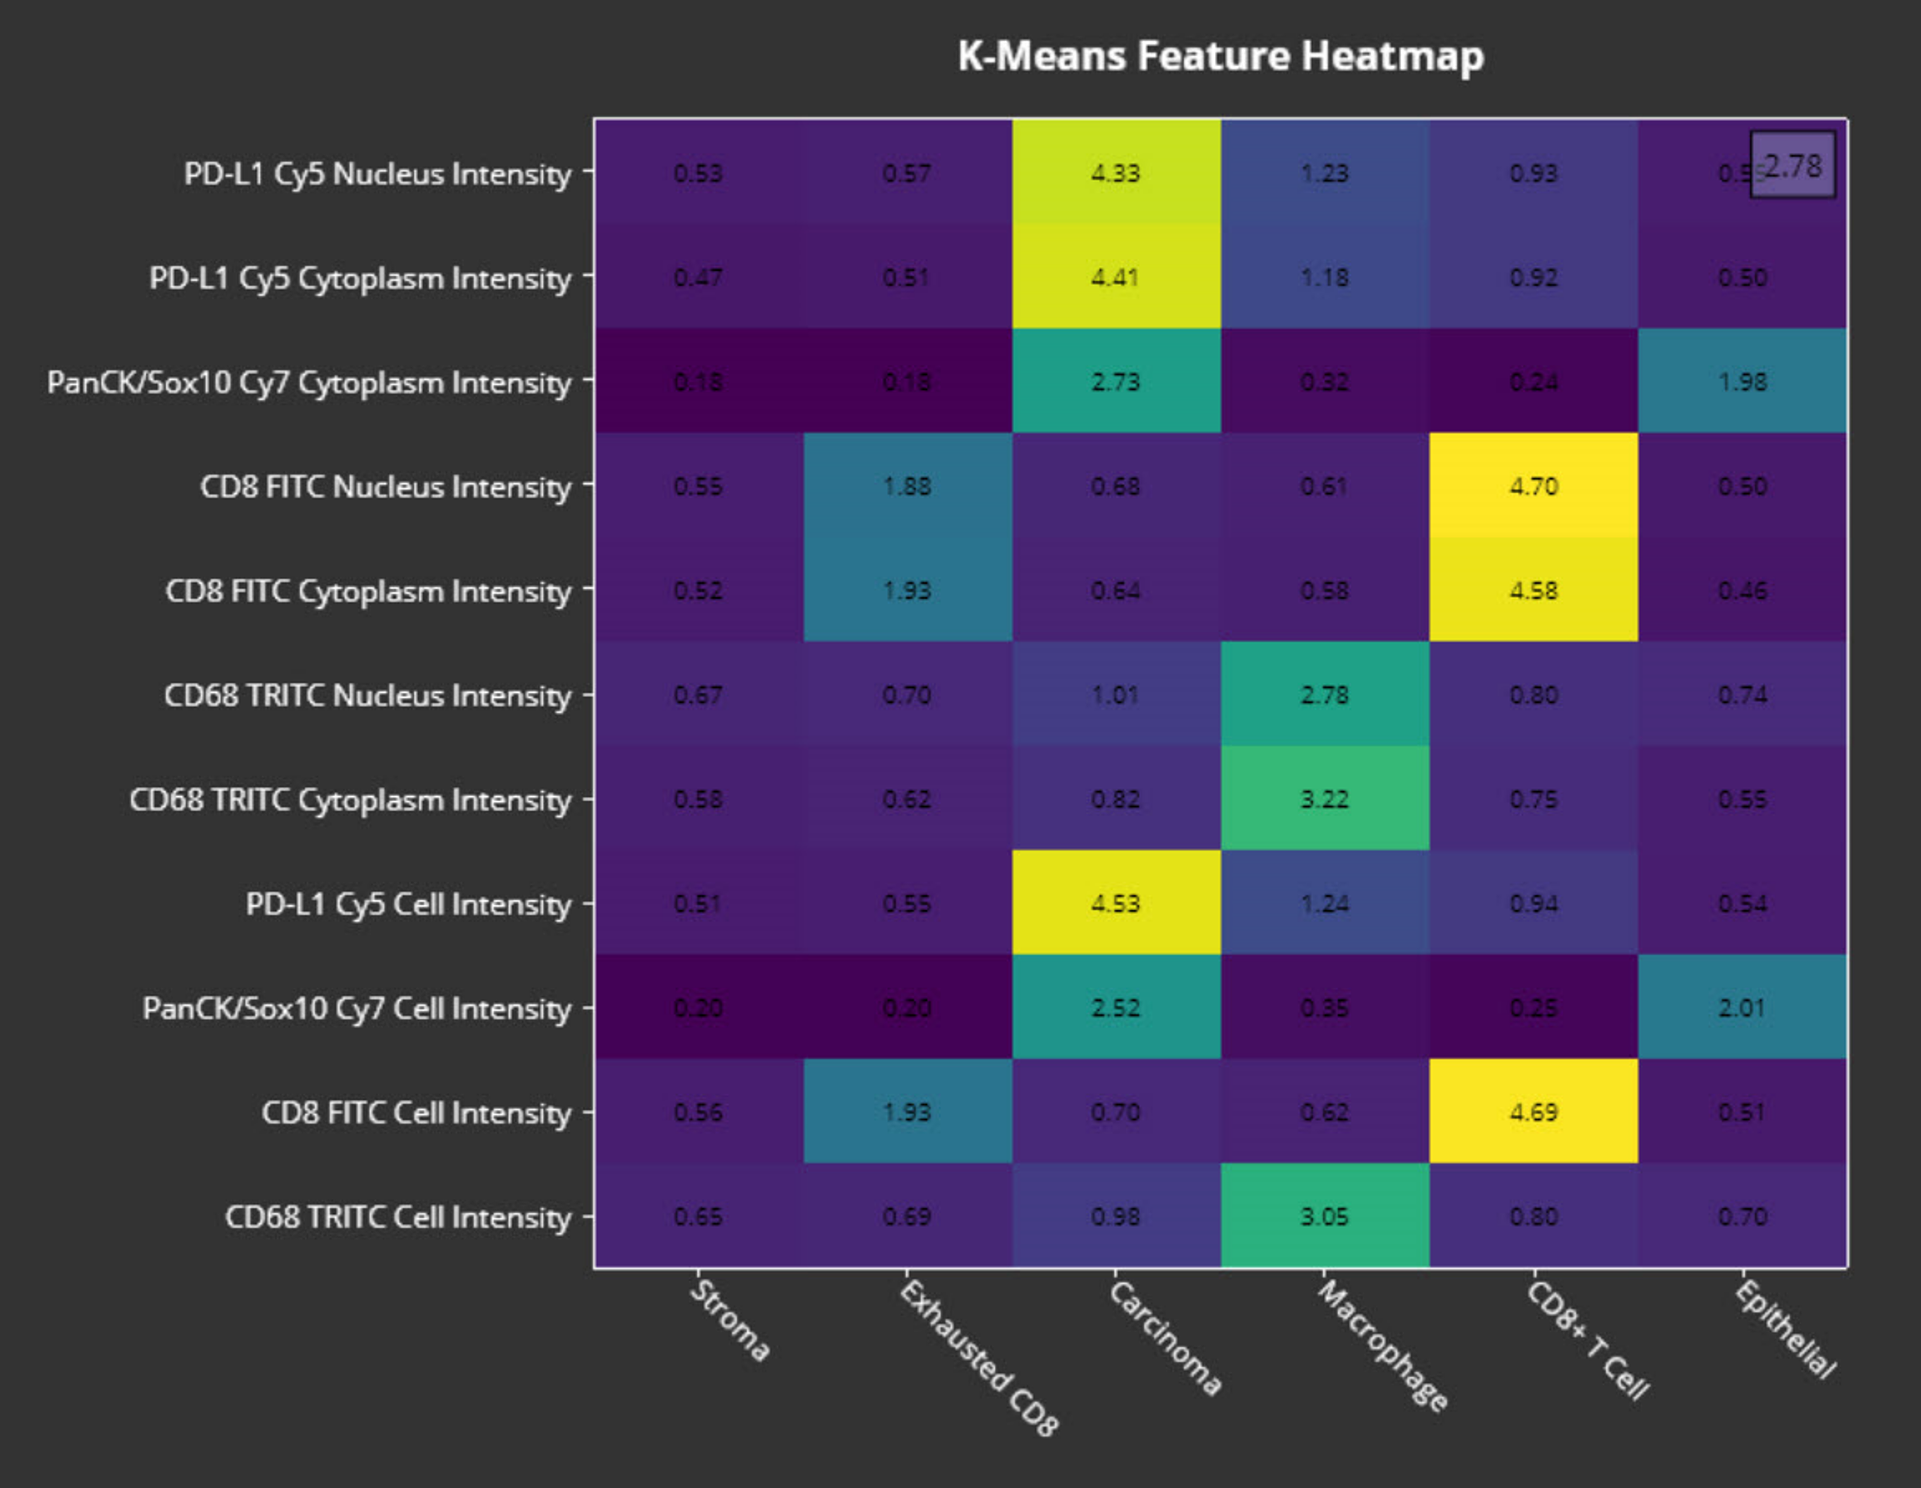
The dimensionality reduction and clustering results are displayed in a 2D UMAP plot, allowing users to visually inspect and explore the relationships between clusters. The module also generates a feature heatmap that displays the average score for all features in each cluster. These tools help guide phenotype identification and validate whether the clusters make sense biologically. Lastly, the module outputs summary data for the number of objects in each cluster as well as per-object data that includes cluster assignment.
Crucially, the High Dimensional Analysis module maintains a live link between the UMAP and the original images. Users can select a cluster in the UMAP plot and immediately see the corresponding cells highlighted on the whole slide image, facilitating biological interpretation and quality control. This bidirectional interaction allows researchers to validate cluster identities based on morphology and spatial context, a powerful advantage that is missing in external analysis tools.
Once satisfied with cluster identification and interpretation, users can save the analysis results, which are stored alongside other HALO outputs and available for integration with spatial workflows. Whether identifying novel phenotypes, validating AI classifiers, or preparing for downstream quantification, the High Dimensional Analysis module offers an end-to-end solution for exploring complex cellular data in tissue context.
Conclusions
Interpreting highly multiplexed imaging data efficiently and accurately requires tools that are not only powerful, but intuitive, interactive, and integrated into the image analysis workflow. Combined with HALO’s powerful multiplexing modules, the High Dimensional Analysis module provides users a complete toolkit for extracting meaningful insights from highly multiplex datasets and accelerating their next discovery.
If you’re interested in learning more about the benefits of the High Dimensional Analysis module and how to start a free trial, contact us at info@indicalab.com to begin a discussion with your local field applications scientist.