


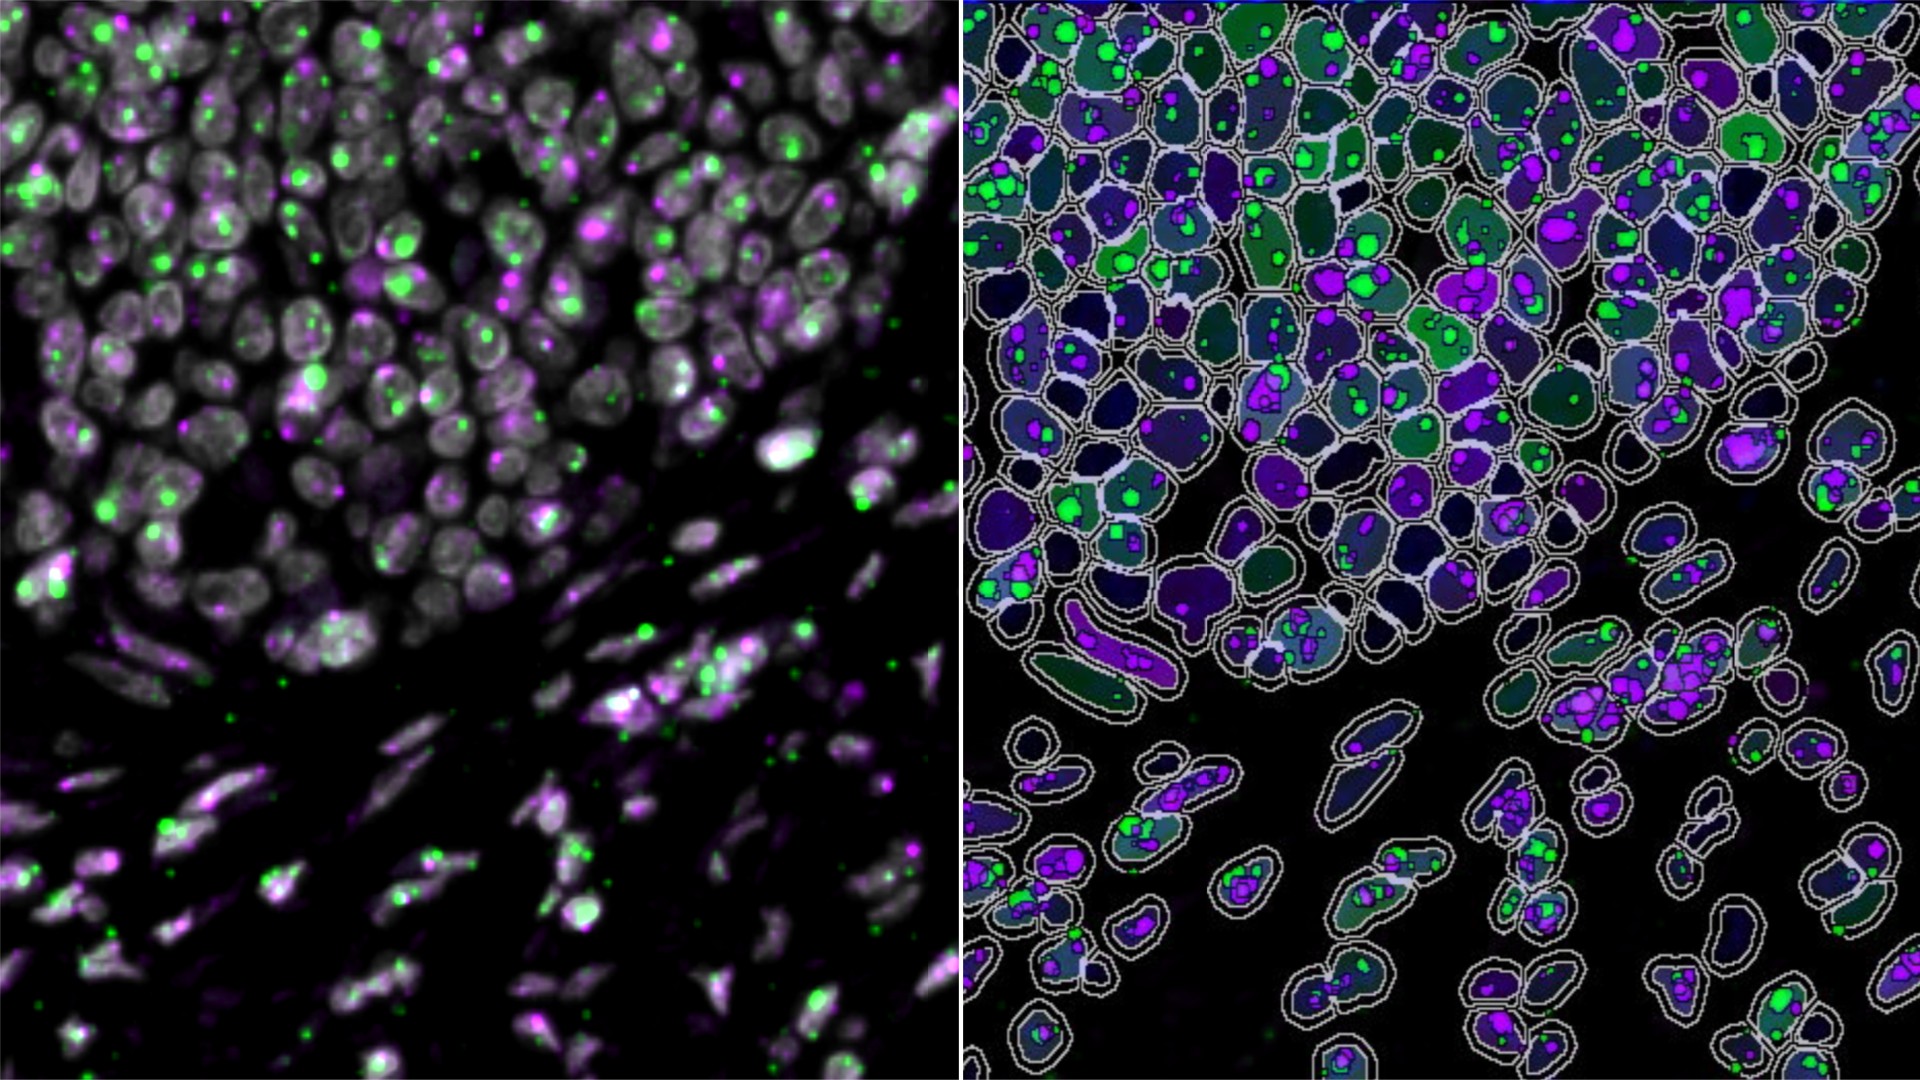
Quantify expression of an unlimited number of biomarkers in any cellular compartment - membrane, nucleus or cytoplasm.
Learn More
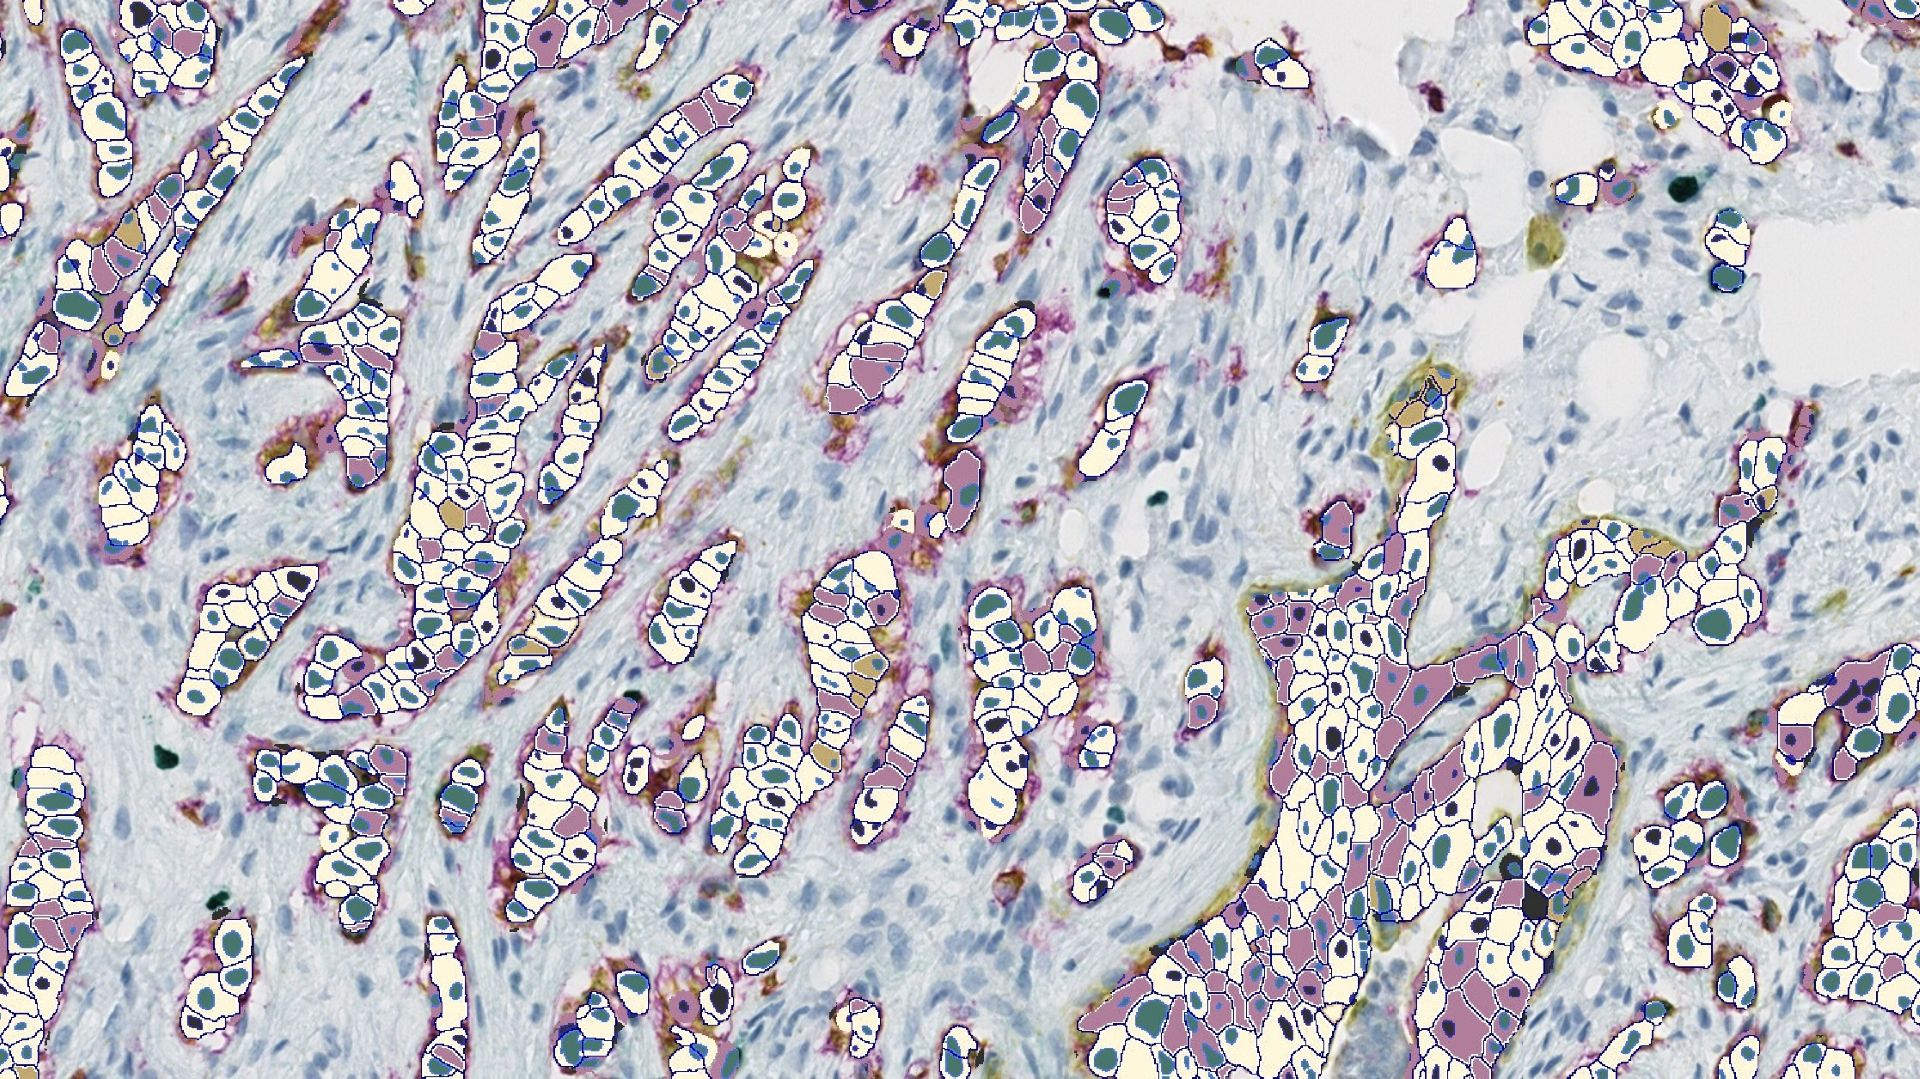
Quantify expression of up to five brightfield stains in any cellular compartment - membrane, nucleus or cytoplasm.
Learn More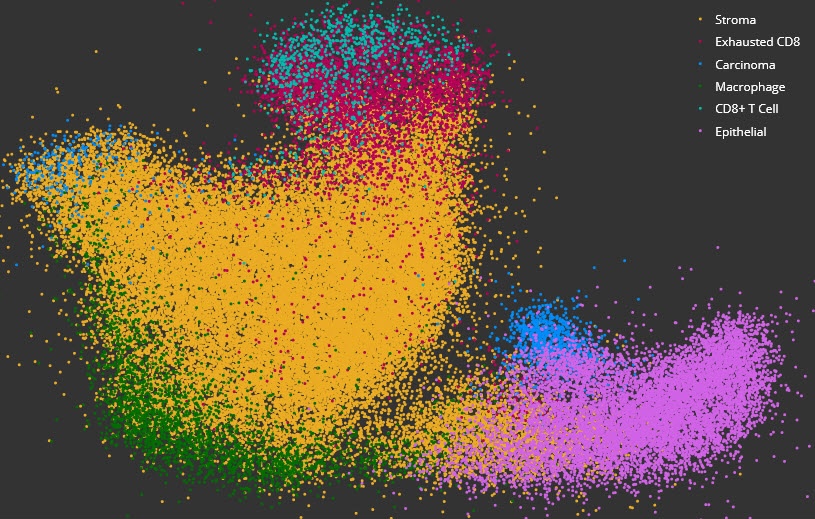
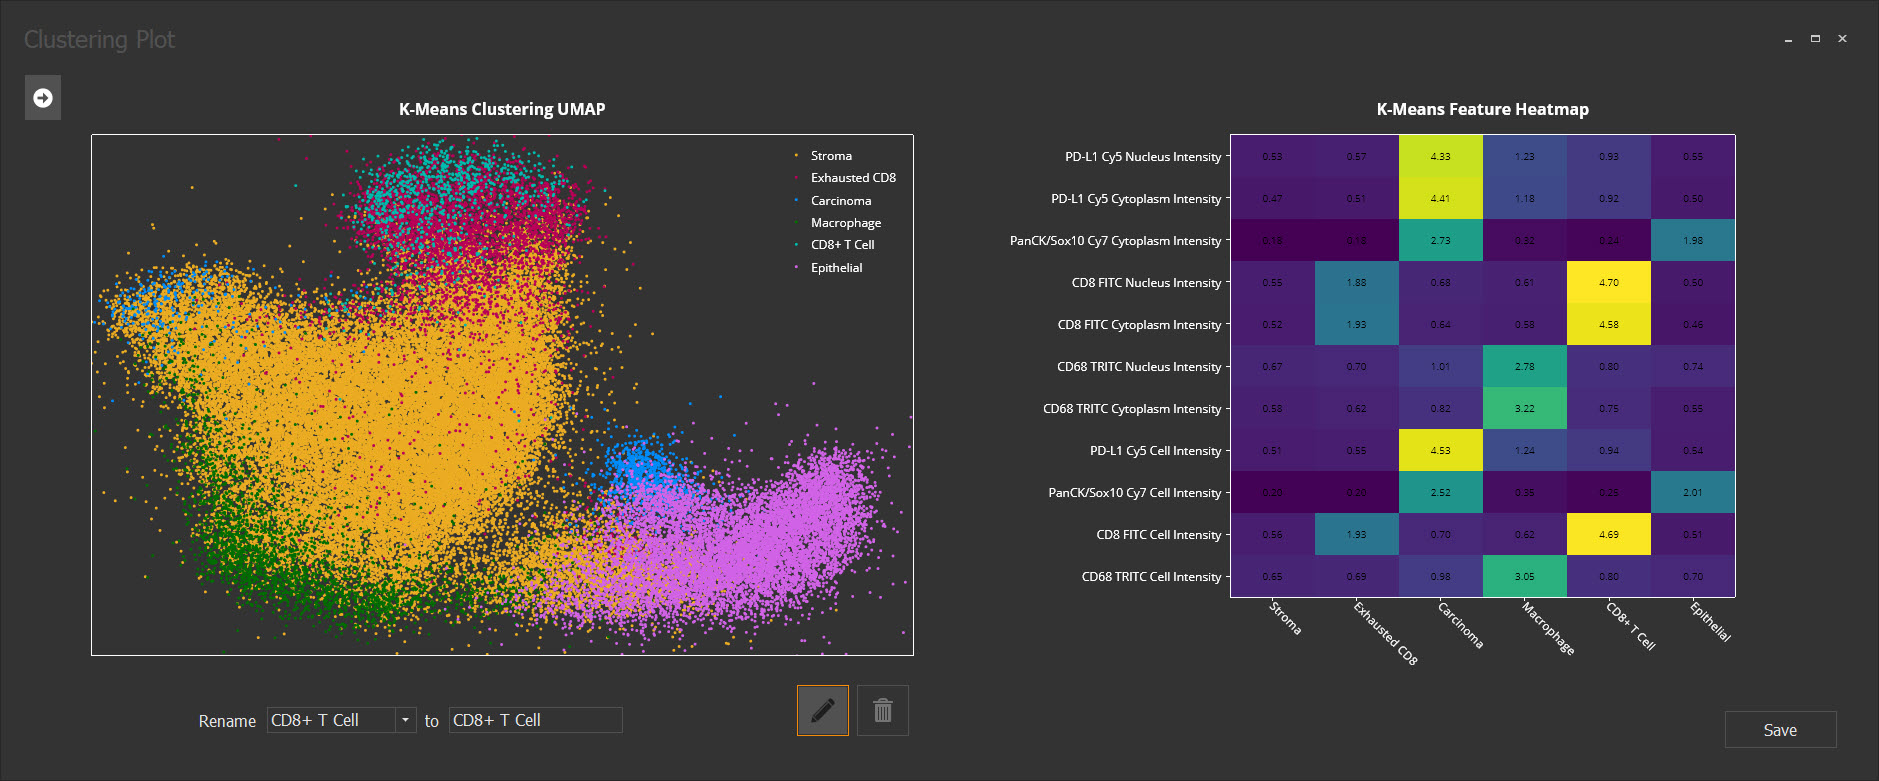
Acquire deeper insights into complex data sets using dimensional reduction and unsupervised clustering with interactive plotting.
Learn More
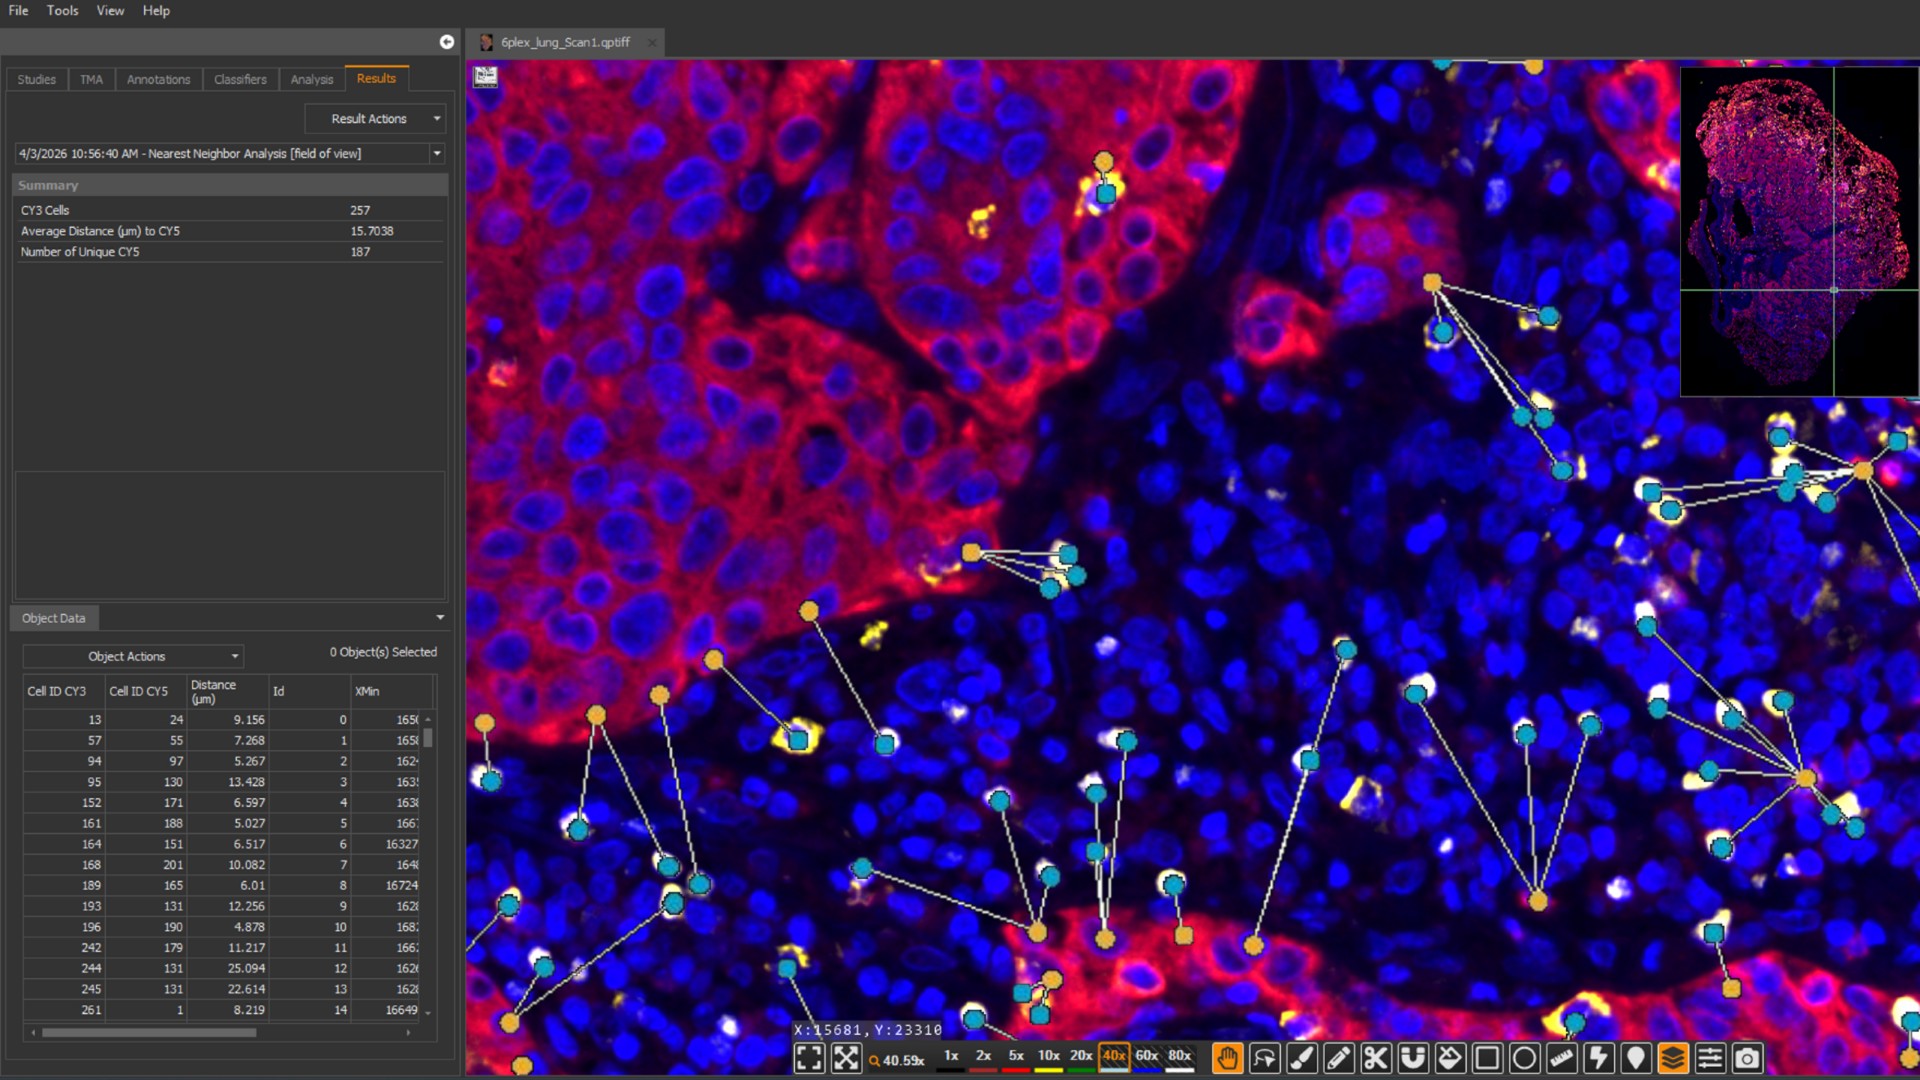
Plot cells and objects from one or more images and perform nearest neighbor analysis, proximity analysis, and tumor infiltration analysis.
Learn More
Use the HALO® FISH-IF module and reagents from Molecular Instruments or ACD, a Bio-techne brand, to simultaneously analyze an unlimited number of fluorescently-labeled DNA/RNA ISH probes and immunofluorescent protein biomarkers on a cell-by-cell basis.
Learn More
Simultaneously analyze up to three chromogenic and/or silver-labelled DNA or RNA ISH probes on a cell-by-cell basis, measuring spot numbers and area per cell and compartment, and calculated H-scores for each probe.
Learn More
Simultaneously analyze a nuclear stain and up to four IHC biomarkers or ISH probes on a cell-by-cell basis across brightfield images.
Learn More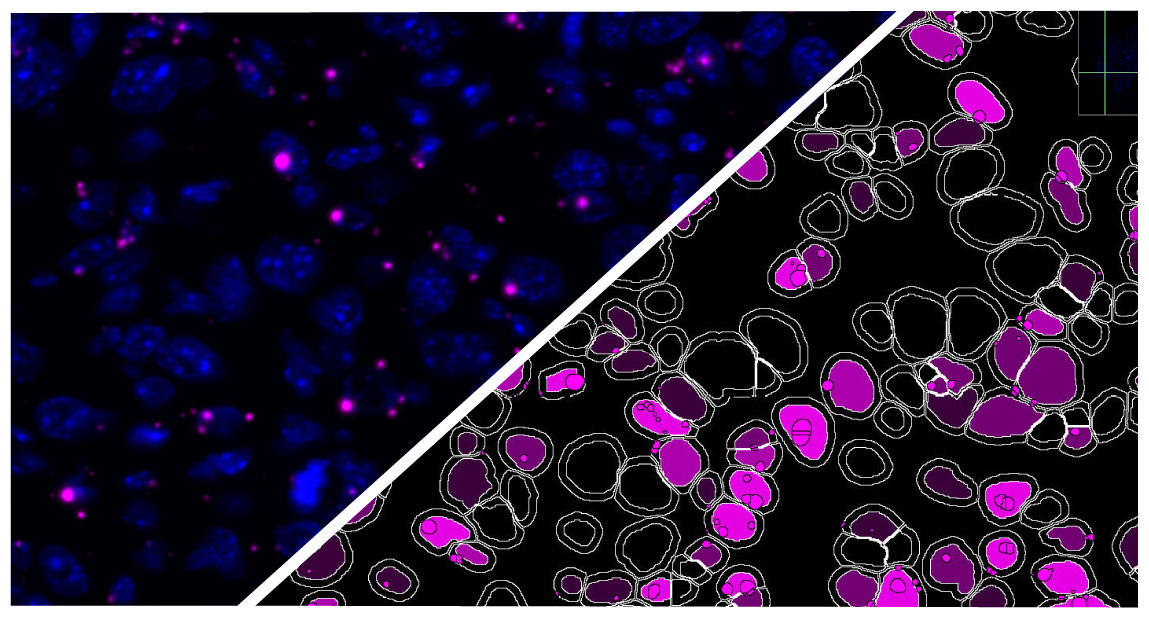
Simultaneously analyze an unlimited number of fluorescent nucleic acid probes on a cell-by-cell basis, measuring spot numbers and area per cell and compartment, and calculated H-scores for each probe.
Learn More
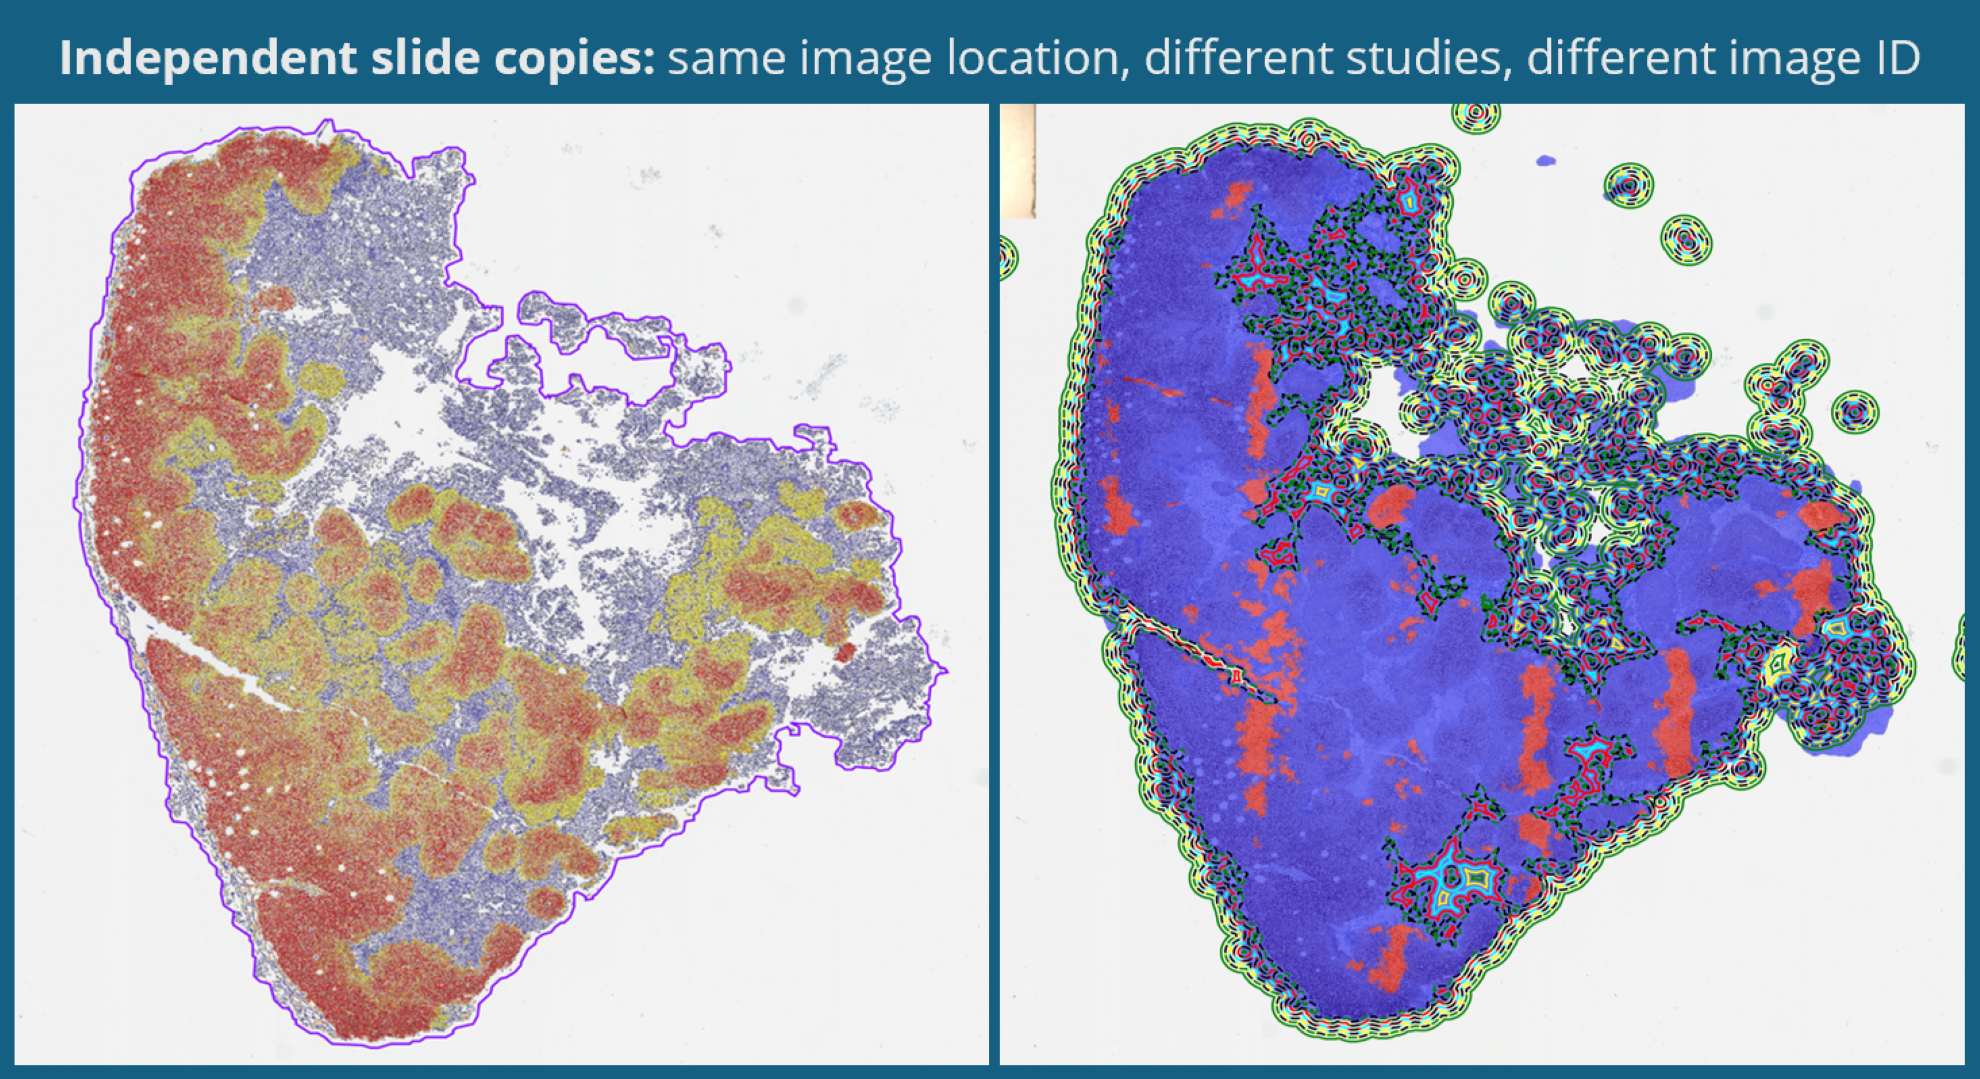
Separate multiple tissue classes across a tissue using a learn-by-example approach. Can be used in conjunction with all other modules (fluorescent and brightfield) to select specific tissue classes for further analysis.
Learn More
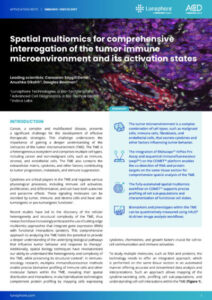
Characterizing the TME using IMC and HALO® Image Analysis
See in this app note how automated analysis of highly multiplexed IMC images using HALO and HALO AI yields rich cellular and spatial data from a streamlined workflow.
COMET™ and RNAscope™ Image Analysis Using HALO and HALO AI
Read this collaborative app note to learn how our Pharma Services team leveraged the HALO FISH-IF and Spatial Analysis modules and HALO AI for analysis of COMET™ and RNAscope™ images.

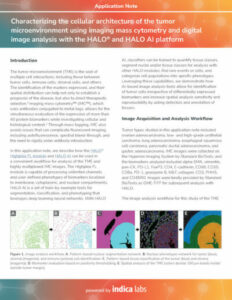
Fusion of Spectrally Unmixed Image Tiles into Whole Slide TIFs using HALO Image Analysis
In this application note, we describe how HALO can convert spectrally unmixed image tiles into whole slide images for analysis of the tumor microenvironment.
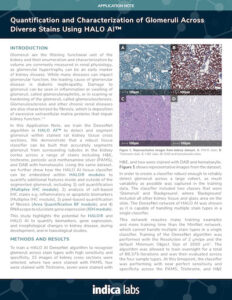
Glomeruli Quantification and Characterization Application Note
Don’t let varied stain selections hold back your digital image analysis of kidney sections! With HALO AI you can develop a tissue classifier that accurately detects and segments glomeruli in sections across a range of stains including H&E, trichrome, PAMS, and DAB with hematoxylin.
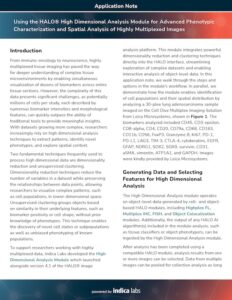
High Dimensional Analysis Application Note
In this application note, we walk through the steps and options in the HALO High Dimensional Analysis module workflow and demonstrate how this module enables researchers to interactively explore highly multiplexed datasets and extract biologically meaningful insights.
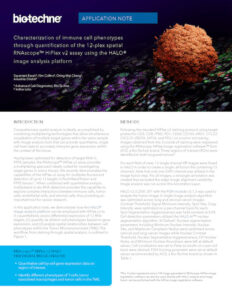
HiPlex RNAscope™ Application Note
Using our FISH module we demonstrate how to perform 12-plex RNAscope image analysis using ACD’s HiPlexv2 assay.

RNAscope Image Analysis Using HALO and HALO AI
Using our ISH module for brightfield and our FISH module for fluorescence, we demonstrate how to quantify ISH signal from RNAscope® assays on a per cell or per unit area basis and output an overall expression score based on ACD Bio’s recommended scoring guidelines.

Spatial Analysis Application Note
Download this application note to learn about the tools provided by the HALO Spatial Analysis module and how they are used to identify proximity and relative spatial distribution of cells and objects.
HALO – Image Analysis Platform (日本 Japanese)
Download our HALO brochure in 日本 Japanese to learn about the features and benefits of the gold standard image analysis platform for quantitative tissue analysis in digital pathology.
HALO – Image Analysis Platform (简体中文 Simplified Chinese)
Download our HALO brochure in simplified Chinese 简体中文 to learn about the features and benefits of the gold standard image analysis platform for quantitative tissue analysis in digital pathology.
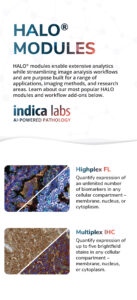
HALO Modules Brochure
Check out this brochure to learn about our most popular HALO modules and how they enable extensive analytics and streamline image analysis workflows.
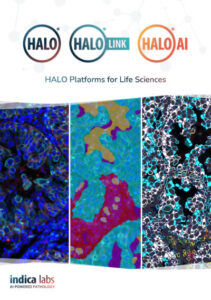
HALO Platforms for Life Sciences Brochure
Download our brochure to learn about our HALO, HALO AI, and HALO Link platforms, and how they can advance your digital pathology image analysis and management workflows.
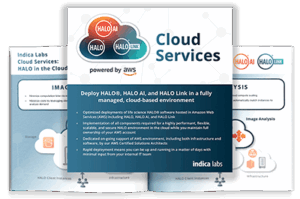
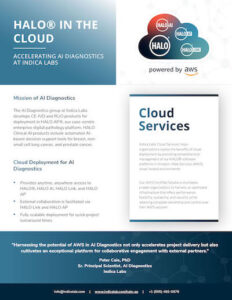
HALO, HALO AI, & HALO Link Cloud Services Brochure
Discover how our Cloud Services team can provide a secure, scalable, and flexible cloud deployment of HALO, HALO AI, and HALO Link.
Cloud Services and AI Diagnostics Case Study
Learn how the optimized, scalable infrastructure provided by Indica Labs Cloud Services enables the rapid development and robust collaboration of our AI Diagnostics group, powering the next generation of automated AI-based decision support tools.
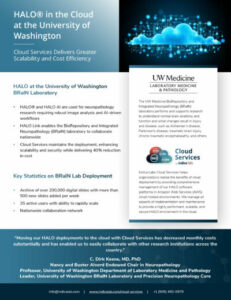
HALO in the Cloud at the University of Washington
Read this case study to learn how partnering with our Cloud Services team has delivered greater scalability and cost efficiency for the BioRepository and Integrated Neuropathology laboratory at University of Washington Medicine.
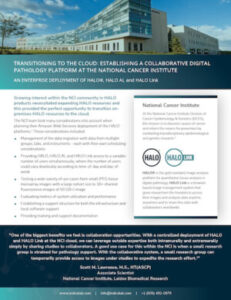
NCI Case Study
Download this case study to learn about considerations the National Cancer Institute made when planning to migrate its HALO, HALO AI, and HALO Link deployments to the cloud, and benefits the NCI experienced after migration, including 50% faster HALO image analysis.

Clustering Workflow eBook
Check out our collaborative eBook with Lunaphore to learn about an optimized workflow for extracting information from hyperplex datasets and illuminating changes in cellular neighborhoods using HALO, HALO AI, and the Lunaphore COMET platform.
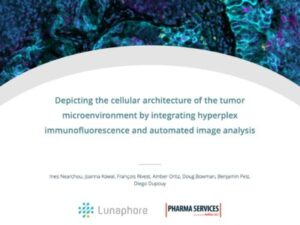
Lunaphore COMET Hyperplex IF and HALO® Image Analysis eBook
Our collaborative eBook with Lunaphore shows how HALO and HALO AI, alongside the Lunaphore COMET instrument, enable a high-throughput workflow for phenotypic and spatial analysis of cells in the tumor microenvironment.
mIF Co-Registration and Cellular Analysis eBook
Learn how HALO offers a streamlined workflow for co-registration and cellular analysis of immunofluorescence images from cyclically stained and imaged slides.

Qualitative and Quantitative Evaluation of the TME eBook
Check out this ebook to see how AI-based nuclear segmentation and tissue classification can streamline cell phenotyping across tissue compartments and samples.
Sequential Same Slide mIF and H&E eBook
Reveal more data on a single slide with this workflow for sequential same slide multiplex IF and H&E staining and imaging using HALO and HALO AI.
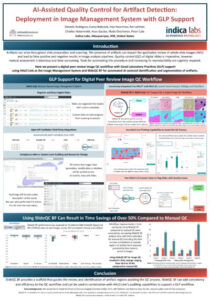
AI-Assisted Quality Control for Artifact Detection: Deployment in Image Management System with GLP Support
Download our poster to learn how artifact detection with the AI-powered SlideQC BF can advance your quality control pipelines with the GLP support of HALO Link.
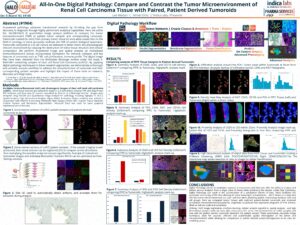
All-In-One Digital Pathology: Compare and Contrast the Tumor Microenvironment of Renal Cell Carcinoma Tissue with Paired, Patient Derived Tumoroids
Check out this collaborative poster to learn about a streamlined triplex chromogenic workflow leveraging HALO and HALO AI for analysis of slides assayed with Leica Biosystems’ ChromoPlex III Triple Detection RUO.
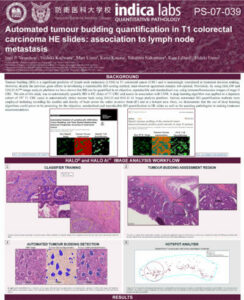
Automated Tumor Budding Quantification in Colorectal Carcinoma H&E Images
Learn about quantification of tumor budding in colorectal carcinoma using HALO and HALO AI.
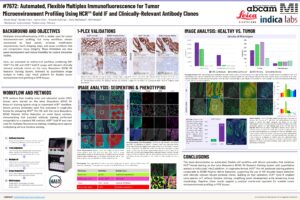
Automated, Flexible Multiplex Immunofluorescence for Tumor Microenvironment Profiling Using HCR Gold IF and Clinically-Relevant Antibody Clones
Check out this collaborative poster to learn about a streamlined triplex chromogenic workflow leveraging HALO and HALO AI for analysis of slides assayed with Leica Biosystems’ ChromoPlex III Triple Detection RUO.
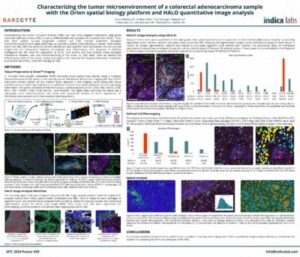
Characterizing the TME of a Colorectal Adenocarcinoma Sample with the Orion Spatial Biology Platform and HALO Image Analysis
Download our collaborative poster with RareCyte to learn how to analyze a colorectal adenocarcinoma sample with HALO and HALO AI
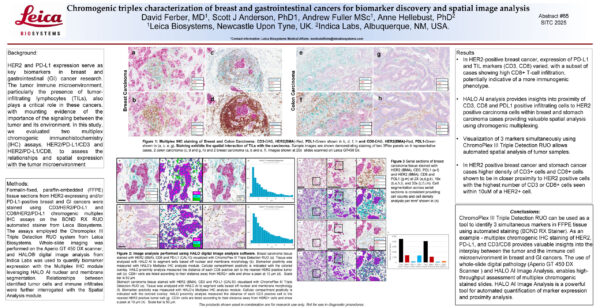
Chromogenic triplex characterization of breast and gastrointestinal cancers
Check out this collaborative poster to learn about a streamlined triplex chromogenic workflow leveraging HALO and HALO AI for analysis of slides assayed with Leica Biosystems’ ChromoPlex III Triple Detection RUO.
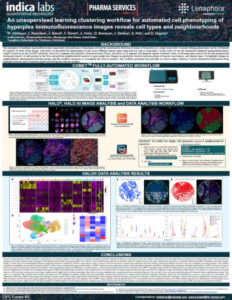
Clustering Workflow for Advanced Cell Phenotyping of Hyperplex IF Images
Download our collaborative poster with Lunaphore to learn about a clustering workflow that uses unsupervised learning for COMET™ images.
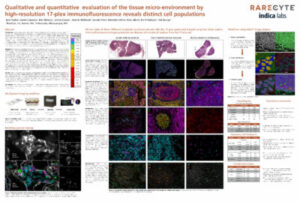
Evaluation of the TME by High Resolution 17-plex IF and HALO Image Analysis
Learn how to perform highly multiplexed IF and image analysis using the Orion instrument combined with HALO and HALO AI image analysis.
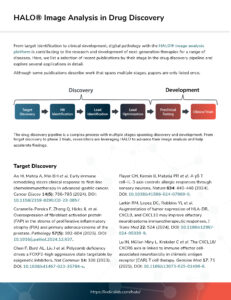
HALO Image Analysis in Drug Discovery
Review this publication list to learn how HALO platforms are advancing image analysis and helping accelerate findings throughout the drug discovery and development pipeline.
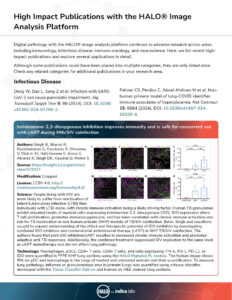
HALO® High Impact Publications
Learn how HALO image analysis is leveraged in fields from immuno-oncology to neuroscience and infectious disease in this selection of high-impact publications.
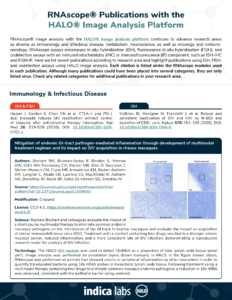
RNAscope™ and HALO® Publications
Read this publications list for examples of research in areas from neuroscience to oncology using HALO to analyze RNAscope™ images.

Fetal growth restriction (FGR) is a significant concern in obstetrics, affecting 5–10% of pregnancies globally. FGR is a major contributor to perinatal morbidity and mortality and poses a significant maternal risk due to potential co-occurrence with pre-eclampsia. Despite their impact,...
Learn More
SARS-CoV-2, the causative agent of COVID-19, has been the focus of intense research since its detection in late 2019. It is known that viral infection affects several cellular processes, including senescence and inflammation, and prior studies also point toward SARS-CoV-2...
Learn More
Schwannomas are sporadic, usually benign tumors that develop predominately on spinal nerve roots and cranial nerves. Inactivation of NF2 in Schwann cells (SC) is the cause of nearly all schwannomas and mutations in additional genes are few if present at...
Learn More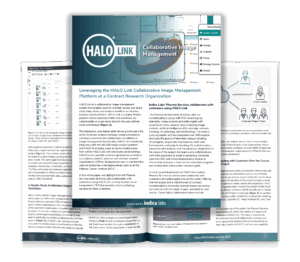
Pharma Services and HALO Link White Paper
Download our white paper to learn how Indica Labs’ Pharma Services collaborates with customers and delivers HALO and HALO AI image analysis using HALO Link.
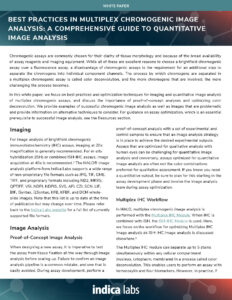
Quantitative Multiplex Chromogenic Image Analysis Guide
From stain and chromogen selection to honing nuclear and membrane detection in HALO, this comprehensive guide provides best practices and optimization techniques to help take your multiplex chromogenic image analysis to the next level.

Quantitative RNAscope™ Image Analysis Guide
From experimental design considerations to optimized setup of HALO image analysis parameters, our guide will help take your quantitative RNAscope™ image analysis to the next level.
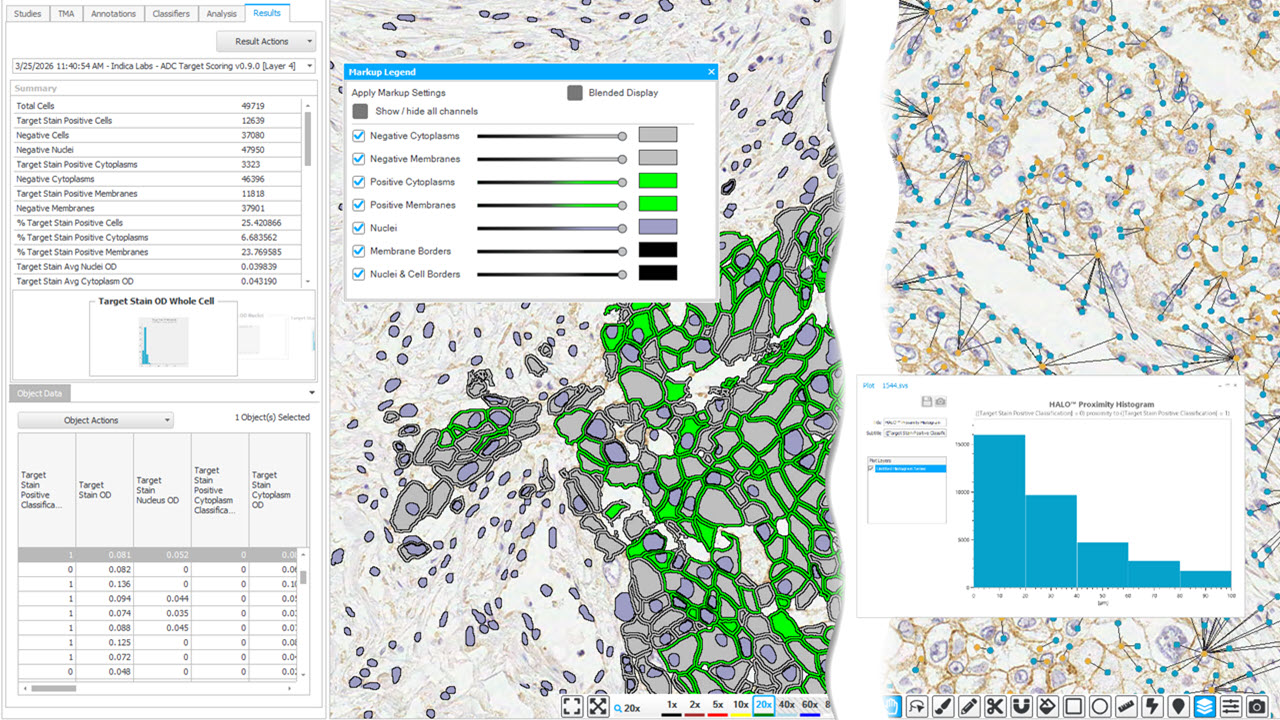
Powering ADC Development with the New HALO® ADC Target Scoring Module
16 June 2026 | Learn about the new HALO module designed to streamline analysis for ADC-focused assays
What is new in HALO®, HALO AI, and HALO Link 4.3?
11 June 2026 | Learn about the exciting new features in the 4.3 versions of HALO, HALO AI, and HALO Link!
From Images to Insights: Getting Started with RNAscope™ Image Analysis in HALO®
25 June 2026 | Discover commonly used tools to get started today with RNAscope™ image analysis in HALO®
Performing Spatial Analysis Workflows with HALO®
19 May 2026 | Learn how to unlock deeper insights and enhance your data using the HALO Spatial Analysis module
Indica Labs Surpasses 3,000 Deployments of HALO Digital Pathology Software Worldwide Since 2013
Albuquerque, NM, March 3, 2026 – Indica Labs, the global leader in AI-powered digital pathology software and services, today announces surpassing the 3,000th installation of

Indica Labs’ Pharma Services Launches GCP-Compliant Image Analysis Service
Albuquerque, NM, July 8, 2025 – Indica Labs, the global leader in AI-powered digital pathology software and services, today announces that their Pharma Services team
Indica Labs Announces Launch of High Dimensional Analysis Module for the HALO® Image Analysis Platform
Albuquerque, NM, 8 April 2025 – Indica Labs today announces the launch of the High Dimensional Analysis module for the HALO® image analysis platform. This

Indica Labs Joins the AWS Partner Network
Albuquerque, NM, December 4, 2024 – Indica Labs, the global leader in AI-powered digital pathology software and services, announced today that they have joined the

Looking Back: Reviewing 2025 at Indica Labs
As we reach the end of 2025, the Indica Labs team extends our sincere thanks to the customers and collaborators who helped make this year
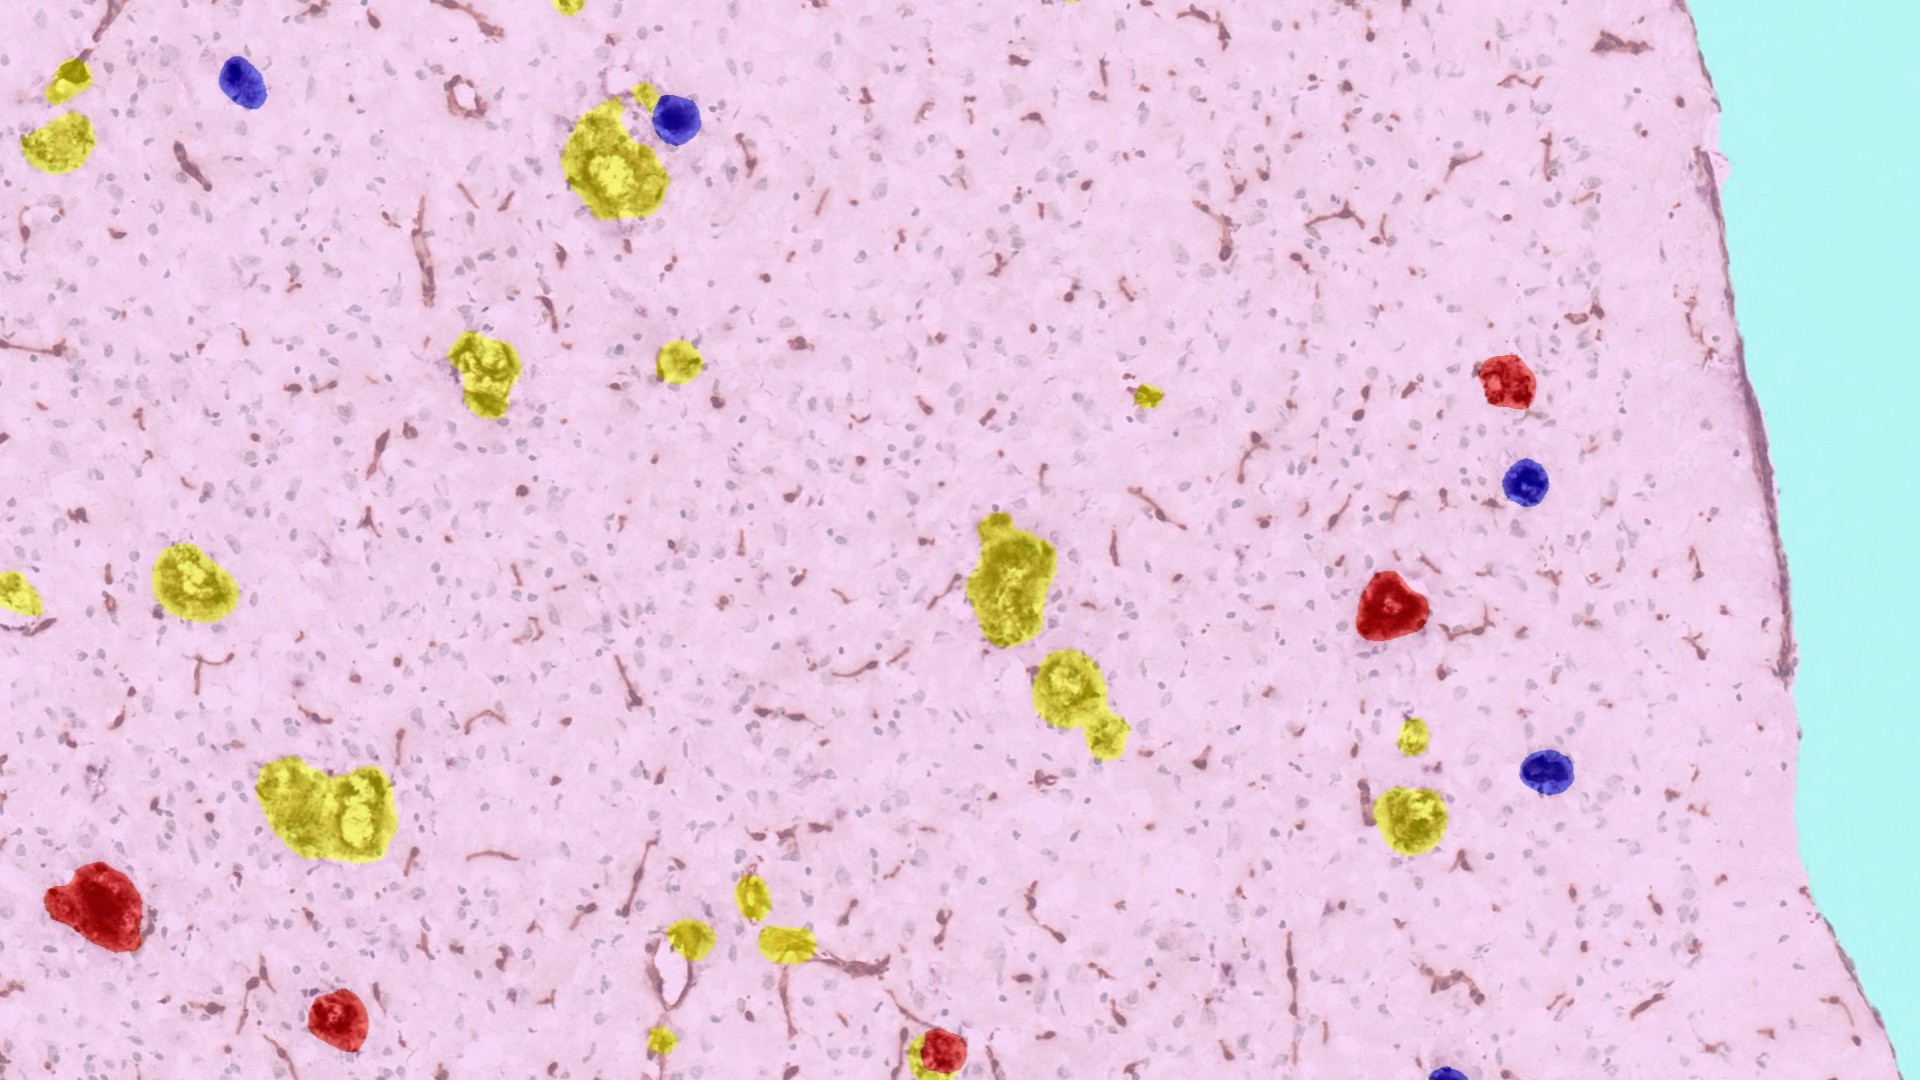
Advancing Neuroscience Research with HALO® and HALO AI
As scientists work to continue unraveling the structural, cellular, and molecular complexities of the brain and its diseases, the characteristics of this unique tissue pose
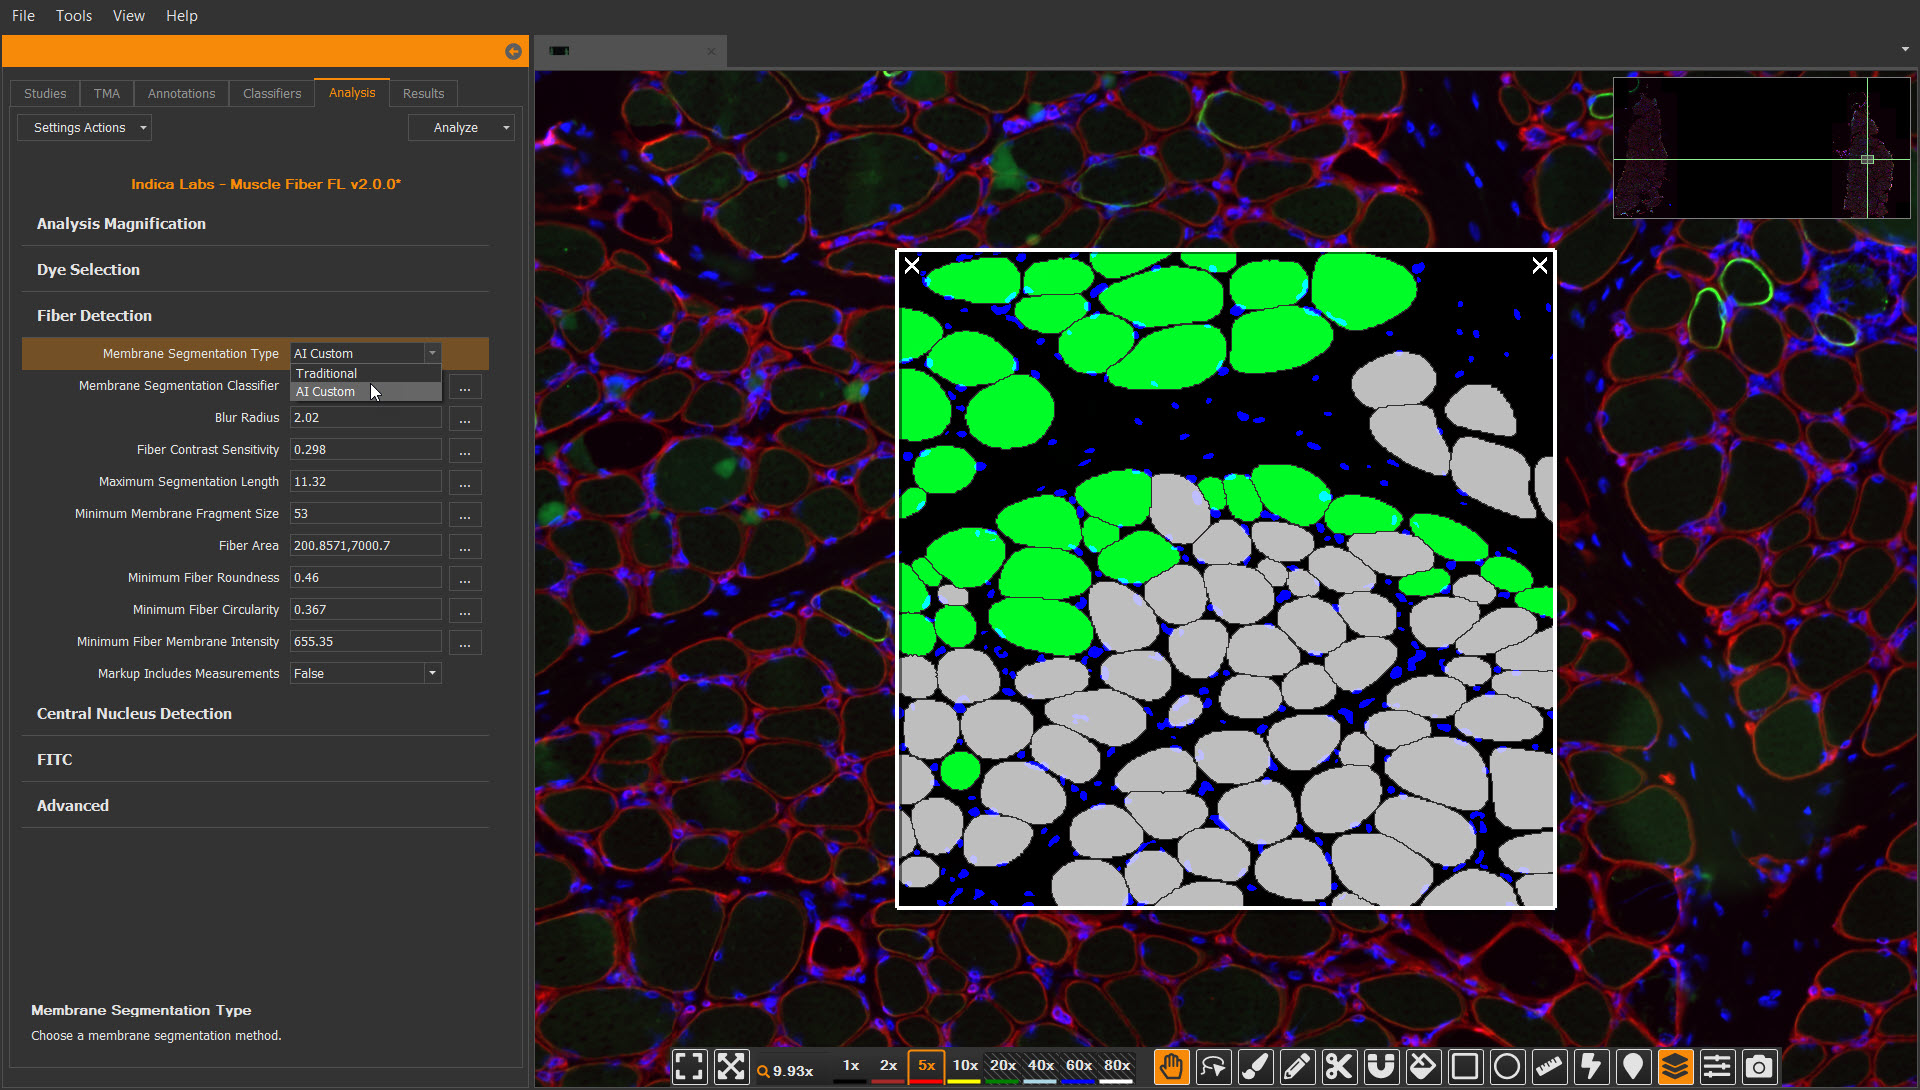
Announcing HALO® Muscle Fiber BF and Muscle Fiber FL Modules Supporting AI-Powered Segmentation and Interactive Markups
We’re excited to announce the launch of the newly updated Muscle Fiber BF and Muscle Fiber FL modules supporting AI nuclear segmentation, AI membrane segmentation,
Unlocking the Potential of Antibody-Drug Conjugates (ADC) with HALO® Image Analysis and Indica Labs Pharma Services
Antibody-drug conjugates (ADC) represent one of the most promising classes of next-generation cancer therapeutics, combining antibody-based targeting with the potency of chemotherapy.

Indica Labs’ Boston HALO® User Group Meeting 2026
12 May 2026 | Indica Labs is pleased to announce our Boston HALO® User Group Meeting at Le Méridien Boston Cambridge on 12 May from

Indica Labs’ Frankfurt HALO® User Group Meeting 2026
17 March 2026 | Indica Labs is pleased to announce our Frankfurt HALO® User Group Meeting at The Hilton Frankfurt Airport on 17 March from


Indica Labs’ London HALO® User Group Meeting 2025
9 December 2025 | Indica Labs is pleased to announce our London HALO® User Group Meeting at Hilton London Metropole on 9 December from 12:00
