
Quantify expression of an unlimited number of biomarkers in any cellular compartment - membrane, nucleus or cytoplasm.
Learn More
Quantify expression of up to five brightfield stains in any cellular compartment - membrane, nucleus or cytoplasm.
Learn More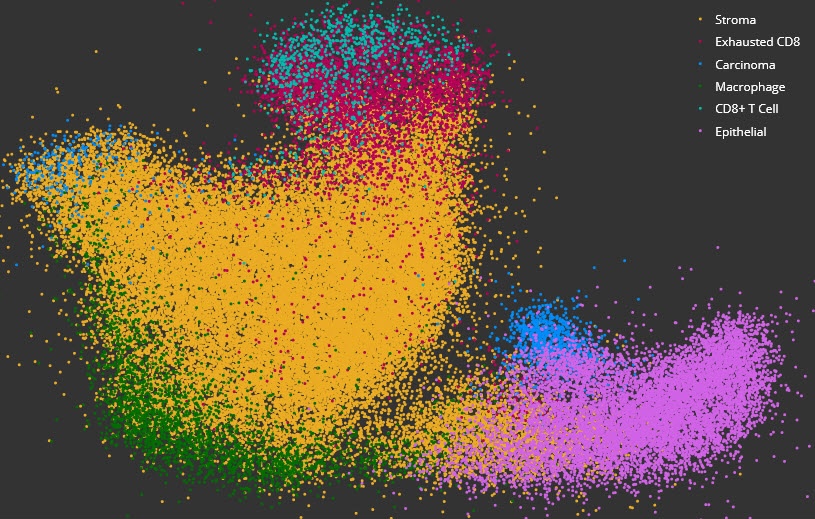
Acquire deeper insights into complex data sets using dimensional reduction and unsupervised clustering with interactive plotting.
Learn More
Plot cells and objects from one or more images and perform nearest neighbor analysis, proximity analysis, and tumor infiltration analysis.
Learn More
Use the HALO® FISH-IF module and reagents from Molecular Instruments or ACD, a Bio-techne brand, to simultaneously analyze an unlimited number of fluorescently-labeled DNA/RNA ISH probes and immunofluorescent protein biomarkers on a cell-by-cell basis.
Learn More
Simultaneously analyze up to three chromogenic and/or silver-labelled DNA or RNA ISH probes on a cell-by-cell basis, measuring spot numbers and area per cell and compartment, and calculated H-scores for each probe.
Learn More
Simultaneously analyze a nuclear stain and up to four IHC biomarkers or ISH probes on a cell-by-cell basis across brightfield images.
Learn More
Simultaneously analyze an unlimited number of fluorescent nucleic acid probes on a cell-by-cell basis, measuring spot numbers and area per cell and compartment, and calculated H-scores for each probe.
Learn More
Separate multiple tissue classes across a tissue using a learn-by-example approach. Can be used in conjunction with all other modules (fluorescent and brightfield) to select specific tissue classes for further analysis.
Learn More