


Use the HALO® FISH-IF module and reagents from Molecular Instruments or ACD, a Bio-techne brand, to simultaneously analyze an unlimited number of fluorescently-labeled DNA/RNA ISH probes and immunofluorescent protein biomarkers on a cell-by-cell basis. This module enables in-depth analysis of the corresponding protein and gene expression profile of every cell across the tissue, with outputs including biomarker positive cells in total and by cell compartment, probe copies and area per cell, and calculated H-scores for each probe. You can optimize image analysis with available pre-trained AI-based membrane and/or nuclear segmentation, now included with the HALO platform, and leverage interactive markups to dynamically explore colocalization and combined cell phenotypes.
Try it out! Click here to initiate your free proof-of-concept HALO image analysis.
- Non-proprietary (JPG, TIF, OME.TIFF) (JPG, TIF, OME.TIFF)
- Nikon (ND2)
- 3D Histech (MRXS)
- Akoya Biosciences/Quanterix (QPTIFF, component TIFF)
- Olympus / Evident (VSI)
- Hamamatsu (NDPI, NDPIS)
- Aperio/Leica Biosystems (SVS, AFI)
- Zeiss (CZI)
- Leica (SCN, LIF)
- Ventana/Roche (BIF)
- Philips (iSyntax, i2Syntax)
- KFBIO (KFB, KFBF)
- DICOM (DCM*)
*whole-slide images
COMET™ and RNAscope™ Image Analysis Using HALO and HALO AI
Read this collaborative app note to learn how our Pharma Services team leveraged the HALO FISH-IF and Spatial Analysis modules and HALO AI for analysis of COMET™ and RNAscope™ images.
HiPlex RNAscope™ Application Note
Using our FISH module we demonstrate how to perform 12-plex RNAscope image analysis using ACD’s HiPlexv2 assay.
Quantitative Image Analysis of a Combined FISH-IF Assay
Learn how to detect protein and RNA in a single assay using ACD’s Co-Detection workflow and HALO image analysis.

HCR™ Pro RNA-ISH Image Analysis Using HALO
Download our collaborative poster with Molecular Instruments to learn how membrane image analysis improved RNA-ISH quantification.

Identifying Immune Cell Phenotypes with RNAscope and HALO Image Analysis
Download our collaborative poster with ACD, a Bio-Techne Brand, on immune cell characterization using high-throughput spatial multiomics.
Spatial Characterization of the TME with Cell DIVE Multiplexed Imaging and HALO Image Analysis
Check out our collaborative poster with Cell Signaling Technology and Leica Microsystems to learn about a combined workflow for spatial analysis of the TME.
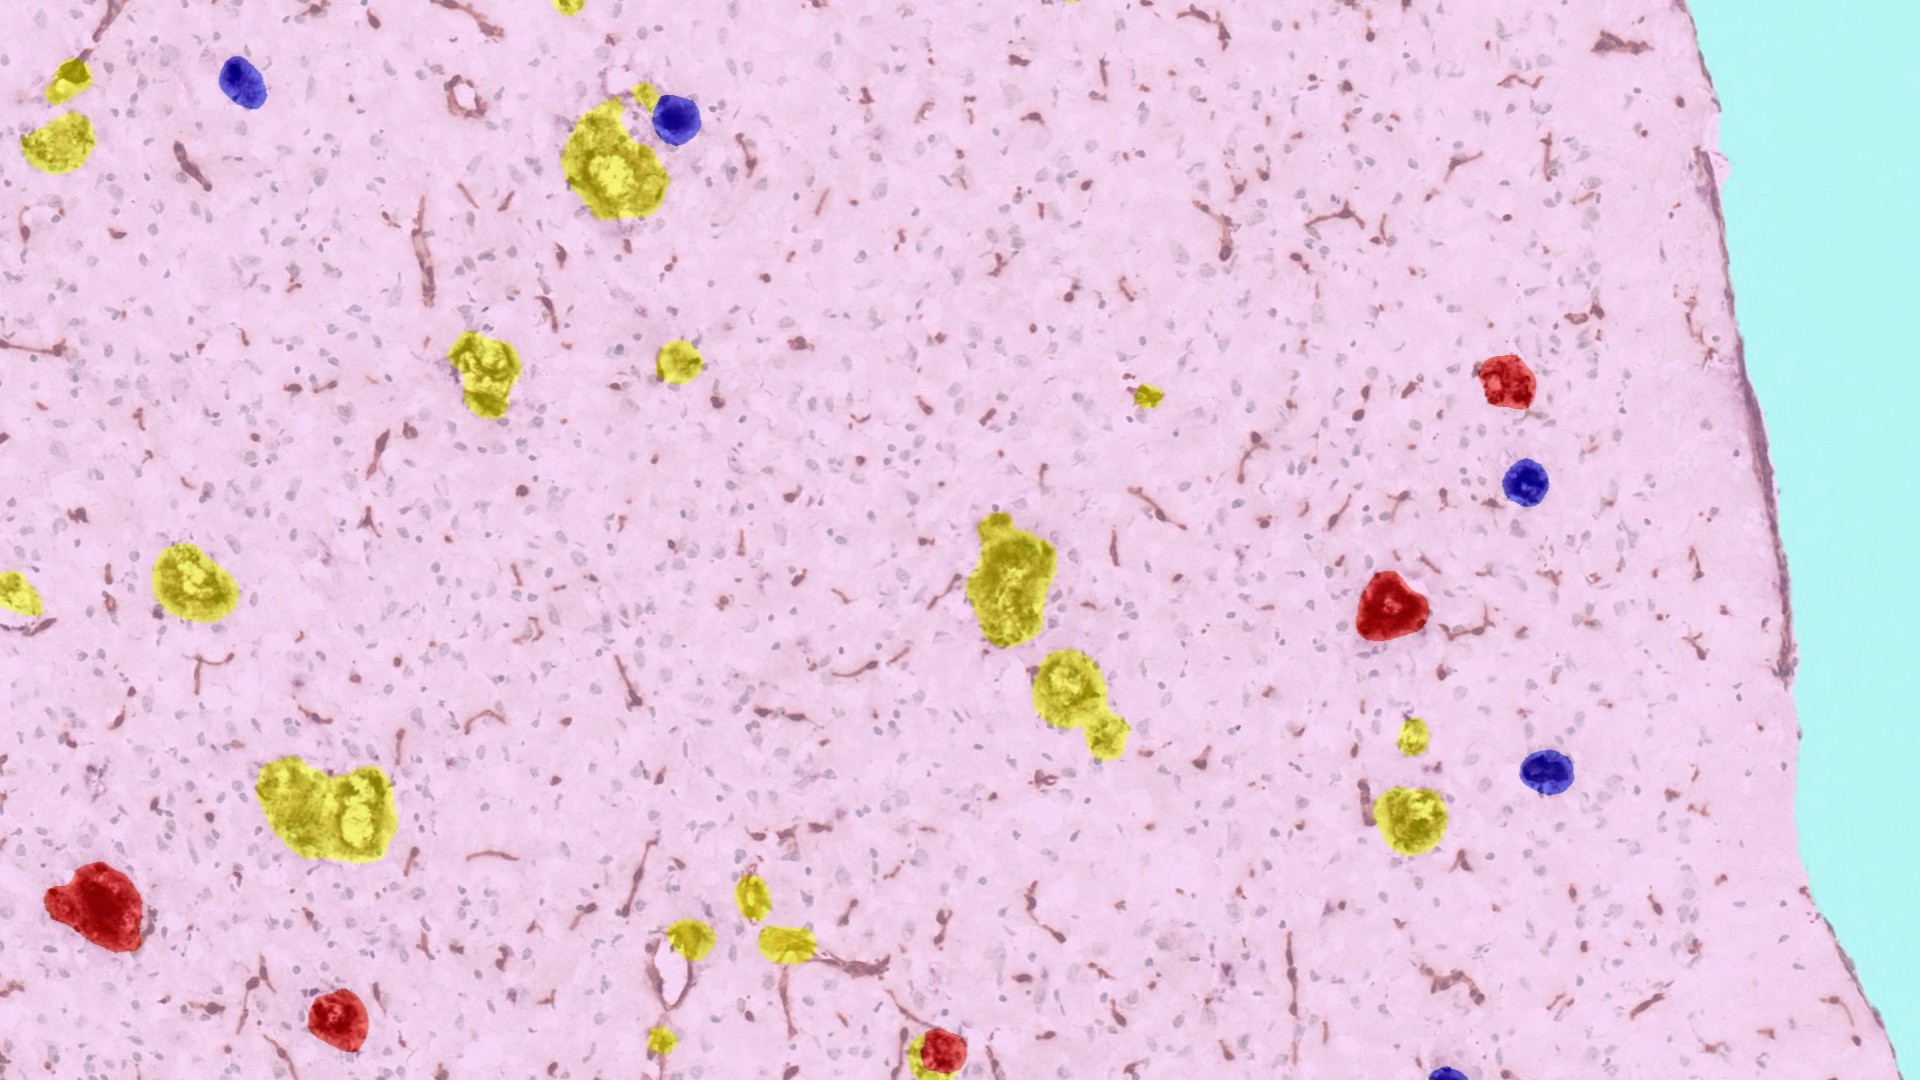
HALO® High Impact Publications
Learn how HALO image analysis is leveraged in fields from immuno-oncology to neuroscience and infectious disease in this selection of high-impact publications.

Quantitative RNAscope™ Image Analysis Guide
From experimental design considerations to optimized setup of HALO image analysis parameters, our guide will help take your quantitative RNAscope™ image analysis to the next level.
Advancing Neuroscience Research with HALO® and HALO AI
As scientists work to continue unraveling the structural, cellular, and molecular complexities of the brain and its diseases, the characteristics of this unique tissue pose
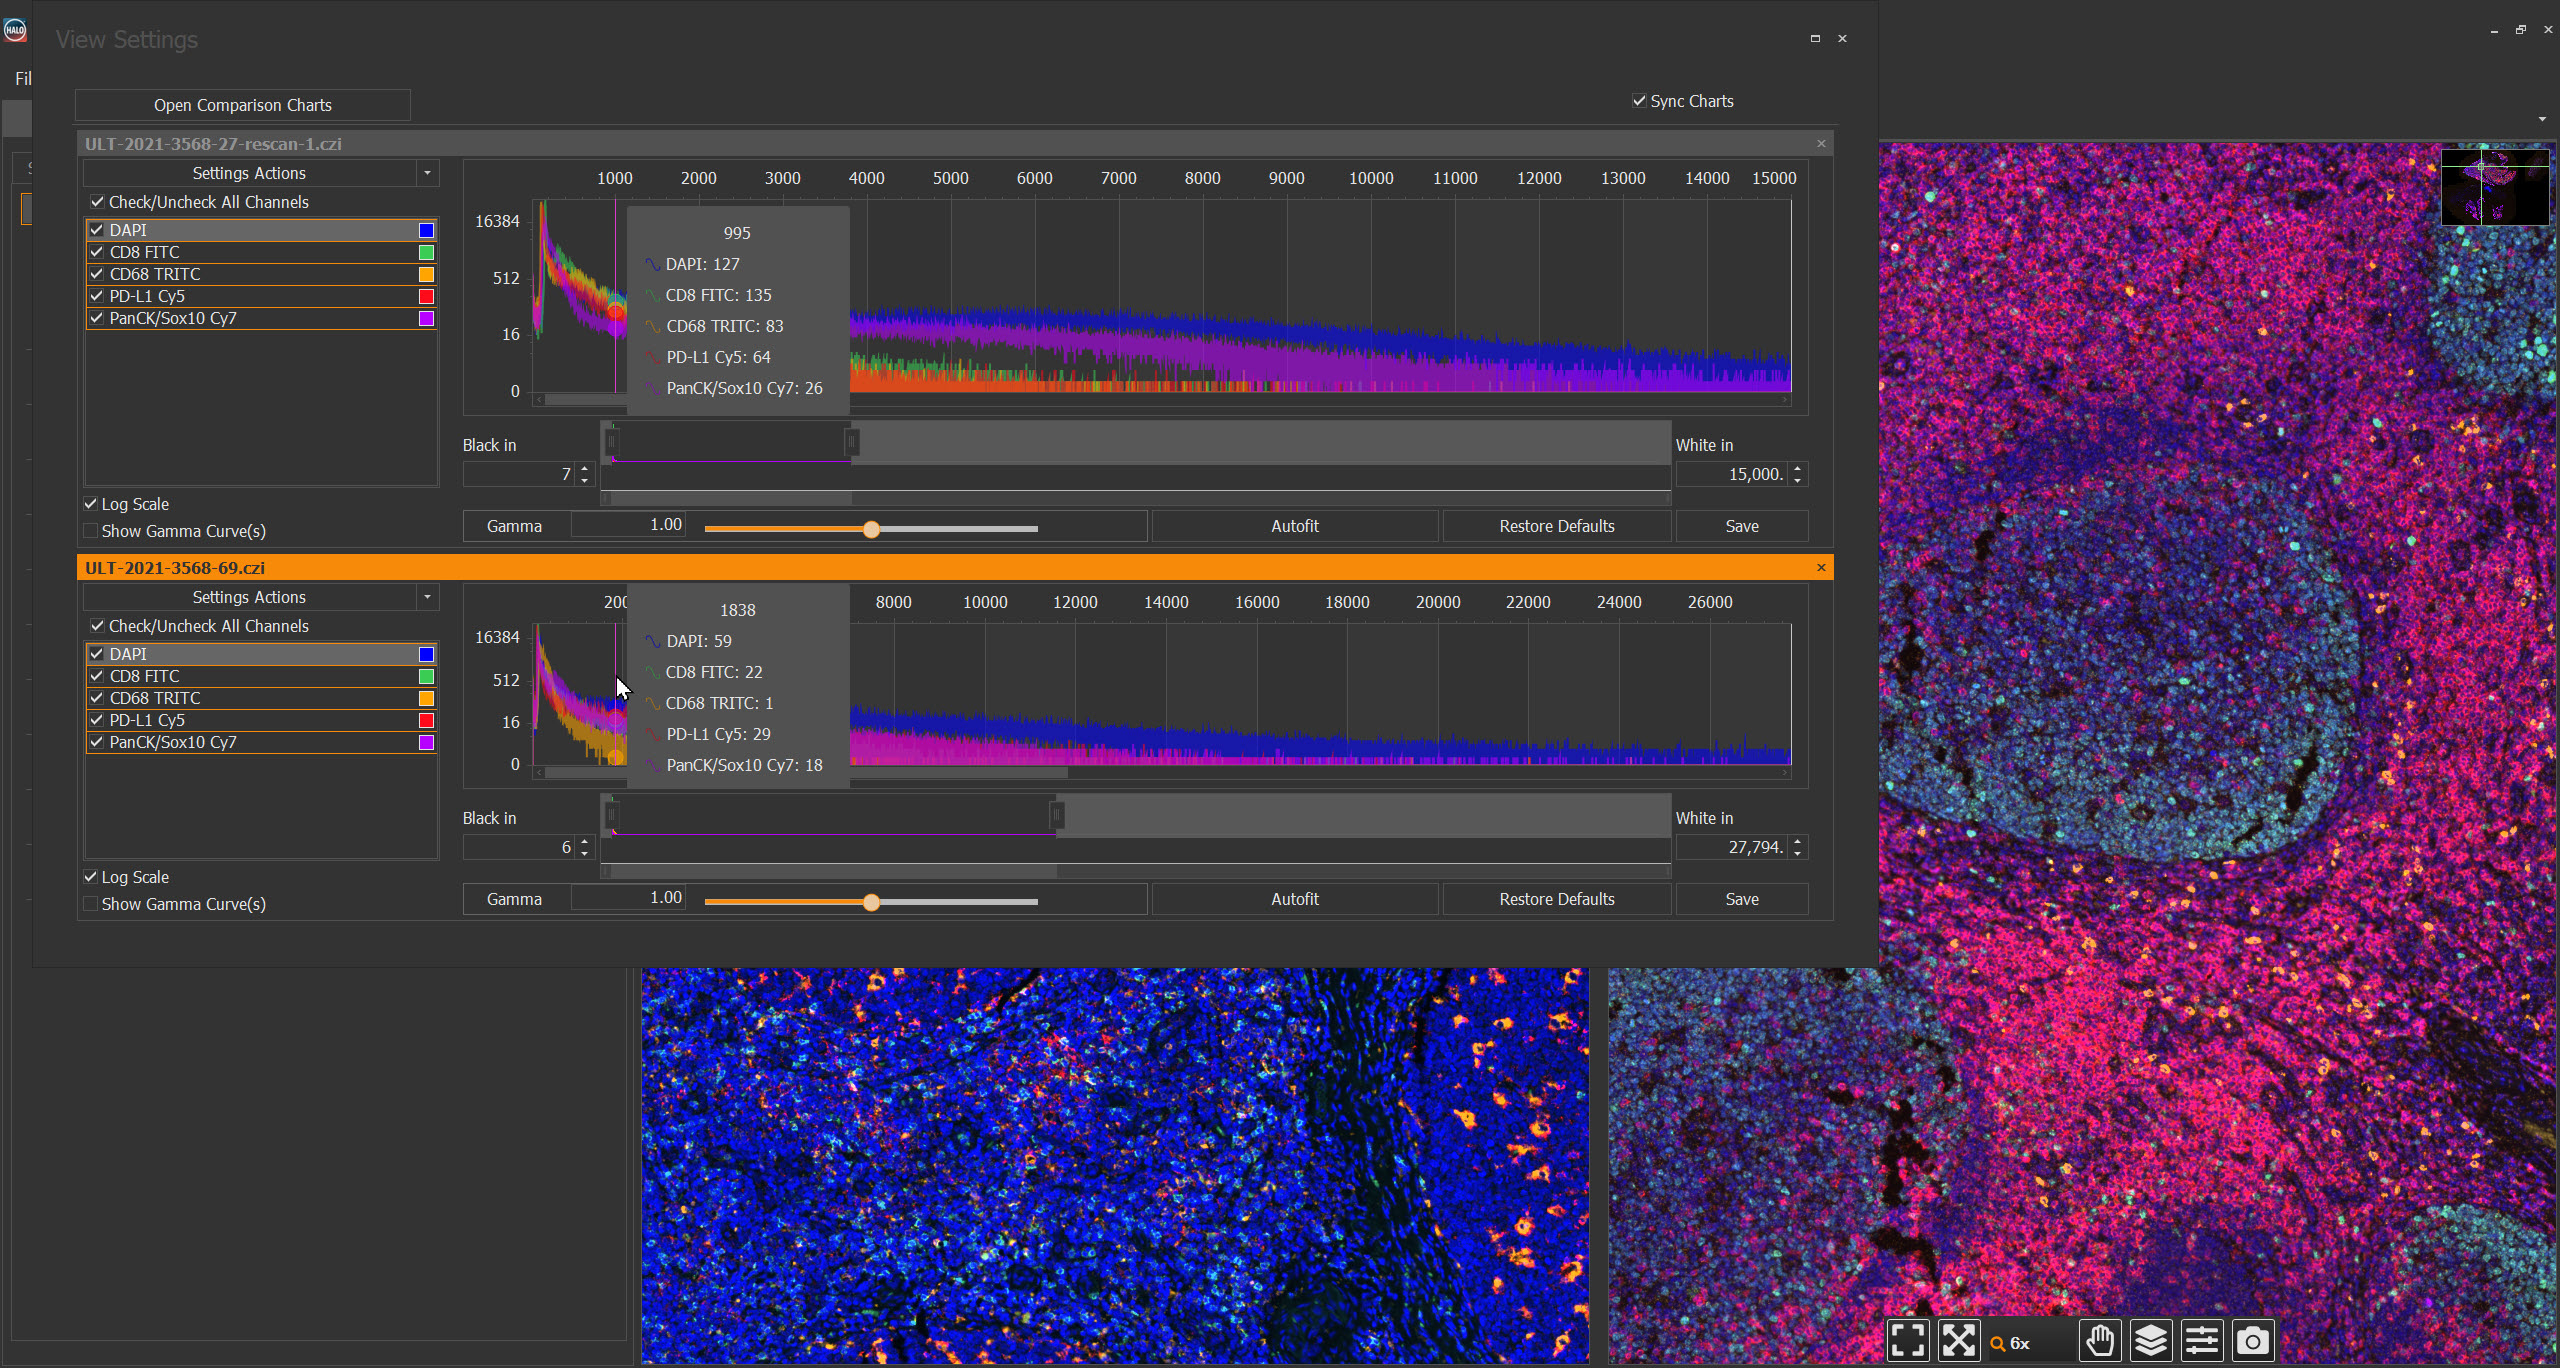
Clearly Visualize Digital Pathology Images with View Settings Adjustments and the Figure Maker Tool
In this blog we’ll explore these platforms’ tools for view settings adjustment for fluorescent images and the integrated Figure Maker tool. Together, these features equip

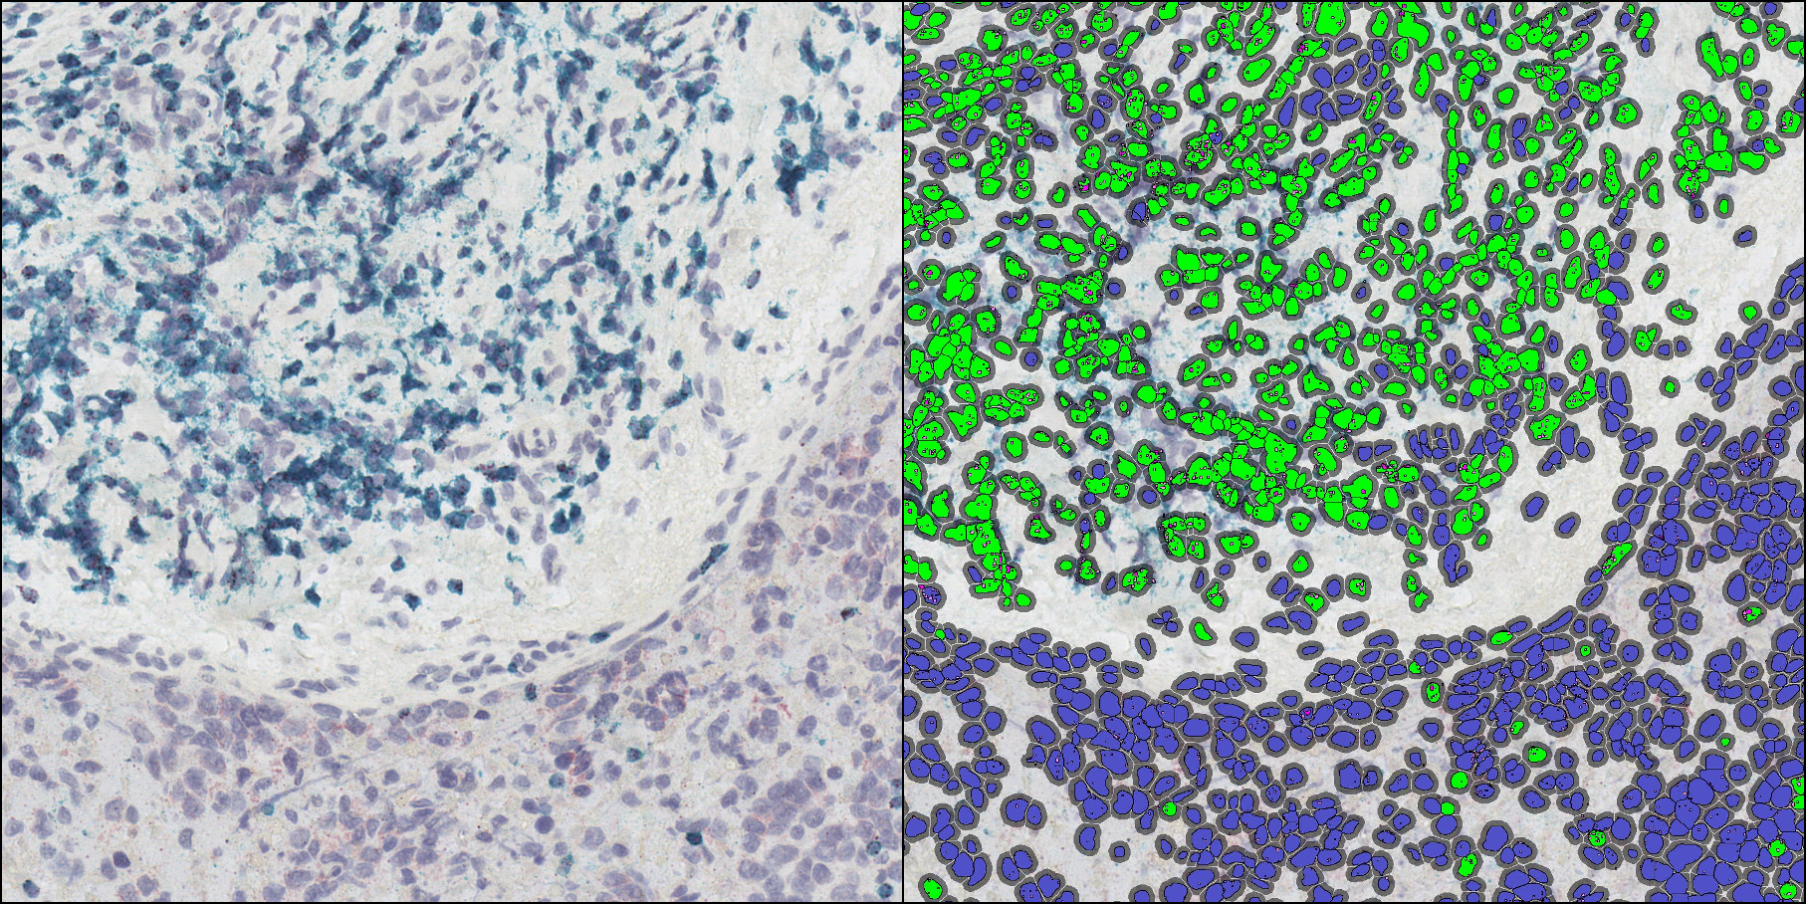
Interactive Markup Images: Providing a Dynamic Look at HALO® Analysis Results
At Indica Labs, our HALO platforms are optimized for ease-of-use as well as powerful, accurate analysis, and include multiple features to help users get the

Announcing HALO® Highplex FL and FISH-IF Modules Supporting AI Membrane Segmentation
In this blog post, you can learn about the AI membrane segmentation support added to the HALO® Highplex FL and FISH-IF modules, where to find

Getting Started with RNAscope™ Image Analysis in HALO®
28 March 2023 | Join us for this 1-hour webinar to see a live demonstration of RNAscope image analysis using the HALO® platform from Indica
Masterclass Webinar: Optimizing RNAscope Image Analysis
05 May 2022 | In this 60-min webinar, Dr. Ghislaine Lioux will present solutions to common RNAscope image analysis challenges including how to optimize color

Whole-slide Quantitative RNAscope Image Analysis: Applications and Methods
20 April 2022 | In this 2-hour event, learn from three experts in RNAscope image analysis with HALO® as they present their scientific research, share

HALO Image Analysis Masterclass Series: February-March 2021
Spring of 2021 | Indica Labs is excited to continue our HALO® Masterclass Webinar Series this winter. Each masterclass webinar will offer a deep dive
Publication Spotlight
The table below includes publications that cite the FISH-IF and module.
Your publication not on the list? Drop us an email to let us know about it!
| Title | Authors | Year | Journal | Topics | HALO Modules | Products |
|---|---|---|---|---|---|---|
| A novel molecular subtyping based on multi-omics analysis for prognosis predicting in colorectal melanoma: A 16-year prospective multicentric study | Liu C, Cheng X, Han K, Hong L, Hao S, Sun X, Xu J, Li B, Jin D, Tian W, Jin Y, Wang Y, Fang W, Bao X, Zhao P, Chen D | 2024 | Cancer Letters | Oncology | Highplex FL | HALO |
| Cholinergic signaling via muscarinic M1 receptor confers resistance to docetaxel in prostate cancer | Wang J, Wei J, Pu T, Zeng A, Karthikeyan V, Bechtold B, Vo K, Chen J, Lin TP, Chang AP, Corey E, Puhr M, Klocker H, Culig Z, Bland T, Wu BJ | 2024 | Cell Reports Medicine | Oncology | Highplex FL | HALO |
| INPP5A phosphatase is a synthetic lethal target in GNAQ and GNA11-mutant melanomas | Elbatsh AMO, Amin-Mansour AA, Haberkorn A, Textor C, Ebel N, Renard E, Koch LM, Groenveld FC, Piquet M, Naumann U, Ruddy DA, Romanet V, Martínez Gómez JM, Shirley MD, Wipfli P, Schnell C, Wartmann M, Rausch M, Jager MJ, Levesque MP, Maira SM, Manchado E | 2024 | Nature Cancer | Oncology | Cytonuclear | HALO |
| Mutant p53 gains oncogenic functions through a chromosomal instability-induced cytosolic DNA response | Zhao M, Wang T, Gleber-Netto F O, Chen Z, McGrail D J, Gomez J A, Ju W, Gadhikar M A, Ma W, Shen L, Wang Q, Tang X, Pathak S, Raso M G, Burks J K, Lin S-Y, Wang J, Multani A S, Pickering C R, Chen J, Myers J N, Zhou G | 2024 | Nature Communications | Oncology | Classifier | HALO |
| Neoadjuvant atezolizumab plus chemotherapy in gastric and gastroesophageal junction adenocarcinoma: the phase 2 PANDA trial | Verschoor YL, van de Haar J, van den Berg JG, van Sandick JW, Kodach LL, van Dieren JM, Balduzzi S, Grootscholten C, IJsselsteijn ME, Veenhof AAAF, Hartemink KJ, Vollebergh MA, Jurdi A, Sharma S, Spickard E, Owers EC, Bartels-Rutten A, den Hartog P, de Miranda NFCC, van Leerdam ME, Haanen JBAG, Schumacher TN, Voest EE, Chalabi M | 2024 | Nature Medicine | Immuno-oncology | Multiplex IHC | HALO |
| Preclinical evaluation of a novel CAR-T therapy utilizing a scFv antibody highly specific to MAGE-A4p230-239/HLA-A*02:01 complex | Wang L, Matsumoto M, Akahori Y, Seo N, Shirakura K, Kato T, Katsumoto Y, Miyahara Y, Shiku H | 2024 | Molecular Therapy | Immuno-oncology | Highplex FL | HALO |
| T-cell stimulating vaccines empower CD3 bispecific antibody therapy in solid tumors | Middelburg J, Sluijter M, Schaap G, Göynük B, Lloyd K, Ovcinnikovs V, Zom GG, Marijnissen RJ, Groeneveldt C, Griffioen L, Sandker GGW, Heskamp S, van der Burg SH, Arakelian T, Ossendorp F, Arens R, Schuurman J, Kemper K, van Hall T | 2024 | Nature Communications | Immuno-oncology | Cytonuclear | HALO |
| ERBB3 overexpression is enriched in diverse patient populations with castration-sensitive prostate cancer and is associated with a unique AR activity signature | Vellky J E, Kirkpatrick B J, Gutgesell L C, Morales M, Brown R M, Wu Y, Maienschein-Cline M, Notardonato L D, Weinfeld M S, Nguyen R H, Brister E, Sverdlov M, Liu L, Xu Z, Kregel S, Nonn L, Vander Griend D J, Reizine N M | 2024 | Clinical Cancer Research | Oncology | Area Quantification, TMA | HALO, HALO AI |
| Multiplex analysis of intratumoural immune infiltrate and prognosis in patients with stage II–III colorectal cancer from the SCOT and QUASAR 2 trials: a retrospective analysis | Frei AL, McGuigan A, Sinha RAK, Jabbar F, Gneo L, Tomasevic T, Harkin A, Iveson T, Saunders MP, Oien KA, Maka N, Pezzella F, Campo L, Browne M, Glaire M, Kildal W, Danielsen HE, Hay J, Edwards J, Sansom O, Kelly C, Tomlinson I, Kerr R, Kerr D, Domingo E, consortium T, Church DN, Koelzer VH | 2024 | The Lancet Oncology | Immuno-oncology | Area Quantification, Highplex FL | HALO, HALO AI |
| Pathway level subtyping identifies a slow-cycling biological phenotype associated with poor clinical outcomes in colorectal cancer | Malla S B, Byrne R M, Lafarge M W, Corry S M, Fisher N C, Tsantoulis P K, Mills M L, Ridgway R A, Lannagan T R M, Najumudeen A K, Gilroy K L, Amirkhah R, Maguire S L, Mulholland E J, Belnoue-Davis H L, Grassi E, Viviani M, Rogan E, Redmond K L, Sakhnevych S, McCooey A J, Bull C, Hoey E, Sinevici N, Hall H, Ahmaderaghi B, Domingo E, Blake A, Richman S D, Isella C, Miller C, Bertotti A, Trusolino L, Loughrey M B, Kerr E M, Tejpar S, Maughan T S, Lawler M, Campbell A D, Leedham S J, Koelzer V H, Sansom O J, Dunne P D | 2024 | Nature Genetics | Oncology | Area Quantification | HALO |
| Early immune remodeling steers clinical response to frontline chemoimmunotherapy in advanced gastric cancer | An M, Mehta A, Min BH, Geo YJ, Wright SJ, Parikh M, Bi L, Lee H, Kim TJ, Lee SY, Moon J, Park RJ, Strickland MR, Park WY, Kang WK, Kim KM, Kim ST, Lempner SJ, Lee J | 2024 | Cancer Discovery | Immuno-oncology | Classifier, Highplex FL | HALO |
| Neoadjuvant radioimmunotherapy in pancreatic cancer enhances effector T cell infiltration and shortens their distances to tumor cells | WANG J, GAI J, ZHANG T, NIU N, QI H, THOMAS II D L, LI K, XIA T, RODRIGUEZ C, PARKINSON R, DURHAM J, MCPHAUL T, NARANG A K, ANDERS R A, OSIPOV A, WANG H, HE J, LAHERU D A, HERMAN J M, LEE V, JAFFEE E M, THOMPSON E D, ZHU Q, ZHENG L | 2024 | Science Advances | Immuno-oncology | Spatial Analysis, Highplex FL, Registration | HALO |
| Stromal-derived MAOB promotes prostate cancer growth and progression | Pu T, Wang J, Wei J, Zeng A, Zhang J, Chen J, Yin L, Li J, Lin T, Melamed J, Corey E, Gao A, Wu B | 2024 | Science Advances | Oncology | Multiplex IHC, Highplex FL | HALO |
| Multiomic molecular characterization of the response to combination immunotherapy in MSS/pMMR metastatic colorectal cancer | Takei S, Tanaka Y, Lin Y, Koyama S, Fukuoka S, Hara H, Nakamura Y, Kuboki Y, Kotani D, Kojima T, Bando H, Mishima S, Ueno T, Kojima S, Wakabayashi M, Sakamoto N, Kojima M, Kuwata T, Yoshino T, Nishikawa H, Mano H, Endo I, Shitara K, Kawazoe A | 2024 | Journal for Immunotherapy of Cancer | Immuno-oncology | Highplex FL | HALO |
| Sema6D forward signaling impairs T cell activation and proliferation in head and neck cancer | Hirai T, Naito Y, Koyama S, Nakanishi Y, Masuhiro K, Izumi M, Kuge T, Naito M, Mizuno Y, Yamaguchi Y, Kang S, Yaga M, Futami Y, Nojima S, Nishide M, Morita T, Kato Y, Tsuda T, Takemoto N, Kinugasa-Katayama Y, Aoshi T, Villa J K, Yamashita K, Enokida T, Hoshi Y, Matsuura K, Tahara M, Takamatsu H, Takeda Y, Inohara H, Kumanogoh A | 2024 | JCI Insight | Immuno-oncology | Highplex FL | HALO |
| HKDC1 promotes tumor immune evasion in hepatocellular carcinoma by coupling cytoskeleton to STAT1 activation and PD-L1 expression | Zhang Y, Wang M, Ye L, Shen S, Zhang Y, Qian X, Zhang T, Yuan M, Ye Z, Cai J, Meng X, Qiu S, Liu S, Liu R, Jia W, Yang X, Zhang H, Zhong X, Gao P | 2024 | Nature Communications | Oncology | Multiplex IHC | HALO |
| Myeloid-Mas Signaling Modulates Pathogenic Crosstalk among MYC+CD63+ Endothelial Cells, MMP12+ Macrophages, and Monocytes in Acetaminophen-Induced Liver Injury | Chen S, Lu Z, Zhao Y, Xia L, Liu C, Zuo S, Jin M, Jia H, Li S, Zhang S, Yang B, Wang Z, Li J, Wang F, Yang C | 2024 | Advanced Science | Gastroenterology | Highplex FL | HALO |
| Cooperative pro-tumorigenic adaptation to oncogenic RAS through epithelial-to-mesenchymal plasticity | De Blander H, Tonon L, Fauvet F, Pommier R M, Lamblot C, Benhassoun R, Angileri F, Gibert B, Rodriguez R, Ouzounova M, Morel A P, Puisieux A | 2024 | Science Advances | Oncology | Highplex FL | HALO |
| Pathway level subtyping identifies a slow-cycling biological phenotype associated with poor clinical outcomes in colorectal cancer | Malla S B, Byrne R M, Lafarge M W, Corry S M, Fisher N C, Tsantoulis P K, Mills M L, Ridgway R A, Lannagan T R M, Najumudeen A K, Gilroy K L, Amirkhah R, Maguire S L, Mulholland E J, Belnoue-Davis H L, Grassi E, Viviani M, Rogan E, Redmond K L, Sakhnevych S, McCooey A J, Bull C, Hoey E, Sinevici N, Hall H, Ahmaderaghi B, Domingo E, Blake A, Richman S D, Isella C, Miller C, Bertotti A, Trusolino L, Loughrey M B, Kerr E M, Tejpar S, Maughan T S, Lawler M, Campbell A D, Leedham S J, Koelzer V H, Sansom O J, Dunne P D | 2024 | Nature Genetics | Oncology | Area Quantification | HALO |
| IGF2BP3 enhances lipid metabolism in cervical cancer by upregulating the expression of SCD | Han C, Hu C, Liu T, Sun Y, Hu F, He Y, Zhang J, Chen J, Ding J, Fan J, Zhang X, Wang J, Qiao X, Jiang D, Yang K, Yang S | 2024 | Cell Death & Disease | Oncology | Multiplex IHC | HALO |
| Homocysteine potentiates amyloid β-induced death receptor 4- and 5-mediated cerebral endothelial cell apoptosis, blood brain barrier dysfunction and angiogenic impairment | Carey A, Parodi-Rullan R, Vazquez-Torres R, Canepa E, Fossati S | 2024 | Aging Cell | Neuroscience | Area Quantification | HALO |
| Impact of metronomic trabectedin combined with low-dose cyclophosphamide on sarcoma microenvironment and correlation with clinical outcome: results from the TARMIC study | Sun C-M, Toulmonde M, Spalato-Ceruso M, Peyraud F, Bessede A, Kind M, Cousin S, Buy X, Palussiere J, Bougouin A, Sautès-Fridman C, Fridman H W, Pulido M, Italiano A | 2024 | Molecular Cancer | Oncology | Multiplex IHC, Highplex FL | HALO |
| Single-cell and spatial multi-omics highlight effects of anti-integrin therapy across cellular compartments in ulcerative colitis | Mennillo E, Kim Y, Lee G, Rusu I, Patel R K, Dorman L C, Flynn E, Li S, Bain J L, Andersen C, Rao A, Tamaki S, Tsui J, Shen A, Lotstein M L, Rahim M, Naser M, Bernard-Vazquez F, Eckalbar W, Cho S, Beck K, El-Nachef N, Lewin S, Selvig D R, Terdiman J P, Mahadevan U, Oh D Y, Fragiadakis G K, Pisco A, Combes A J, Kattah M G | 2024 | Nature Communications | Immunology | ISH, Spatial Analysis, Highplex FL, TMA | HALO, HALO AI |
| Selective CDK7 inhibition suppresses cell cycle progression and MYC signaling while enhancing apoptosis in therapy-resistant estrogen receptor positive breast cancer | Guarducci C, Nardone A, Russo D, Nagy Z, Heraud C, Grinshpun A, Zhang Q, Freelander A, Leventhal M J, Feit A, Feiglin A, Liu W, Hermida-Prado F, Kesten N, Ma W, De Angelis C, Morlando A, O'Donnell M, Naumenko S, Huang S, Nguyen Q, Huang Y, Malorni L, Bergholz J S, Zhao J J, Fraenkel E, Lim E, Schiff R, Shapiro G I, Jeselsohn R | 2024 | Clinical Cancer Research | Oncology | Multiplex IHC | HALO |
| PABPC1L induces IDO1 to promote tryptophan metabolism and immune suppression in renal cell carcinoma | Shu G, Chen M, Liao W, Fu L, Lin M, Gui C, Cen J, Lu J, Chen Z, Wei J, Chen W, Wang Y, Zhu J, Zhao T, Liu X, Jing J, Liu G, Pan Y, Luo J, Zhang J | 2024 | Cancer Research | Oncology | Highplex FL | HALO, HALO AI |
| Identification of tyrosine brominated extracellular matrix proteins in normal and fibrotic lung tissues | Cruz LC, Habibovic A, Dempsey B, Massafera MP, Janssen-Heininger YM, Lin MJ, Hoffman ET, Weiss DJ, Huang SK, van der Vliet A, Meotti FC | 2024 | Redox Biology | Fibrosis | Area Quantification, Highplex FL | HALO |
| Identification of the metaphyseal skeletal stem cell building trabecular bone | Yang G, He Q, Guo X, Li R, Lin J, Lang Y, Tao W, Liu W, Lin H, Xing S, Qi Y, Xie Z, Han J, Zhou B, Teng Y, Yang X | 2024 | Science Advances | Other | Highplex FL | HALO |
| Serum amyloid A promotes glycolysis of neutrophils during PD-1 blockade resistance in hepatocellular carcinoma | He M, Liu Y, Chen S, Deng H, Feng C, Qiao S, Chen Q, Hu Y, Chen H, Wang X, Jiang X, Xia X, Zhao M, Lyu N | 2024 | Nature Communications | Immuno-oncology | Spatial Analysis, Highplex FL | HALO |
| Peripheral neural interfaces: Skeletal muscles are hyper-reinnervated according to the axonal capacity of the surgically rewired nerves | Tereshenko V, Dotzauer D C, Schmoll M, Harnoncourt L, Carrero Rojas G, Gfrerer L, Eberlin K R, Austen Jr. W G, Blumer R, Farina D, Aszmann O C | 2024 | Science Advances | Neuroscience | HALO | |
| Nanoparticle mediated photodynamic therapy as a method to ablate oral cavity squamous cell carcinoma in preclinical models | Sahovaler A, Valic M, Townson J, Chan H, Zheng M, Tzelnick S, Mondello T, Pener-Tessler A, Eu D, El-Sayes A, Ding L, Chen J, Douglas C, Weersink R, Muhanna N, Zheng G, Irish J | 2024 | Cancer Research | Oncology | Classifier, Multiplex IHC | HALO |
| BCL-XL inhibitors enhance the apoptotic efficacy of BRAF inhibitors in BRAFV600E colorectal cancer | Jenkins L, Luk I, Chionh F, Tan T, Needham K, Ayton J, Reehorst C, Vukelic N, Sieber O, Mouradov D, Gibbs P, Williams D, Tebbutt N, Desai J, Hollande F, Dhillon A, Lee E, Merino D, Fairlie W, Mariadason J | 2024 | Cell Death & Disease | Oncology | Area Quantification | HALO |
| Tertiary lymphoid structures predict survival and response to neoadjuvant therapy in locally advanced rectal cancer | Wang Q, Zhong W, Shen X, Hao Z, Wan M, Yang X, An R, Zhu H, Cai H, Li T, Lv Y, Dong X, Chen G, Liu A, Du J | 2024 | Precision Oncology | Oncology | Multiplex IHC | HALO |
| PDGFRa+ ITGA11+ fibroblasts foster early-stage cancer lymphovascular invasion and lymphatic metastasis via ITGA11-SELE interplay | Zheng H, An M, Luo Y, Diao X, Zhong W, Pang M, Lin Y, Chen J, Li Y, Kong Y, Zhao Y, Yin Y, Ai L, Huang J, Chen C, Lin T | 2024 | Cancer Cell | Oncology | Spatial Analysis, Highplex FL | HALO |
| LRRK2 kinase inhibition reverses G2019S mutation-dependent effects on tau pathology progression | Lubben N, Brynildsen JK, Webb CN, Li HL, Leyns CEG, Changolkar L, Zhang B, Meymand ES, O'Reilly M, Madaj Z, DeWeerd D, Fell MJ, Lee VMY, Bassett DS, Henderson MX | 2024 | Translational Neurodegeneration | Neuroscience | HALO, HALO AI | |
| Multi-omics and imaging mass cytometry characterization of human kidneys to identify pathways and phenotypes associated with impaired kidney function. | Asowata E O, Romoli S, Sargeant R, Tan J Y, Hoffmann S, Huang M M, Mahbubani K T, Krause F N, Jachimowicz D, Agren R, Koulman A, Jenkins B, Musial B, Griffin J L, Soderberg M, Ling S, Hansen P B L, Saeb-Parsy K, Woollard K J | 2024 | Kidney International | Other | ISH, Spatial Analysis, Highplex FL | HALO, HALO AI |
| Carrier-Free, Amorphous Verteporfin Nanodrug for Enhanced Photodynamic Cancer Therapy and Brain Drug Delivery | Quinlan J A, Inglut C T, Srivastava P, Rahman I, Stabile J, Gaitan B, Valle C A D, Baumiller K, Gaur A, Chiou W A, Karim B, Connolly N, Robey R W, Woodworth G F, Gottesman M M, Huang H C H | 2024 | Advanced Science | Oncology | HALO | |
| A small-molecule TNIK inhibitor targets fibrosis in preclinical and clinical models | Ren F, Aliper A, Chen J, Zhao H, Rao S, Kuppe C, Ozerov I V, Zhang M, Witte K, Kruse C, Aladinskiy V, Ivanenkov Y, Polykovskiy D, Fu Y, Babin E, Qiao J, Liang X, Mou Z, Wang H, Pun F W, Ayuso P T, Veviorskiy A, Song D, Liu S, Zhang B, Naumov V, Ding X, Kukharenko A, Izumchenko E, Zhavoronkov A | 2024 | Nature Biotechnology | Fibrosis | Area Quantification | HALO |
| An immune cell map of human lung adenocarcinoma development reveals an anti-tumoral role of the Tfh-dependent tertiary lymphoid structure | Liu W, You W, Lan Z, Ren Y, Gao S, Li S, Chen W, Huang C, Zeng Y, Xiao N, Wang Z, Xie H, Ma H, Chen Y, Wang G, Chen C, Li H | 2024 | Cell Reports Medicine | Immuno-oncology | Multiplex IHC, Highplex FL | HALO |
| Delivery of a BET protein degrader via a CEACAM6-targeted antibody–drug conjugate inhibits tumour growth in pancreatic cancer models | Nakazawa Y, Miyano M, Tsukamoto S, Kogai H, Yamamoto A, Iso K, Inoue S, Yamane Y, Yabe Y, Umihara H, Taguchi J, Akagi T, Yamaguchi A, Koga M, Toshimitsu K, Hirayama T, Mukai Y, Machinaga A | 2024 | Nature Communications | Oncology | Area Quantification | HALO |
| Efficacy and safety of PD-1 blockade plus long-course chemoradiotherapy in locally advanced rectal cancer (NECTAR): a multi-center phase 2 study | Yang Z, Gao J, Zheng J, Han J, Li A, Liu G, Sun Y, Zhang J, Chen G, Xu R, Zhang X, Liu Y, Bai Z, Deng W, He W, Yao H, Zhang Z | 2024 | Signal Transduction and Targeted Therapy | Immuno-oncology | Highplex FL | HALO |
| MSUT2 regulates tau spreading via adenosinergic signaling mediated ASAP1 pathway in neurons | Xu H, Qiu Q, Hu P, Hoxha K, Jang E, O'Reilly M, Kim C, He Z, Marotta N, Changolkar L, Zhang B, Wu H, Schellenberg G D, Kraemer B, Luk K C, Lee E B, Trojanowski J Q, Brunden K R, Lee V M-Y | 2024 | Acta Neuropathologica | Neuroscience | Area Quantification | HALO |
| A single nuclear transcriptomic characterisation of mechanisms responsible for impaired angiogenesis and blood-brain barrier function in Alzheimer’s disease | Tsartsalis S, Sleven H, Fancy N, Wessely F, Smith A M, Willumsen N, Cheung T K D, Rokicki M J, Chau V, Ifie E, Khozoie C, Ansorge O, Yang X, Jenkyns M H, Davey K, McGarry A, Muirhead R C J, Debette S, Jackson J S, Montagne A, Owen D R, Miners J S, Love S, Webber C, Cader M Z, Matthews P M | 2024 | Nature Communications | Neuroscience | Area Quantification, Multiplex IHC | HALO |
| Female mice display sex-specific differences in cerebrovascular function and subarachnoid haemorrhage-induced injury | Dinh DD, Wan H, Lidington D, Bolz SS | 2024 | eBioMedicine | Neuroscience | Object Colocalization, Microglia | HALO |
| Infection with SARS-CoV-2 can cause pancreatic impairment | Deng W, Bao L, Song Z, Zhang L, Yu P, Xu Y, Wang J, Zhao W, Zhang X, Han Y, Li Y, Liu J, Lv Q, Liang X, Li F, Qi F, Deng R, Wang S, Xiong Y, Xiao R, Wang H, Qin C | 2024 | Signal Transduction and Targeted Therapy | Infectious Disease | HALO | |
| HSPA4 upregulation induces immune evasion via ALKBH5/CD58 axis in gastric cancer | Suo D, Gao X, Chen Q, Zeng T, Zhan J, Li G, Zheng Y, Zhu S, Yun J, Guan XY, Li Y | 2024 | Journal of Experimental & Clinical Cancer Research | Immuno-oncology | Spatial Analysis, Highplex FL | HALO |
| Translational and Therapeutic Evaluation of RAS-GTP Inhibition by RMC-6236 in RAS-Driven Cancers | Jiang J, Jiang L, Maldonato B J, Wang Y, Holderfield M, Aronchik I, Winters I P, Salman Z, Blaj C, Menard M, Brodbeck J, Chen Z, Wei X, Rosen M J, Gindin Y, Lee B J, Evans J W, Chang S, Wang Z, Seamon K J, Parsons D, Cregg J, Marquez A, Tomlinson A C A, Yano J K, Knox J E, Quintana E, Aguirre A J, Arbour K C, Reed A, Gustafson W C, Gill A L, Koltun E S, Wildes D, Smith J A M, Wang Z, Singh M | 2024 | Cancer Discovery | Oncology | Classifier, Area Quantification, Cytonuclear | HALO |
| Single-cell RNA sequencing reveals inflammatory retinal microglia in experimental autoimmune uveitis | Liu J, Liao X, Li N, Xu Z, Yang W, Zhou H, Liu Y, Zhang Z, Wang G, Hou S | 2024 | MedComm | Immunology | Highplex FL | HALO |
| Targeting pathogenic CD8+ tissue-resident T cells with chimeric antigen receptor therapy in murine autoimmune cholangitis | Zhu HX, Yang SH, Gao CY, Bian ZH, Chen XM, Huang RR, Meng QL, Li X, Jin H, Tsuneyama K, Han Y, Li L, Zhao ZB, Gershwin ME, Lian ZX | 2024 | Nature Communications | Immunology | Spatial Analysis, Highplex FL | HALO |
| Direct and selective pharmacological disruption of the YAP–TEAD interface by IAG933 inhibits Hippo-dependent and RAS–MAPK-altered cancers | Chapeau E, Sansregret L, Galli G, Chène P, Wartmann M, Mourikis T, Jaaks P, Baltschukat S, Barbosa I, Bauer D, Brachmann S, Delaunay C, Estadieu C, Faris J, Furet P, Harlfinger S, Hueber A, Núñez E, Kodack D, Mandon E, Martin T, Mesrouze Y, Romanet V, Scheufler C, Schmelzle T | 2024 | Nature Cancer | Oncology | Area Quantification, Cytonuclear | HALO |
| Landscape of brain myeloid cell transcriptome along the spatiotemporal progression of Alzheimer’s disease reveals distinct sequential responses to Aβ and tau | Wachter A, Woodbury M E, Lombardo S, Abdourahman A, Wuest C, McGlame E, Pastika T, Tamm J, Romanul N, Yanamandra K, Bennett R, Lin G, Kwon T, Liao F, Klein C, Grinberg Y, Jaisa-aad M, Li H, Frosch M P, Kummer M P, Das S, Dellovade T, Karran E H, Langlois X, Ried J S, Serrano-Pozo A, Talanian R V, Biber K, Hyman B T | 2024 | Acta Neuropathologica | Neuroscience | Area Quantification | HALO |
| Loss of GABARAP mediates resistance to immunogenic chemotherapy in multiple myeloma | Gulla A, Morelli E, Johnstone M, Turi M, Samur M K, Botta C, Cifric S, Folino P, Vinaixa D, Barello F, Clericuzio C, Favasuli V K, Maisano D, Talluri S, Prabhala R H, Bianchi G, Fulciniti M, Wen K, Kurata K, Liu J, Penailillo J, Bragoni A, Sapino A, Richardson P G, Chauhan D, Carrasco R D, Hideshima T, Munshi N C, Anderson K C | 2024 | Blood | Oncology | Highplex FL | HALO |
| OH2 oncolytic virus: A novel approach to glioblastoma intervention through direct targeting of tumor cells and augmentation of anti-tumor immune responses | Zheng Y, Wang X, Ji Q, Fang A, Song L, Xu X, Lin Y, Peng Y, Yu J, Xie L, Chen F, Li X, Zhu S, Zhang B, Zhou L, Yu C, Wang Y, Wang L, Hu H, Zhang Z, Li W | 2024 | Cancer Letters | Oncology | Highplex FL | HALO |
| Molecular assessment of intratumoral immune cell subsets and potential mechanisms of resistance to odronextamab, a CD20×CD3 bispecific antibody, in patients with relapsed/refractory B-cell non-Hodgkin lymphoma | Brouwer-Visser J, Fiaschi N, Deering R P, Cygan K J, Scott D, Jeong S, Boucher L, Gupta N T, Gupta S, Adler C, Topp M S, Bannerji R, Duell J, Advani R H, Flink D M, Chaudhry A, Thurston G, Ambati S R, Jankovic V | 2024 | Journal for Immunotherapy of Cancer | Immuno-oncology | Highplex FL | HALO |
| Inhibition of IL-25/IL-17RA improves immune-related adverse events of checkpoint inhibitors and reveals antitumor activity | Hu X, Bukhari SM, Tymm C, Adam K, Lerrer S, Henick BS, Winchester RJ, Mor A | 2024 | Journal for Immunotherapy of Cancer | Immuno-oncology | Multiplex IHC | HALO |
| Conserved immuno-collagenic subtypes predict response to immune checkpoint blockade | Mei J, Cai Y, Xu R, Li Q, Chu J, Luo Z, Sun Y, Shi Y, Xu J, Li D, Li S, Jiang Y, Liu J, Qian Z, Zhou J, Wan M, Yang Y, Zhu Y, Zhang Y, Yin Y | 2024 | Cancer Communications | Immuno-oncology | Area Quantification | HALO |
| Tertiary lymphoid structures and B cells determine clinically relevant T cell phenotypes in ovarian cancer | Kasikova L, Rakova J, Hensler M, Lanickova T, Tomankova J, Pasulka J, Drozenova J, Mojzisova K, Fialova A, Vosahlikova S, Laco J, Ryska A, Dundr P, Kocian R, Brtnicky T, Skapa P, Capkova L, Kovar M, Prochazka J, Praznovec I, Koblizek V, Taskova A, Tanaka H, Lischke R, Mendez F C, Jr J V, Heinzelmann-Schwarz V, Jacob F, McNeish I A, Halaska M J, Rob L, Cibula D, Orsulic S, Galluzzi L, Spisek R, Fucikova J | 2024 | Nature Communications | Oncology | Classifier, Highplex FL, Registration | HALO |
| Metabolic targeting of cancer associated fibroblasts overcomes T-cell exclusion and chemoresistance in soft-tissue sarcomas | Broz M T, Ko E Y, Ishaya K, Xiao J, De Simone M, Hoi X P, Piras R, Gala B, Tessaro F H G, Karlstaedt A, Orsulic S, Lund A W, Chan K S, Guarnerio J | 2024 | Nature Communications | Oncology | Highplex FL | HALO |
| CXCL9/10-engineered dendritic cells promote T cell activation and enhance immune checkpoint blockade for lung cancer | Lim R J, Salehi-Rad R, Tran M L, Oh M S, Dumitras C, Crosson W P, Li R, Patel T S, Man S, Yean C E, Abascal J, Huang Z, Ong S L, Krysan K, Dubinett S M, Liu B | 2024 | Cell Reports Medicine | Immuno-oncology | Spatial Analysis, Highplex FL | HALO |
| Oncogenic cell tagging and single-cell transcriptomics reveal cell type-specific and time-resolved responses to Vhl inactivation in the kidney | Kurlekar S, Lima J, Li R, Lombardi O, Masson N, Barros A, Pontecorvi V, Mole D, Pugh C, Adam J, Ratcliffe P | 2024 | Cancer Research | Oncology | Multiplex IHC | HALO, HALO AI |
| N6-methyladenosine-modified circSLCO1B3 promotes intrahepatic cholangiocarcinoma progression via regulating HOXC8 and PD-L1 | Li J, Xu X, Xu K, Zhou X, Wu K, Yao Y, Liu Z, Chen C, Wang L, Sun Z, Jiao D, Han X | 2024 | Journal of Experimental & Clinical Cancer Research | Oncology | Area Quantification, FISH, Highplex FL, TMA | HALO |
| Presynaptic density determined by SV2A PET is closely associated with postsynaptic metabotropic glutamate receptor 5 availability and independent of amyloid pathology in early cognitive impairment | Wang J, Huang Q, He K, Li J, Guo T, Yang Y, Lin Z, Li S, Vanderlinden G, Huang Y, Laere K, Guan Y, Guo Q, Ni R, Li B, Xie F | 2024 | Alzheimer's & Dementia | Neuroscience | HALO | |
| A First-in-Human Phase 1 Study of a Tumor-Directed RNA-Interference Drug against HIF2a in Patients with Advanced Clear Cell Renal Cell Carcinoma | Brugarolas J, Obara G, Beckermann K E, Rini B, Lam E T, Hamilton J, Schluep T, Yi M, Wong S, Mao Z L, Gamelin E, Tannir N M | 2024 | Clinical Cancer Research | Oncology | ISH | HALO |
| Nivolumab for mismatch-repair-deficient or hypermutated gynecologic cancers: a phase 2 trial with biomarker analyses | Friedman C, Manning-Geist B, Zhou Q, Soumerai T, Holland A, Da Cruz Paula A, Green H, Ozsoy M, Iasonos A, Hollmann T, Leitao Jr. M, Mueller J, Makker V, Tew W, O’Cearbhaill R, Liu Y, Rubinstein M, Troso-Sandoval T, Lichtman S, Schram A, Kyi C, Grisham R, Andrieu P, Wherry E, Aghajanian C, Weigelt B, Hensley M L, Zamarin D | 2024 | Nature Medicine | Immuno-oncology | Spatial Analysis, Highplex FL | HALO |
| Discovery of WRN inhibitor HRO761 with synthetic lethality in MSI cancers | Ferretti S, Hamon J, de Kanter R, Scheufler C, Andraos-Rey R, Barbe S, Bechter E, Blank J, Bordas V, Dammassa E, Decker A, Di Nanni N, Dourdoigne M, Gavioli E, Hattenberger M, Heuser A, Hemmerlin C, Hinrichs J, Kerr G, Laborde L, Jaco I, Jiménez Núñez E, Martus H, Quadt C, Reschke M, Romanet V, Schaeffer F, Schoepfer J, Schrapp M, Strang R, Voshol H, Wartmann M, Welly S, Zécri F, Hofmann F, Möbitz H, Cortés-Cros M | 2024 | Nature | Oncology | Cytonuclear | HALO |
| Alpha-synuclein inclusion responsive microglia are resistant to CSF1R inhibition | Stoll AC, Kemp CJ, Patterson JR, Kubik M, Kuhn N, Benskey M, Duffy MF, Luk KC, Sortwell CE | 2024 | Journal of Neuroinflammation | Neuroscience | Area Quantification | HALO |
| Interferon-gamma signature as prognostic and predictive marker in macroscopic stage III melanoma | Versluis J M, Blankenstein S A, Dimitriadis P, Wilmott J S, Elens R, Blokx W A M, van Houdt W, Menzies A M, Schrage Y M, Wouters M W J M, Sanders J, Broeks A, Scolyer R A, Suijkerbuijk K P M, Long G V, van Akkooi A C J, Blank C U | 2024 | Journal for Immunotherapy of Cancer | Immuno-oncology | Highplex FL | HALO, HALO AI |
| Development of a dual channel detection system for pan-genotypic simultaneous quantification of hepatitis B and delta viruses | Liu Y, Maya S, Carver S, O'Connell AK, Tseng AE, Gertje HP, Seneca K, Nahass RG | 2024 | Emerging Microbes & Infections | Infectious Disease | Registration | HALO |
| Characterisation of premature cell senescence in Alzheimer’s disease using single nuclear transcriptomics | Fancy N, Smith A, Caramello A, Tsartsalis S, Davey K, Muirhead R, McGarry A, Jenkyns M, Schneegans E, Chau V, Thomas M, Boulger S, Cheung T, Adair E, Papageorgopoulou M, Willumsen N, Khozoie C, Gomez-Nicola D, Jackson J S, Matthews P M | 2024 | Acta Neuropathologica | Neuroscience | Multiplex IHC | HALO |
| Meteorin-like protein/METRNL/Interleukin-41 ameliorates atopic dermatitis-like inflammation | Huang D, Liu X, Gao X, Choi C, Giglio G, Farah L, Leung T, Wong K, Kan L, Chong J, Meng Q, Liao J, Cheung P, Wong C | 2024 | Allergy | Immunology | Spatial Analysis, Highplex FL | HALO |
| Diet-induced obesity affects influenza disease severity and transmission dynamics in ferrets | Meliopoulos V, Honce R, Livingston B, Hargest V, Freiden P, Lazure L, Brigleb P H, Karlsson E, Sheppard H, Allen E K, Boyd D, Thomas P G, Schultz-Cherry S | 2024 | Science Advances | Infectious Disease | HALO, HALO AI | |
| Identification of high-performing antibodies for the reliable detection of Tau proteoforms by Western blotting and immunohistochemistry | Ellis M J, Lekka C, Holden K L, Tulmin H, Seedat F, O’Brien D P, Dhayal S, Zeissler M-L, Knudsen J G, Kessler B M, Morgan N G, Todd J A, Richardson S J, Stefana M I | 2024 | Acta Neuropathologica | Neuroscience | Highplex FL, Figure Maker | HALO |
| IL-2-free tumor-infiltrating lymphocyte therapy with PD-1 blockade demonstrates potent efficacy in advanced gynecologic cancer | Guo J, Wang C, Luo N, Wu Y, Huang W, Zhu J, Shi W, Ding J, Ge Y, Liu C, Lu Z, Bast Jr RC, Ai G, Yang W, Wang R, Li C, Chen R, Liu S, Jin H, Zhao B, Cheng Z | 2024 | BMC Medicine | Immuno-oncology | Highplex FL | HALO |
| Preclinical efficacy and pharmacokinetics of an RNA-encoded T cell–engaging bispecific antibody targeting human claudin 6 | Stadler C, Ellinghaus U, Fischer L, Bähr-Mahmud H, Rao M, Lindemann C, Chaturvedi A, Scharf C, Biermann I, Hebich B, Malz A, Beresin G, Falck G, Häcker A, Houben A, Erdeljan M, Wolf K, Kullmann M, Chang P, Türeci Ö, Şahin U | 2024 | Science Translational Medicine | Immuno-oncology | Multiplex IHC | HALO |
| Ehf controls mammary alveolar lineage differentiation and is a putative suppressor of breast tumorigenesis | Nightingale R, Reehorst C, Vukelic N, Papadopoulos N, Liao Y, Guleria S, Bell C, Vaillant F, Paul S, Luk I Y, Dhillon A S, Jenkins L J, Morrow R J, Jackling F C, Chand A L, Chisanga D, Chen Y, Williams D S, Anderson R L, Ellis S, Meikle P J, Shi W, Visvader J E, Pal B, Mariadason J M | 2024 | Developmental Cell | Other | Highplex FL | HALO |
| L-RNA aptamer-based CXCL12 inhibition combined with radiotherapy in newly-diagnosed glioblastoma: dose escalation of the phase I/II GLORIA trial | Giordano F, Layer J, Leonardelli S, Friker L, Turiello R, Corvino D, Zeyen T, Schaub C, Müller W, Sperk E, Schmeel L, Sahm K, Oster C, Kebir S, Hambsch P, Pietsch T, Bisdas S, Platten M, Glas M, Seidel C, Herrlinger U, Hölzel M | 2024 | Nature Communications | Oncology | Highplex FL | HALO, HALO AI |
| FLI1 promotes IFN-γ-induced kynurenine production to impair anti-tumor immunity | Chen E, Wu J, Huang J, Zhu W, Sun H, Wang X, Lin D, Li X, Shi D, Liu Z, Huang J, Chen M, Xie F, Deng W | 2024 | Nature Communications | Immuno-oncology | Multiplex IHC | HALO |
| IL-6 inhibition prevents costimulation blockade-resistant allograft rejection in T cell-depleted recipients by promoting intragraft immune regulation in mice | Muckenhuber M, Mengrelis K, Weijler A, Steiner R, Kainz V, Buresch M, Regele H, Derdak S, Kubetz A, Wekerle T | 2024 | Nature Communications | Immunology | Highplex FL | HALO |
| Obesogenic High-Fat Diet and MYC Cooperate to Promote Lactate Accumulation and Tumor Microenvironment Remodeling in Prostate Cancer | Boufaied N, Chetta P, Hallal T, Cacciatore S, Lalli D, Luthold C, Homsy K, Imada E, Syamala S, Photopoulos C, Di Matteo A, de Polo A, Storaci A, Huang Y, Giunchi F, Sheridan P, Michelotti G, Nguyen Q, Zhao X, Liu Y, Davicioni E, Spratt D, Sabbioneda S, Maga G, Mucci L, Ghigna C, Marchionni L, Butler L, Ellis L, Bordeleau F, Loda M, Vaira V, Labbé D, Zadra G | 2024 | Cancer Research | Oncology | Classifier, Multiplex IHC | HALO |
| The m6A reader HNRNPC promotes glioma progression by enhancing the stability of IRAK1 mRNA through the MAPK pathway | Chen J, Lu T, Wang T, Yan W, Zhong F, Qu X, Gong X, Li J, Tou F, Jiang L, Han X | 2024 | Cell Death & Disease | Oncology | Multiplex IHC | HALO |
| LINC00982-encoded protein PRDM16-DT regulates CHEK2 splicing to suppress colorectal cancer metastasis and chemoresistance | Hu H-F, Han L, Fu J-Y, He X, Tan J-F, Chen Q-P, Han J-R, He Q-Y | 2024 | Theranostics | Oncology | Highplex FL | HALO |
| A small-molecule microtubule-stabilizing agent safely reduces Aβ plaque and tau pathology in transgenic mouse models of Alzheimer’s disease | Yao Y, Muench M, Alle T, Zhang B, Lucero B, Perez-Tremble R, McGrosso D, Newman M, Gonzalez DJ, Lee VMY, Ballatore C, Brunden KR | 2024 | Alzheimer's & Dementia | Neuroscience | Area Quantification | HALO |
| Inhibition of mRNA nuclear export promotes SARS-CoV-2 pathogenesis | Mei M, Cupic A, Miorin L, Ye C, Cagatay T, Zhang K, Patel K, Wilson N, McDonald W, Crossland N, Lo M, Rutkowska M, Aslam S, Mena I, Martinez-Sobrido L, Ren Y, García-Sastre A, Fontoura B | 2024 | Proceedings of the National Academy of Sciences | Infectious Disease | Area Quantification | HALO |
| Spatial distribution of Mycobacterium tuberculosis mRNA and secreted antigens in acid-fast negative human antemortem and resected tissue | Nargan K, Glasgow J, Nadeem S, Naidoo T, Wells G, Hunter R, Hutton A, Lumamba K, Msimang M, Benson P, Steyn A | 2024 | eBioMedicine | Infectious Disease | Area Quantification, ISH | HALO |
| Spatial multi-omics of human skin reveals KRAS and inflammatory responses to spaceflight | Park J, Overbey E, Narayanan S A, Kim J, Tierney B T, Damle N, Najjar D, Ryon K A, Proszynski J, Kleinman A, Hirschberg J W, MacKay M, Afshin E E, Granstein R, Gurvitch J, Hudson B M, Rininger A, Mullane S, Church S E, Meydan C, Church G, Beheshti A, Mateus J, Mason C E | 2024 | Nature Communications | Dermatology | ISH | HALO |
| Unsupervised Segmentation of 3D Microvascular Photoacoustic Images Using Deep Generative Learning | Sweeney PW, Hacker L, Lefebvre TL, Brown L, Gröhl J, Bohndeik SE | 2024 | Advanced Science | Other | Area Quantification | HALO |
| The miR-29 family facilitates the activation of NK-cell immune responses by targeting the B7-H3 immune checkpoint in neuroblastoma | Pathania AS, Chava H, Chaturvedi NK, Chava S, Byrareddy SN, Coulter DW, Challagundla KB | 2024 | Cell Death & Disease | Immuno-oncology | HALO | |
| Adjuvant COX inhibition augments STING signaling and cytolytic T cell infiltration in irradiated 4T1 tumors | Ridnour L, Cheng R, Kedei N, Somasundaram V, Bhattacharyya D, Basudhar D, Wink A, Walke A, Kim C, Heinz W, Edmondson E, Butcher D, Warner A, Dorsey T, Pore M, Kinders R, Lipkowitz S, Bryant R, Rittscher J, Wong S, Hewitt S, Chang J, Shalaby A, Callagy G, Glynn S, Ambs S, Anderson S, McVicar D, Lockett S, Wink D | 2024 | JCI Insight | Immuno-oncology | Classifier, FISH, Spatial Analysis, Highplex FL | HALO |
| Development of NR0B2 as a therapeutic target for the re-education of tumor associated myeloid cells | Vidana Gamage H E, Albright S T, Smith A J, Farmer R, Shahoei S H, Wang Y, Fink E C, Jacquin E, Weisser E, Bautista R O, Henn M A, Schane C P, Nelczyk A T, Ma L, Das Gupta A, Bendre S V, Nguyen T, Tiwari S, Krawczynska N, He S, Nelson E R | 2024 | Cancer Letters | Oncology | ISH, Multiplex IHC | HALO |
| A High Immune-Related Index with the Suppression of cGAS-STING Pathway is a Key Determinant to Herceptin Resistance in HER2+ Breast Cancer | Cai R, Chen Q, Zhao D, Wang Y, Zhou L, Zhang K, Shan J, Li Z, Chen Y, Zhang H, Feng G, Zhu X, Deng R, Tang J | 2024 | International Journal of Biological Sciences | Immuno-oncology | Multiplex IHC, Highplex FL | HALO |
| Development of human pancreatic cancer avatars as a model for dynamic immune landscape profiling and personalized therapy | Hughes D, Evans A, Go S, Eyres M, Pan L, Mukherjee S, Soonawalla Z, Willenbrock F, O'Neill E | 2024 | Science Advances | Immuno-oncology | Classifier, Spatial Analysis, Highplex FL | HALO |
| Single-cell resolution characterization of myeloid-derived cell states with implication in cancer outcome | Rapozo Guimarães G, Resk Maklouf G, Teixeira C, Santos L, Tessarollo N, Toledo N, Serain A, Lanna C, Pretti M, Vieira da Cruz J, Falchetti M, Dimas M, Filgueiras I, Cabral-Marques O, Ramos R, Macedo F, Rodrigues F, Bastos N, Silva J, Rocha E, Chaves C, Melo A, Moraes-Vieira P, Mori M, Boroni M | 2024 | Nature Communications | Immuno-oncology | Multiplex IHC, TMA | HALO |
| SHISA3 Reprograms Tumor-Associated Macrophages Toward an Antitumoral Phenotype and Enhances Cancer Immunotherapy | Zhang S, Yu B, Sheng C, Yao C, Liu Y, Wang J, Zeng Q, Mao Y, Bei J, Zhu B, Chen S | 2024 | Advanced Science | Immuno-oncology | Highplex FL | HALO |
| Pan-cancer single-cell dissection reveals phenotypically distinct B cell subtypes | Yang Y, Chen X, Pan J, Ning H, Zhang Y, Bo Y, Ren X, Li J, Qin S, Wang D, Chen M, Zhang Z | 2024 | Cell | Immuno-oncology | Spatial Analysis, Highplex FL, Registration | HALO |
| Combined inhibition of KRASG12C and mTORC1 kinase is synergistic in non-small cell lung cancer | Kitai H, Choi P H, Yang Y C, Boyer J A, Whaley A, Pancholi P, Thant C, Reiter J, Chen K, Markov V, Taniguchi H, Yamaguchi R, Ebi H, Evans J, Jiang J J, Lee B, Wildes D, Stanchina E, Smith J A M, Singh M, Rosen N | 2024 | Nature Communications | Oncology | Classifier, Area Quantification, Multiplex IHC | HALO |
| Hyperactivation of mTOR/eIF4E Signaling Pathway Promotes the Production of Tryptophan-To-Phenylalanine Substitutants in EBV-Positive Gastric Cancer | Zheng Z, Zhong C, Wei C, Chen X, Chen G, Nie R, Chen Z, Zhang F, Li Y, Zhou Z, Liang Y | 2024 | Advanced Science | Oncology | Highplex FL | HALO |
| TSG-6+ cancer-associated fibroblasts modulate myeloid cell responses and impair anti-tumor response to immune checkpoint therapy in pancreatic cancer | Anandhan S, Herbrich S, Goswami S, Guan B, Chen Y, Macaluso M D, Jindal S, Natarajan S M, Andrewes S W, Xiong L, Nagarajan A, Basu S, Ng Tang D, Liu J, Min J, Maitra A, Sharma P | 2024 | Nature Communications | Immuno-oncology | Spatial Analysis, Highplex FL | HALO |
| Mitochondrial DNA-boosted dendritic cell-based nanovaccination triggers antitumor immunity in lung and pancreatic cancers | Shang L, Jiang X, Zhao X, Huang X, Wang X, Jiang X, Kong X, Yao M, Jiang S, Wong P | 2024 | Cell Reports Medicine | Immuno-oncology | Spatial Analysis, Highplex FL | HALO |
| Human organoids with an autologous tissue-resident immune compartment | Recaldin T, Steinacher L, Gjeta B, Harter M, Adam L, Kromer K, Mendes M, Bellavista M, Nikolaev M, Lazzaroni G, Krese R, Kilik U, Popovic D, Stoll B, Gerard R, Bscheider M, Bickle M, Cabon L, Camp J, Gjorevski N | 2024 | Nature | Immunology | Highplex FL | HALO, HALO AI |
| LIM domain only 7: a novel driver of immune evasion through regulatory T cell differentiation and chemotaxis in pancreatic ductal adenocarcinoma | Dai S, Peng Y, Wang G, Chen C, Chen Q, Yin L, Yan H, Zhang K, Tu M, Lu Z, Wei J, Li Q, Wu J, Jiang K, Zhu Y, Miao Y | 2024 | Cell Death & Differentiation | Immuno-oncology | Spatial Analysis, Highplex FL | HALO |
| Spatial transcriptomic characterization of pathologic niches in IPF | Mayr C H, Santacruz D, Jarosch S, Bleck M, Dalton J, McNabola A, Lempp C, Neubert L, Rath B, Kamp J C, Jonigk D, Kühnel M, Schlüter H, Klimowicz A, Doerr J, Dick A, Ramirez F, Thomas M J | 2024 | Science Advances | Fibrosis | Highplex FL | HALO, HALO Link |
| PD‐L1+ macrophage and tumor cell abundance and proximity to T cells in the pretreatment large B‐cell lymphoma microenvironment impact CD19 CAR‐T cell immunotherapy efficacy | Hirayama A V, Wright J H, Smythe K S, Fiorenza S, Shaw A N, Gauthier J, Maloney D G, Naresh K N, Yeung C C S, Turtle C J | 2024 | Hemasphere | Immuno-oncology | Classifier, Spatial Analysis, Highplex FL | HALO, HALO Link |
| Indoleamine-2,3-dioxygenase inhibition improves immunity and is safe for concurrent use with cART during Mtb/SIV coinfection | Singh B, Sharan R, Ravichandran G, Escobedo R, Shivanna V, Dick E J, Hall-Ursone S, Arora G, Alvarez X, Singh D K, Kaushal D, Mehra S | 2024 | JCI Insight | Infectious Disease | Classifier, Highplex FL | HALO |
| Phosphodiesterase-5 inhibition collaborates with vaccine-based immunotherapy to reprogram myeloid cells in pancreatic ductal adenocarcinoma | Gross N, Zhang Z, Mitchell J T, Charmsaz S, Hernandez A G, Coyne E M, Shin S M, Vargas Carvajal D C, Sidiropoulos D N, Cho Y, Mo G, Yuan X, Cannon C, Suresh Babu J, Lyman M R, Armstrong T, Kagohara L T, Bever K M, Le D T, Jaffee E M, Fertig E J, Ho W J | 2024 | JCI Insight | Immuno-oncology | Area Quantification | HALO |
| Co-targeting SOS1 enhances the antitumor effects of KRASG12C inhibitors by addressing intrinsic and acquired resistance | Thatikonda V, Lyu H, Jurado S, Kostyrko K, Bristow C A, Albrecht C, Alpar D, Arnhof H, Bergner O, Bosch K, Feng N, Gao S, Gerlach D, Gmachl M, Hinkel M, Lieb S, Jeschko A, Machado A A, Madensky T, Marszalek E D, Mahendra M, Melo-Zainzinger G, Molkentine J M, Jaeger P A, Peng D H, Schenk R L, Sorokin A, Strauss S, Trapani F, Kopetz S, Vellano C P, Petronczki M, Kraut N, Heffernan T P, Marszalek J R, Pearson M, Waizenegger I C, Hofmann M H | 2024 | Nature Cancer | Oncology | FISH, Highplex FL | HALO |
| Targeting fatty acid oxidation enhances response to HER2-targeted therapy | Nandi I, Ji L, Smith H W, Avizonis D, Papavasiliou V, Lavoie C, Pacis A, Attalla S, Sanguin-Gendreau V, Muller W J | 2024 | Nature Communications | Oncology, Metabolism | Highplex FL | HALO |
| Primate cerebrospinal fluid CHI3L1 reflects brain TREM2 agonism | Schauer S, Cho C, Novikova G, Roth G, Lee J, Sharma A, Foley A, Ng C, Shen P, Choi M, Ma T, Phu L, Budayeva H, Cheung T, Lalehzadeh G, Imperio J, Ngu H, Etxeberria A, Liang Y, Rezzonico M, Dourado M, Huang K, Lai Z, Hokom M, Pandya N, Newton D, Abdel-Haleem A, Chan P, Lee D, Tassew N, Sangaraju D, O’Connor D, Hötzel I, Stark K, Chou C, Foreman O, Easton A, Wildsmith K, Sperinde G, Rose C, Friedman B, Fuji R, Weimer R, Meilandt W, Sadekar S, Nugent A, Biever A | 2024 | Alzheimer's & Dementia | Neuroscience | HALO, HALO AI | |
| MS-20 enhances the gut microbiota-associated antitumor effects of anti-PD1 antibody | Leea P-J, Hung C-M, Yang A-J, Hou C-Y, Chou H-W, Chang Y-C, Chua W-C, Huang W-Y, Kuo W-C, Yang C-C, Lind K-I, Hung K-H, Change L-C, Lee K-Y, Kuo H-P, Liu K-M, Lai H-C, Kuoi M-L, Chen W-J | 2024 | Gut Microbes | Immuno-oncology | Multiplex IHC | HALO |
| Metabolic imaging across scales reveals distinct prostate cancer phenotypes | Sushentsev N, Hamm G, Flint L, Birtles D, Zakirov A, Richings J, Ling S, Tan J Y, McLean M A, Ayyappan V, Menih I H, Brodie C, Miller J L, Mills I G, Gnanapragasam V J, Warren A Y, Barry S T, Goodwin R J A, Barrett T, Gallagher F A | 2024 | Nature Communications | Oncology | Classifier, Area Quantification, FISH, Membrane, Multiplex IHC | HALO, HALO AI |
| Genetically- and spatially-defined basolateral amygdala neurons control food consumption and social interaction | Lim H, Zhang Y, Peters C, Straub T, Luise Mayer J, Klein R | 2024 | Nature Communications | Neuroscience | FISH | HALO |
| A γδ T cell–IL-3 axis controls allergic responses through sensory neurons | Flayer C H, Kernin I J, Matatia P R, Zeng X, Yarmolinsky D A, Han C, Naik P R, Buttaci D R, Aderhold P A, Camire R B, Zhu X, Tirard A J, McGuire J T, Smith N P, McKimmie C S, McAlpine C S, Swirski F K, Woolf C J, Villani A C, Sokol C L | 2024 | Nature | Neuroscience | Area Quantification, FISH-IF | HALO, HALO AI |
| Non-human primate model of long-COVID identifies immune associates of hyperglycemia | Palmer C S, Perdios C, Abdel-Mohsen M, Mudd J, Datta P K, Maness N J, Lehmicke G, Golden N, Hellmers L, Coyne C, Green K M, Midkiff C, Williams K, Tiburcio R, Fahlberg M, Boykin K, Kenway C, Russell-Lodrigue K, Birnbaum A, Bohm R, Blair R, Dufour J P, Fischer T, Saied A A, Rappaport J | 2024 | Nature Communications | Infectious Disease | ISH, Highplex FL | HALO |
| Chemotherapy drives tertiary lymphoid structures that correlate with ICI-responsive TCF1+CD8+ T cells in metastatic ovarian cancer | Lanickova T, Hensler M, Kasikova L, Vosahlikova S, Angelidou A, Pasulka J, Griebler H, Drozenova J, Mojzisova K, Vankerckhoven A, Laco J, Ryška A, Dundr P, Kocian R, Cibula D, Brtnicky T, Skapa P, Jacob F, Kovar M, Praznovec I, McNeish I A, Halaska M J, Rob L, Coosemans A, Orsulic S, Galluzzi L, Spisek R, Fucikova J | 2024 | Clinical Cancer Research | Immuno-oncology | Classifier, Highplex FL, Registration | HALO |
| Intra-patient spatial comparison of non-metastatic and metastatic lymph nodes reveals the reduction of CD169+ macrophages by metastatic breast cancers | Maeshima Y, Kataoka T. R, Vandenbon A, Hirata M, Takeuchi Y, Suzuki Y, Fukui Y, Kawashima M, Takada M, Ibi Y, Haga H, Morita S, Toi M, Kawaoka S, Kawaguchi K | 2024 | ebiomedicine | Immuno-oncology | Highplex FL | HALO |
| Chlorquinaldol Alleviates Lung Fibrosis in Mice by Inhibiting Fibroblast Activation through Targeting Methionine Synthase Reductase | Yang X, Lin G, Chen Y, Lei X, Ou Y, Yan Y, Wu R, Yang J, Luo Y, Zhao L, Zhang X, Yang Z, Qin A, Sun P, Yu X-Y, Hu W | 2024 | ACS Central Science | Fibrosis | Area Quantification, Highplex FL | HALO |
| PPARα affects hepatic lipid homeostasis by perturbing necroptosis signals in the intestinal epithelium | Na S, Fan Y, Chen H, Li L, Li G, Zhang F, Wang R, Yang Y, Shen Z, Peng Z, Wu Y, Zhu Y, Yang Z, Dong G, Ye Q, Yue J | 2024 | Acta Pharmaceutica Sinica B | Gastroenterology | Multiplex IHC | HALO |
| Citrullination modulation stabilizes HIF-1α to promote tumour progression | Chen R, Lin Z, Shen S, Zhu C, Yan K, Suo C, Liu R, Wei H, Gao L, Fan K, Zhang H, Sun L, Gao P | 2024 | Nature Communications | Oncology | Multiplex IHC | HALO |
| Neoadjuvant immune checkpoint blockade in women with mismatch repair deficient endometrial cancer: a phase I study | Eerkens A L, Brummel K, Vledder A, Paijens S T, Requesens M, Loiero D, van Rooij N, Plat A, Haan F J, Klok P, Yigit R, Roelofsen T, de Lange N M, Klomp R, Church D, ter Elst A, Wardenaar R, Spierings D, Foijer F, Koelzer V H, Bosse T, Bart J, Jalving M, Reyners A K L, de Bruyn M, Nijman H W | 2024 | Nature Communications | Immuno-oncology | Multiplex IHC | HALO, HALO AI |
| YTHDF2 in peritumoral hepatocytes mediates chemotherapy-induced antitumor immune responses through CX3CL1-mediated CD8+ T cell recruitment | Yang Z, Wang X, Fu Y, Wu W, Hu Z, Lin Q, Peng W, Pan Y, Wang J, Chen J, Hu D, Zhou Z, Xu L, Zhang Y, Hou J, Chen M | 2024 | Molecular Cancer | Immuno-oncology | Multiplex IHC | HALO |
| Angiotensin receptor blocker attacks armored and cold tumors and boosts immune checkpoint blockade | Mei J, Chu J, Yang K, Luo Z, Yang J, Xu J, Li Q, Zhang Y, Zhang Q, Wan M, Xue N, Ding J, Zhu Y, Cai Y, Yin Y | 2024 | Journal for Immunotherapy of Cancer | Immuno-oncology | Area Quantification, Multiplex IHC, Highplex FL | HALO |
| Intratumoral CXCL13+ CD160+ CD8+ T cells promote the formation of tertiary lymphoid structures to enhance the efficacy of immunotherapy in advanced gastric cancer | Wang J, Liang Y, Xue A, Xiao J, Zhao X, Cao S, Li P, Dong J, Li Y, Xu Z, Yang L | 2024 | Journal for Immunotherapy of Cancer | Immuno-oncology | Highplex FL | HALO |
| Cellular origin and clonal evolution of human dedifferentiated liposarcoma | Gruel N, Quignot C, Lesage L, El Zein S, Bonvalot S, Tzanis D, Ait Rais K, Quinquis F, Manciot B, Vibert J, El Tannir N, Dahmani A, Derrien H, Decaudin D, Bièche I, Courtois L, Mariani O, Linares L K, Gayte L, Baulande S, Waterfall J J, Delattre O, Pierron G, Watson S | 2024 | Nature Communications | Oncology | Highplex FL | HALO |
| Cancer cell-specific PD-L1 expression is a predictor of poor outcome in patients with locally advanced oral cavity squamous cell carcinoma | Wang M, Qin L, Thia K, Nguyen T, MacDonald S, Belobrov S, Kranz S, Goode D, Trapani J A, Wiesenfeld D, Neeson P J | 2024 | Journal for Immunotherapy of Cancer | Oncology | Highplex FL | HALO |
| MerTK+ macrophages promote melanoma progression and immunotherapy resistance through AhR-ALKAL1 activation | Wu N, Li J, Li L, Yang L, Dong L, Shen C, Sha S, Fu Y, Dong E, Zheng F, Tan Z, Tao J | 2024 | Science Advances | Immuno-oncology | Highplex FL | HALO |
| Neoadjuvant toripalimab plus axitinib for clear cell renal cell carcinoma with inferior vena cava tumor thrombus: NEOTAX, a phase 2 study | Gu L, Peng C, Liang Q, Huang Q, Lv D, Zhao H, Zhang Q, Zhang Y, Zhang P, Li S, Xu J, Chen L, Xie Y, Li J, Guo G, Zhang X, Wang B, Ma X | 2024 | Signal Transduction and Targeted Therapy | Immuno-oncology | Highplex FL | HALO |
| Heteroduplex oligonucleotide technology boosts oligonucleotide splice switching activity of morpholino oligomers in a Duchenne muscular dystrophy mouse model | Hasegawa J, Nagata T, Ihara K, Tanihata J, Ebihara S, Yoshida-Tanaka K, Yanagidaira M, Ohara M, Sasaki A, Nakayama M, Yamamoto S, Ishii T, Iwata-Hara R, Naito M, Miyata K, Sakaue F, Yokota T | 2024 | Nature Communications | Myology | Area Quantification, Muscle Fiber | HALO |
| Single-cell AI-based detection and prognostic and predictive value of DNA mismatch repair deficiency in colorectal cancer | Nowak M, Jabbar F, Rodewald A-K, Gneo L, Tomasevic T, Harkin A, Iveson T, Saunders M, Kerr R, Oein K, Maka N, Hay J, Edwards J, Tomlinson I, Sansom O, Kelly C, Pezzella F, Kerr D, Easton A, Domingo E, Koelzer V. H, Church D | 2024 | Cell Reports Medicine | Oncology | TMA | HALO, HALO AI |
| Neoadjuvant nivolumab or nivolumab plus ipilimumab in early-stage triple-negative breast cancer: a phase 2 adaptive trial | Nederlof I, Isaeva O. I., de Graaf M, Gielen R. C. A. M., Bakker N. A. M., Rolfes A. L., Garner H, Boeckx B, Traets J. J. H., Mandjes I. A. M., de Maaker M, van Brussel T, Chelushkin M, Champanhet E, Lopez-Yurda M, van de Vijver K, van den Berg J. G., Hofland I, Klioueva N, Mann R. M., Loo C. E., van Duijnhoven F. H., Skinner V, Luykx S, Kerver E, Kalashnikova E, van Dongen M. G. J., Sonke G. S., Linn S. C., Blank C. U., de Visser K. E., Salgado R, Wessels L. F. A. W., Drukker C. A., Schumacher T. N., Horlings H. M., Lambrechts D, Kok M | 2024 | Nature Medicine | Immuno-oncology | Multiplex IHC, Spatial Analysis | HALO, HALO AI |
| Amyloid-β (Aβ) immunotherapy induced microhemorrhages are linked to vascular inflammation and cerebrovascular damage in a mouse model of Alzheimer’s disease | Taylor X, Noristani H N, Fitzgerald G J, Oluoch H, Babb N, McGathey T, Carter L, Hole J T, Lacor P N, DeMattos R B, Wang Y | 2024 | Molecular Neurodegeneration | Neuroscience | Area Quantification | HALO |
| Mapping RANKL- and OPG-expressing cells in bone tissue: the bone surface cells as activators of osteoclastogenesis and promoters of the denosumab rebound effect | El-Masri B M, Andreasen C M, Laursen K S, Kofod V B, Dahl X G, Nielsen M H, Thomsen J S, Brüel A, Sørensen M S, Hansen L J, Kim A S, Taylor V E, Massarotti C, McDonald M M, You X, Charles J F, Delaisse J-M, Andersen T L | 2024 | Bone Research | Other | ISH, Spatial Analysis | HALO, HALO AI |
| Large Scale Comparative Analysis of Canine and Human Osteosarcomas Uncovers Conserved Clinically Relevant Tumor Microenvironment Subtypes | Patkar S, Mannheimer J, Harmon S A, Ramirez C J, Mazcko C N, Choyke P L, Brown G T, Turkbey B, LeBlanc A K, Beck J A | 2024 | Clinical Cancer Research | Oncology | HALO, HALO AI | |
| Entamoeba muris mitigates metabolic consequences of high-fat diet in mice | Roy M, Dumay A, Adiba S, Rozes S, Kobayashi S, Paradis V, Postic C, Rainteau D, Ogier-Denis E, Le Gall M, Meinzer U, Viennois E, Casado-Bedmar M, Mosca A, Hugot J-P | 2024 | Gut Microbes | Metabolism | Area Quantification | HALO |
| Stress granules are not present in Kras mutant cancers and do not control tumor growth | Libert M, Quiquempoix S, Fain J S, Ruys S, Haidar M, Wulleman M, Herinckx G, Vertommen D, Bouchart C, Arsenijevic T, Van Laethem J-L, Jacquemin P | 2024 | EMBO reports | Oncology | Area Quantification | HALO |
| DKK1+ tumor cells inhibited the infiltration of CCL19+ fibroblasts and plasma cells contributing to worse immunotherapy response in hepatocellular carcinoma | Fan G, Gao R, Xie T, Li L, Tang L, Han X, Shi Y | 2024 | Cell Death & Disease | Immuno-oncology | HALO Link | |
| Single intravenous administration of oncolytic adenovirus TILT-123 results in systemic tumor transduction and immune response in patients with advanced solid tumors | Jirovec E, Quixabeira D C A, Clubb J H A, Pakola S A, Kudling T, Arias V, Haybout L, Jalkanen K, Alanko T, Monberg T, Khammari A, Dreno B, Svane I M, Block M S, Adamo D A, Mäenpää J, Kistler C, Sorsa S, Hemminki O, Kanerva A, Santos J M, Cervera-Carrascon V, Hemminki A | 2024 | Journal of Experimental & Clinical Cancer Research | Oncology | Multiplex IHC, Highplex FL | HALO |
| MSC–microvesicles protect cartilage from degradation in early rheumatoid arthritis via immunoregulation | Wei S, Cheng RJ, Li S, Lu C, Zhng Q, Wu Q, Zhao X, Tian X, Zeng X, Liu Y | 2024 | Journal of Nanobiotechnology | Immunology | HALO, HALO AI | |
| Onvansertib in Combination With Chemotherapy and Bevacizumab in Second-Line Treatment of KRAS-Mutant Metastatic Colorectal Cancer: A Single-Arm, Phase II Trial | Ahn D H, Ridinger M, Cannon T L, Mendelsohn L, Starr J S, Hubbard J M, Kasi A, Barzi A, Samuëlsz E, Karki A, Subramanian R A, Yemane D, Kim R, Wu C C, Croucher P J P, Smeal T, Kabbinavar F F, Lenz H J | 2024 | Journal of Clinical Oncology | Oncology | Spatial Analysis | HALO |
| Perioperative sintilimab and neoadjuvant anlotinib plus chemotherapy for resectable non-small-cell lung cancer: a multicentre, open-label, single-arm, phase 2 trial (TD-NeoFOUR trial) | Duan H, Shao C, Luo Z, Wang T, Tong L, Liu H, Yao X, Lei J, Zhao J, Gao Y, Jiang T, Yan X | 2024 | Signal Transduction and Targeted Therapy | Immuno-oncology | Area Quantification, Spatial Analysis, Highplex FL | HALO |
| SPI1+CD68+ macrophages as a biomarker for gastric cancer metastasis: a rationale for combined antiangiogenic and immunotherapy strategies | Deng G, Wang P, Su R, Sun X, Wu Z, Huang Z, Gu L, Yu H, Zhao Z, He Y, Huo M, Zhang C, Yin S | 2024 | Journal for Immunotherapy of Cancer | Immuno-oncology | Spatial Analysis, Highplex FL | HALO |
| RIP1 inhibition protects retinal ganglion cells in glaucoma models of ocular injury | Kim BK, Goncharov T, Archaimbault SA, Roudnicky F, Webster JD, Westenskow PD, Vucic D | 2024 | Cell Death & Differentiation | Other | FISH | HALO |
| Systemic longitudinal immune profiling identifies proliferating Treg cells as predictors of immunotherapy benefit: biomarker analysis from the phase 3 CONTINUUM and DIPPER trials | Huang S-W, Jiang W, Xu S, Zhang Y, Du J, Wang Y-Q, Yang K-Y, Zhang N, Liu F, Zou G-R, Jin F, Wu H-J, Zhou Y-Y, Zhu X-D, Chen N-Y, Xu C, Qiao H, Liu N, Sun Y, Ma J, Liang Y-L, Liu X | 2024 | Signal Transduction and Targeted Therapy | Immuno-oncology | Spatial Analysis, Highplex FL | HALO, HALO AI |
| Targeting Unc5b in macrophages drives atherosclerosis regression and pro-resolving immune cell function | Schlegel M, Cyr Y, Newman A A C, Schreyer K, Barcia Durán J G, Sharma M, Bozal F K, Gourvest M, La Forest M, Afonso M S, van Solingen C, Fisher E A, Moore K J | 2024 | Proceedings of the National Academy of Sciences | Immunology | HALO, HALO AI | |
| Diversity of the immune microenvironment and response to checkpoint inhibitor immunotherapy in mucosal melanoma | Vos J L, Traets J J H, Qiao X, Seignette I M, Peters D, Wouters M W J M, Hooijberg E, Broeks A, van der Wal J E, Karakullukcu M B, Klop W M C, Navran A, van Beurden M, Brouwer O R, Morris L G T, van Poelgeest M I E, Kapiteijn E, Haanen J B A G, Blank C U, Zuur C L | 2024 | JCI Insight | Immuno-oncology | Classifier, Spatial Analysis, Highplex FL | HALO |
| JAK-STAT1 as therapeutic target for EGFR deficiency-associated inflammation and scarring alopecia | Strobl K, Klufa J, Jin R, Artner-Gent L, Krauß D, Novoszel P, Strobl J, Stary G, Vujic I, Griss J, Holcmann M, Farlik M, Homey B, Sibilia M, Bauer T | 2024 | EMBO Molecular Medicine | Immunology | Highplex FL | HALO |
| Oncolytic immunotherapy with nivolumab in muscle-invasive bladder cancer: a phase 1b trial | Li R, Villa N Y, Yu X, Johnson J O, Borjas G, Dhillon J, Moran-Segura C M, Kim Y, Francis N, Dorman D, Powers J J, Sexton W J, Spiess P E, Poch M A, Zemp L, Gilbert S M, Zhang J, Pow-Sang J M, Anderson A R A, Li T, Wang X, Grass G D, Burke J M, Dinney C P N, Rodriguez P C, Jain R K, Mulé J J, Conejo-Garcia J R | 2024 | Nature Medicine | Immuno-oncology | Highplex FL | HALO, HALO AI |
| Human ITGAV variants are associated with immune dysregulation, brain abnormalities, and colitis | Ghasempour S, Warner N, Guan R, Rodari M M, Ivanochko D, Hawkins R W, Marwaha A, Nowak J K, Liang Y, Mulder D J, Stallard L, Li M, Yu D D, Pluthero F G, Batura V, Zhao M, Siddiqui I, Upton J E M, Hulst J M, Kahr W H A, Mendoza-Londono R, Charbit-Henrion F, Hoefsloot L H, Khiat A, Moreira D, Trindade E, Espinheira M do Céu, Pais I P, Weerts M J A, Douben H, Kotlarz D, Snapper S B, Klein C, Dowling J J, Julien J P, Joosten M, Cerf-Bensussan N, Freeman S A, Parlato M, van Ham T J, Muise A M | 2024 | Journal of Experimental medicine | Other | Multiplex IHC | HALO |
| The Antipsychotic Drug Aripiprazole Suppresses Colorectal Cancer by Targeting LAMP2a to Induce RNH1/miR-99a/mTOR-Mediated Autophagy and Apoptosis | Hu H-F, Fu J-Y, Han L, Gao G-B, Zhang W-X, Yu S-M, Li N, Li Y-J, Lu Y-F, Ding X-F, Pan Y-L, Wang Y, He Q-Y | 2024 | Advanced Science | Oncology | Area Quantification | HALO |
| Conditional Activation of c-MYC in Distinct Catecholaminergic Cells Drives Development of Neuroblastoma or Somatostatinoma | Wang T, Liu L, Fang J, Jin H, Natarajan S, Sheppard H, Lu M, Turner G, Confer T, Johnson M, Steinberg J, Ha L, Yadak N, Jain R, Picketts D J, Ma X, Murphy A, Davidoff A M, Glazer E S, Easton J, Chen X, Wang R, Yang J | 2024 | Cancer Research | Oncology, Neuroscience | Multiplex IHC | HALO |
| Hepatocellular senescence induces multi-organ senescence and dysfunction via TGFβ | Kiourtis C, Terradas-Terradas M, Gee L M, May S, Georgakopoulou A, Collins A L, O’Sullivan E D, Baird D P, Hassan M, Shaw R, Tan E H, Müller M, Engelmann C, Andreola F, Hsieh Y C, Reed L H, Borthwick L A, Nixon C, Clark W, Hanson P S, Sumpton D, Mackay G, Suzuki T, Najumudeen A K, Inman G J, Campbell A, Barry S T, Quaglia A, Morris C M, LeBeau F E N, Sansom O J, Kirschner K, Jalan R, Oakley F, Bird T G | 2024 | Nature Cell Biology | Other | Area Quantification, Multiplex IHC, Highplex FL | HALO |
| Differences in the pathological, transcriptomic, and prognostic implications of lymphoid structures between primary and metastatic cutaneous melanomas | Karapetyan L, Li A, De Stefano D, Abushukair H M, Al-Bzour A N, Knight A, Layding C, Wang H, Xu J, Yao J, Song X, Joy M, Nguyen J, Moran-Segura C, Bruno S, Sander C, Messina J, Mule J J, Storkus W J, Kirkwood J M | 2024 | Journal for Immunotherapy of Cancer | Oncology | Highplex FL | HALO |
| TET3 regulates terminal cell differentiation at the metabolic level | Mulet I, Grueso-Cortina C, Cortés-Cano M, Gerovska D, Wu G, Iakab S A, Jimenez-Blasco D, Curtabbi A, Hernansanz-Agustín P, Ketchum H, Manjarrés-Raza I, Wunderlich F T, Bolaños J P, Dawlaty M M, Hopf C, Enríquez J A, Araúzo-Bravo M J, Tapia N | 2024 | Nature Communications | Other | FISH | HALO |
| Longitudinal imaging of therapeutic enzyme expression after gene therapy for Fabry disease using positron emission tomography and the radiotracer [18F]AGAL | Kaittanis C, Teceno T, Knight A, Petibon Y, Sandoval P, Cohen L, Ahn S H, Belanger A P, Clark L M, Nguyen Q-D, Ruangsiriluk W, Mukherji S, Constantinescu C C, Amenta A L, Narayanan S, Deshpande M, Islam R, Yuan S, McQuade P, Winkelmann C T, Lohith T G | 2024 | Molecular Therapy | Other | HALO Link | |
| Spatially resolved single-cell atlas unveils a distinct cellular signature of fatal lung COVID-19 in a Malawian population | Nyirenda J, Hardy O M, Da Silva Filho J, Herder V, Attipa C, Ndovi C, Siwombo M, Namalima T R, Suwedi L, Ilia G, Nyasulu W, Ngulube T, Nyirenda D, Mvaya L, Phiri J, Chasweka D, Eneya C, Makwinja C, Phiri C, Ziwoya F, Tembo A, Makwangwala K, Khoswe S, Banda P, Morton B, Hilton O, Lawrence S, Reis M F dos, Melo G C, Lacerda M V G de, Costa F T M, Monteiro W M, Ferreira L C de L, Johnson C, McGuinness D, Jambo K, Haley M, Kumwenda B, Palmarini M, Denno D M, Voskuijl W, Kamiza S B, Barnes K G, Couper K, Marti M, Otto T D, Moxon C A | 2024 | Nature Medicine | Infectious Disease | FISH | HALO, HALO AI |
| Immune microenvironment of Epstein-Barr virus (EBV)-negative compared to EBV-associated gastric cancers: implications for immunotherapy | McMiller TL, Besharati S, Yarchoan M, Zhu Q, Ünsal-Kaçmaz K, Xu K, Lee J, Bhaijee F, Engle LL, Taube JM, Berger AE, Anders RA, Topalian SL | 2024 | Journal for Immunotherapy of Cancer | Immuno-oncology | Multiplex IHC | HALO |
| Cancer cells restrict immunogenicity of retrotransposon expression via distinct mechanisms | Sun S, You E, Hong J, Hoyos D, Priore I, Tsanov K M, Mattagajasingh O, Gioacchino A D, Marhon S A, Chacon-Barahona J, Li H, Jiang H, Hozeifi S, Rosas-Bringas O, Xu K H, Song Y, Lang E R, Rojas A S, Nieman L T, Patel B K, Murali R, Chanda P, Karacay A, Vabret N, De Carvalho D D, Zenklusen D, LaCava J, Lowe S W, Ting D T, Iacobuzio-Donahue C A, Solovyov A, Greenbaum B D | 2024 | Immunity | Immuno-oncology | ISH/FISH | HALO, HALO AI |
| BTK regulates microglial function and neuroinflammation in human stem cell models and mouse models of multiple sclerosis | Gruber R C, Wirak G S, Blazier A S, Lee L, Dufault M R, Hagan N, Chretien N, LaMorte M, Hammond T R, Cheong A, Ryan S K, Macklin A, Zhang M, Pande N, Havari E, Turner T J, Chomyk A, Christie E, Trapp B D, Ofengeim D | 2024 | Nature Communications | Neuroscience | Area Quantification | HALO |
| Inhibition of lung tumorigenesis by transient reprogramming in cancer cells | Pedrosa P, Zhang Z, Nuñez-Quintela V, Macias D, Ge J, Denholm M, Dyas A, Estevez-Souto V, Lado-Fernandez P, Gonzalez P, Gomez M, Martin J E, Da Silva-Alvarez S, Collado M, Muñoz-Espín D | 2024 | Cell Death & Disease | Oncology | Multiplex IHC | HALO |
| Enhanced and sustained biodistribution of HIV-1 neutralizing antibody VRC01LS in human genital and rectal mucosa | Lemos M P, Astronomo R D, Huang Y, Narpala S, Prabhakaran M, Mann P, Paez C A, Lu Y, Mize G J, Glantz H, Westerberg K, Colegrove H, Smythe K S, Lin M, Pierce R H, Hutter J, Frank I, Mascola J R, McDermott A B, Bekker L-G, McElrath M J | 2024 | Nature Communications | Immunology | Area Quantification | HALO |
| Granzyme K+CD8+ T cells interact with fibroblasts to promote neutrophilic inflammation in nasal polyps | Guo C-L, Wang C-S, Wang Z-C, Liu F-F, Liu L, Yang Y, Li X, Guo B, Lu R-Y, Liao B, Liu J-X, Wang H, Song J, Yao Y, Zhu L-P, Yu D, Liu Z | 2024 | Nature Communications | Immunology | Spatial Analysis, Highplex FL | HALO |
| Immune checkpoint landscape of human atherosclerosis and influence of cardiometabolic factors | Barcia Durán J G, Das D, Gildea M, Amadori L, Gourvest M, Kaur R, Eberhardt N, Smyrnis P, Cilhoroz B, Sajja S, Rahman K, Fernandez D M, Faries P, Narula N, Vanguri R, Goldberg I J, Fisher E A, Berger J S, Moore K J, Giannarelli C | 2024 | Nature Cardiovascular Research | Immunology | Highplex FL | HALO, HALO AI |
| SPHK1 promotes HNSCC immune evasion by regulating the MMP1-PD-L1 axis | Fang Q, Chen X, Cao F, Xu P, Zhao Z, Lin R, Wu D, Deng W, Liu X | 2024 | Theranostics | Immunology | Multiplex IHC | HALO |
| Durvalumab and tremelimumab in patients with advanced rare cancer: a multi-centre, non-blinded, open-label phase II basket trial | Gupta A, Tinker A, Jonker D, Jamal R, Hirte H, Winquist E W, Chug Q, Kollmannsberger C, Wong R, Alcindor T, Nielsen T O, Tsao M, Cottrell T R, Provencher D, Hilton J, Krzyżanowska M K, Elser C, Hotte S, Sederias J, Zhang S, Tu W, Dancey J | 2024 | eClinicalMedicine | Immuno-oncology | Multiplex IHC | HALO |
| Cryoablation-induced neutrophil Ca2+ elevation and NET formation exacerbate immune escape in colorectal cancer liver metastasis | Tan H, Jiang Y, Shen L, Nuerhashi G, Wen C, Gu L, Wang Y, Qi H, Cao F, Huang T, Liu Y, Xie W, Deng W, Fan W | 2024 | Journal of Experimental & Clinical Cancer Research | Immuno-oncology | Spatial Analysis, Highplex FL | HALO |
| Castrate-resistant prostate cancer response to taxane is determined by an HNF1-dependent apoptosis resistance circuit | Senatorov I S, Bowman J, Jansson K H, Alilin A N, Capaldo B J, Lake R, Riba M, Abbey Y C, Mcknight C, Zhang X, Raj S, Beshiri M L, Shinn P, Nguyen H, Thomas C J, Corey E, Kelly K | 2024 | Cell Reports Medicine | Oncology | Highplex FL | HALO |
| Lurbinectedin sensitizes PD-L1 blockade therapy by activating STING-IFN signaling in small-cell lung cancer | Chakraborty S, Sen U, Ventura K, Jethalia V, Coleman C, Sridhar S, Banerjee A, Ozakinci H, Mahendravarman Y, Snioch K, Stanchina E, Shields M D, Tomalin L E, Demircioglu D, Boyle T A, Tocheva A, Hasson D, Sen T | 2024 | Cell Reports Medicine | Immuno-oncology | Classifier, Highplex FL | HALO |
| Intestinal mucosal barrier repair and immune regulation with an AI-developed gut-restricted PHD inhibitor | Fu Y, Ding X, Zhang M, Feng C, Yan Z, Wang F, Xu J, Lin X, Ding X, Wang L, Fan Y, Li T, Yin Y, Liang X, Xu C, Chen S, Pulous F E, Gennert D, Pun F W, Kamya P, Ren F, Aliper A, Zhavoronkov A | 2024 | Nature Biotechnology | Gastroenterology | Multiplex IHC | HALO |
| Copper chelation redirects neutrophil function to enhance anti-GD2 antibody therapy in neuroblastoma | Jourdin R C, Salerno A, Shai-Hee T, Murray J E, Castrogiovanni G, McHenry C, Jue T R, Pham V, Bell J L, Poursani E, Valli E, Cazzoli R, Damstra N, Nelson D J, Stevens K L P, Chee J, Slapetova I, Kasherman M, Whan R, Lin F, Cochran B J, Tedla N, Colakoglu Veli F, Yuksel A, Vittorio O | 2024 | Nature Communications | Immuno-oncology | Highplex FL | HALO, HALO AI |
| Dementia with lewy bodies patients with high tau levels display unique proteome profiles | Greally S, Kumar M, Schlaffner C, van der Heijden H, Lawton ES, Biswas D, Berretta S, Steen H, Steen JA | 2024 | Molecular Neurodegeneration | Neuroscience | Area Quantification, Multiplex IHC | HALO, HALO AI |
| Neoadjuvant atezolizumab + chemotherapy for resectable NSCLC: 3-year clinical update of phase II clinical trial results and translational findings | Henick B S, Koch P D, Gainor J F, Awad M M, Chiuzan C, Izard S, Georgis Y, Mallick S, Garofano R F, Wong C V, Saqi A, Grindheim J, Schulze K, Sonett J R, Rizvi N A, Izar B, Taylor A M, Shu C A | 2024 | Journal for Immunotherapy of Cancer | Immuno-oncology | Highplex FL | HALO, HALO AI |
| Comprehensive analysis of heterogeneity and cell-cell interactions in Crohn’s disease reveals novel location-specific insights | Feng J, He LN, Yao R, Qiao Y, Yang T, Cui Z, Meng X, Tong J, Jia K, Zuo Z, Shen J | 2024 | Journal of Advanced Research | Immunology | Spatial Analysis, Highplex FL | HALO |
| TFEB triggers a matrix degradation and invasion program in triple-negative breast cancer cells upon mTORC1 repression | Remy D, Antoine-Bally S, de Toqueville S, Jolly C, Macé A-S, Champenois G, Nemati F, Brito I, Raynal V, Priya A, Berlioz A, Dahmani A, Nicolas A, Meseure D, Marangoni E, Chavrier P | 2024 | Developmental Cell | Oncology | Multiplex IHC | HALO, HALO AI |
| Single-cell and spatial transcriptomic analyses reveal heterogeneity characteristics and specific cell subtype regulators in growth hormone-secreting pituitary adenomas | Zhang Y, Wang L, Yi X, Ma X, Wu H, Zhang M, Yang Z, Ma L, Mi Z, Zhi W, Fu C, Liu P, Yang Z | 2024 | International Journal of Surgery | Oncology | Area Quantification | HALO |
| Cancer-specific innate and adaptive immune rewiring drives resistance to PD-1 blockade in classic Hodgkin lymphoma | Paczkowska J, Tang M, Wright K T, Song L, Luu K, Shanmugam V, Welsh E L, Weirather J L, Besson N, Olszewski H, Porter B A, Pfaff K L, Redd R A, Cader F Z, Mandato E, Ouyang J, Calabretta E, Bai G, Lawton L N, Armand P, Rodig S J, Liu X S, Shipp M A | 2024 | Nature Communications | Immuno-oncology | FISH | HALO, HALO AI |
| Tumor-selective activity of RAS-GTP inhibition in pancreatic cancer | Wasko U N, Jiang J, Dalton T C, Curiel-Garcia A, Edwards A C, Wang Y, Lee B, Orlen M, Tian S, Stalnecker C A, Drizyte-Miller K, Menard M, Dilly J, Sastra S A, Palermo C F, Hasselluhn M C, Decker-Farrell A R, Chang S, Jiang L, Wei X, Yang Y C, Helland C, Courtney H, Gindin Y, Muonio K, Zhao R, Kemp S B, Clendenin C, Sor R, Vostrejs W P, Hibshman P S, Amparo A M, Hennessey C, Rees M G, Ronan M M, Roth J A, Brodbeck J, Tomassoni L, Bakir B, Socci N D, Herring L E, Barker N K, Wang J, Cleary J M, Wolpin B M, Chabot J A, Kluger M D, Manji G A, Tsai K Y, Sekulic M, Lagana S M, Califano A, Quintana E, Wang Z, Smith J A M, Holderfield M, Wildes D, Lowe S W, Badgley M A, Aguirre A J, Vonderheide R H, Stanger B Z, Baslan T, Der C J, Singh M, Olive K P | 2024 | Nature | Oncology | Multiplex IHC | HALO |
| Tumor resistance to anti-mesothelin CAR-T cells caused by binding to shed mesothelin is overcome by targeting a juxtamembrane epitope | Liu X.F, Onda M, Schlomer J, Bassel L, Kozlov S, Tai C.H, Zhou Q, Liu W, Tsao H.E, Hassan R, Ho M, Pastan I | 2024 | Proceedings of the National Academy of Sciences | Immuno-oncology | Multiplex IHC | HALO |
| T helper 2 cell–directed immunotherapy eliminates precancerous skin lesions | Oka T, Smith S, Son H, Lee T, Oliver-Garcia V, Mortaja M, Trerice K, Isakoff L, Conrad D, Azin M, Raval N, Tabacchi M, Emdad L, Das S, Fisher P, Cornelius L, Demehri S | 2025 | The Journal of Clinical Investigation | Immuno-oncology | Highplex FL | HALO |
| Hypoxia promotes tumor immune evasion by suppressing MHC-I expression and antigen presentation | Estephan H, Tailor A, Parker R, Kreamer M, Papandreou I, Campo L, Easton A, Moon EJ, Denko NC, Ternette N, Hammond EM, Giaccia AJ | 2025 | The EMBO Journal | Immuno-oncology | Classifier, Area Quantification, Spatial Analysis, Highplex FL | HALO |
| PlexinD1 is a driver and a therapeutic target in advanced prostate cancer | Wei J, Wang J, Guan W, Li J, Pu T, Corey E, Lin TP, Gao AC, Wu BJ | 2025 | EMBO Molecular Medicine | Oncology | Highplex FL | HALO |
| Selpercatinib mitigates cancer cachexia independent of anti-tumor activity in the HT1080 tumor model | Skatri U, Gouda MA, Pandey S, Chauhan NK, Shen T, Hu X, Li M, Huang S, Subbiah V, Wu J | 2025 | Cancer Letters | Oncology | Muscle Fiber | HALO |
| Disruption of tumor-intrinsic PGAM5 increases anti-PD-1 efficacy through the CCL2 signaling pathway | Wei X, Wang H, Liu H, Wang J, Zhou P, Li X, He Y, Li Y, Han D, Mei T, Wang Y, Li Z, Ning J, Xu Z, Wang A, Li Y, Cheng J, Qian D | 2025 | Journal for Immunotherapy of Cancer | Immuno-oncology | Area Quantification | HALO |
| Tracking non-genetic evolution from primary to metastatic ccRCC: TRACERx Renal | Fernández-Sanromán Á, Fendler A, Tan B J.Y., Cattin A-L, Spencer C, Thompson R, Au L, Lobon I, Pallikonda H A, Martin A, Byrne F, Franz A, Mikolajczak A, Rahman H, Tippu Z, Shepherd S T.C., Feng H, Deng D, Rowan A, Pickering L, Furness A J S, Young K, Nicol D, Rudman S M, O’Brien T, Edmonds K, Chandra A, Hazell S, Litchfield K, Kassiotis G, Larkin J, Turajlic S | 2025 | Cancer Discovery | Oncology | Highplex FL | HALO, HALO AI |
| CD4+ T helper 2 cell–macrophage crosstalk induces IL-24–mediated breast cancer suppression | Wang B, Xia Y, Zhou C, Zeng Y, Son HG, Demehri S | 2025 | JCI Insight | Immuno-oncology | Highplex FL | HALO |
| Phase 1 Trial of TTI-101, a First-in-Class Oral Inhibitor of STAT3 in Patients with Advanced Solid Tumors | Tsimberidou A M, Vining D J, Arora S P, de Achaval S, Larson J, Kauh J, Cartwright C, Avritscher R, Alibhai I, Tweardy D J, Kaseb A O | 2025 | Clinical Cancer Research | Oncology | Highplex FL | HALO |
| Reduced circulating sphingolipids and CERS2 activity are linked to T2D risk and impaired insulin secretion | Khan S R, Ye W W, Van J A D, Singh I, Rabiee Y, Rodricks K L, Zhang X, Nicholson R J, Razani B, Summers S A, Futerman A H, Gunderson E P, Wheeler M B | 2025 | Science Advances | Metabolism | Area Quantification | HALO |
| Clonally expanded, targetable, natural killer-like NKG7 T cells seed the aged spinal cord to disrupt myeloid-dependent wound healing | Kong G, Song Y, Yan Y, Calderazzo S M, Saddala M S, Rivera F D L, Cherry J D, Eckman N, Appel E A, Velenosi A, Swarup V, Kawaguchi R, Ng S S, Kwon B K, Gate D, Engwerda C R, Zhou L, Di Giovanni S | 2025 | Neuron | Neuroscience | Highplex FL | HALO |
| Chimeric antigen receptor macrophages (CAR-M) sensitize HER2+ solid tumors to PD1 blockade in pre-clinical models | Pierini S, Gabbasov R, Oliveira-Nunes M C, Qureshi R, Worth A, Huang S, Nagar K, Griffin C, Lian L, Yashiro-Ohtani Y, Ross K, Sloas C, Ball M, Schott B, Sonawane P, Cornell L, Blumenthal D, Chhum S, Minutolo N, Ciccaglione K, Shaw L, Zentner I, Levitsky H, Shestova O, Gill S, Varghese B, Cushing D, DeLong S C, Abramson S, Condamine T, Klichinsky M | 2025 | Nature Communications | Immuno-oncology | ISH, Multiplex IHC | HALO |
| Satellite microglia: marker of traumatic brain injury and regulator of neuronal excitability | Feichtenbiner A B, Sytsma K, O’Boyle R P, Mittenzwei R, Maioli H, Scherpelz K P, Child D D, Li N, Ariza Torres J, Keene L, Kirkland A, Howard K, Latimer C, Keene C D, Ransom C, Nolan A L | 2025 | Journal of Neuroinflammation | Neuroscience | Area Quantification | HALO |
| Efficacy and tolerability of neoadjuvant therapy with Talimogene laherparepvec in cutaneous basal cell carcinoma: a phase II trial (NeoBCC trial) | Ressler J M, Plaschka M, Silmbrod R, Bachmayr V, Shaw L E, Silly T, Zila N, Stepan A, Kusienicka A, Tschandl P, Tittes J, Roka F, Haslik W, Petzelbauer P, Koenig F, Kunstfeld R, Farlik M, Halbritter F, Weninger W, Hoeller C | 2025 | Nature Cancer | Oncology | Classifier, Spatial Analysis, Highplex FL | HALO |
| CD36 enrichment in HER2-positive mesenchymal stem cells drives therapy refractoriness in breast cancer | Castagnoli L, Franceschini A, Cancila V, Dugo M, Bigliardi M, Chiodoni C, Toneguzzo P, Regondi V, Corsetto P A, Pietrantonio F, Mazzucchelli S, Corsi F, Belfiore A, Vingiani A, Pruneri G, Ligorio F, Colombo M P, Tagliabue E, Tripodo C, Vernieri C, Triulzi T, Pupa S M | 2025 | Journal of Experimental & Clinical Cancer Research | Oncology | Multiplex IHC, Highplex FL | HALO |
| Cross-species comparisons between pigs and mice reveal conserved sex-specific intraspinal inflammatory responses after spinal cord injury | Kumari R, Hammers G V, Hammons R H, Stewart A N, MacLean S M, Niedzielko T, Schneider L E, Floyd C L, Gensel J C | 2025 | Journal of Neuroinflammation | Neuroscience | Area Quantification, Multiplex IHC | HALO |
| Systemic IFN-I combined with topical TLR7/8 agonists promotes distant tumor suppression by c-Jun-dependent IL-12 expression in dendritic cells | Sanlorenzo M, Novoszel P, Vujic I, Gastaldi T, Hammer M, Fari O, De Sa Fernandes C, Landau A D, Göcen-Oguz B V, Holcmann M, Monshi B, Rappersberger K, Csiszar A, Sibilia M | 2025 | Nature Cancer | Immuno-oncology | Highplex FL | HALO |
| Single-cell transcriptomics identify a novel macrophage population associated with bone invasion in pituitary neuroendocrine tumors | Wu X, Han X, Zhu H, Li M, Gong L, Jing S, Xie W, Liu Z, Li C, Zhang Y | 2025 | Journal of Experimental & Clinical Cancer Research | Immuno-oncology | Highplex FL | HALO |
| Stroma-derived Dickkopf-1 contributes to the suppression of NK cell cytotoxicity in breast cancer | Lee S, Ricci B, Tran J, Eul E, Ye J, Ren Q, Clever D, Wang J, Wong P, Haas M S, Stewart S A, Ma C X, Fehniger T A, Faccio R | 2025 | Nature Communications | Immuno-oncology | Multiplex IHC | HALO |
| Large-scale transcript variants dictate neoepitopes for cancer immunotherapy | Ji S, Wang F, Wu Y, Hu H, Xing Z, Zhu J, Xu S, Han T, Liu G, Wu Z, Fei C, Kong L, Chen J, Ding Z, Huang Z, Zhang J | 2025 | Science Advances | Immuno-oncology | Highplex FL | HALO |
| A multistage drug delivery approach for colorectal primary tumors and lymph node metastases | Yuan Y, Lin Q, Feng HY, Zhang Y, Lai X, Zhu MH, Wang J, Shi J, Huang Y, Zhang L, Lu Q, Yuan Z, Lovell JF, Chen HZ, Sun P, Fang C | 2025 | Nature Communications | Oncology | Classifier, Area Quantification, Spatial Analysis | HALO |
| Endothelial cell pY397-FAK expression predicts risk of breast cancer recurrences after radiotherapy in SweBCG91-RT cohort | Drake R J, Landén A H, Holmberg E, Stenmark Tullberg A, Killander F, Niméus E, Jordan A, McGuinness J, Karlsson P, Hodivala-Dilke K | 2025 | Clinical Cancer Research | Oncology | Classifier, Area Quantification | HALO |
| Distinct immune cell infiltration patterns in pancreatic ductal adenocarcinoma (PDAC) exhibit divergent immune cell selection and immunosuppressive mechanisms | Sivakumar S, Jainarayanan A, Arbe-Barnes E, Sharma P K, Leathlobhair M N, Amin S, Reiss D J, Heij L, Hegde S, Magen A, Tucci F, Sun B, Wu S, Anand N M, Slawinski H, Revale S, Nassiri I, Webber J, Hoeltzel G D, Frampton A E, Wiltberger G, Neumann U, Charlton P, Spiers L, Elliott T, Wang M, Couto S, Lila T, Sivakumar P V, Ratushny A V, Middleton M R, Peppa D, Fairfax B, Merad M, Dustin M L, Abu-Shah E, Bashford-Rogers R | 2025 | Nature Communications | Immuno-oncology | Classifier, Multiplex IHC, Registration | HALO |
| Nanrilkefusp alfa (SOT101), an IL-15 receptor βγ superagonist, as a single agent or with anti-PD-1 in patients with advanced cancers | Champiat S, Garralda E, Galvao V, Cassier P A, Gomez-Roca C, Korakis I, Grell P, Naing A, LoRusso P, Mikyskova R, Podzimkova N, Reinis M, Ouali K, Schoenenberger A, Kiemle-Kallee J, Tillmanns S, Sachse R, Moebius U, Spisek R, Bechard D, Jelinkova L P, Adkins I, Marabelle A | 2025 | Cell Reports Medicine | Immuno-oncology | Spatial Analysis, Highplex FL, Registration | HALO |
| A window-of-opportunity trial reveals mechanisms of response and resistance to navtemadlin in patients with recurrent glioblastoma | Rendo V, Lee E Q, Bossi C, Khuu N, Rudek M A, Pal S, Azazmeh N, Rashid R, Lin J R, Cusick M, Reynolds A R N, Fassinou A C R, Ayoub G, Malinowski S, Lapinskas E, Pisano W, Jeang J, Stopka S A, Regan M S, Spetz J, Desai A, Lieberman F, Palanichamy K, Fisher J D, Pelton K, Huang R Y, Sarosiek K A, Nabors L B, Holdhoff M, Danda N, Strowd R, Desideri S, Walbert T, Ye X, Chakravarti A, Sorger P K, Santagata S, Agar N Y R, Grossman S A, Alexander B M, Wen P Y, Ligon K L, Beroukhim R | 2025 | Science Translational Medicine | Oncology | Multiplex IHC | HALO, HALO AI |
| Neoadjuvant triplet immune checkpoint blockade in newly diagnosed glioblastoma | Long G V, Shklovskaya E, Satgunaseelan L, Mao Y, Silva I P da, Perry K A, Diefenbach R J, Gide T N, Shivalingam B, Buckland M E, Gonzalez M, Caixeiro N, Vergara I A, Bai X, Rawson R V, Hsiao E, Palendira U, Phan T G, Menzies A M, Carlino M S, Quek C, Grimmond S M, Vissers J H A, Yeo D, Rasko J E J, Khasraw M, Neyns B, Reardon D A, Ashley D M, Wheeler H, Back M, Scolyer R A, Drummond J, Wilmott J S, Rizos H | 2025 | Nature Medicine | Immuno-oncology | Highplex FL | HALO |
| Dietary Oxidized Lipids in Redox Biology: Oxidized Olive Oil Disrupts Lipid Metabolism and Induces Intestinal and Hepatic Inflammation in C57BL/6J Mice | Bao Y, Osowiecka M, Ott C, Tziraki V, Meusburger L, Blaßnig C, Krivda D, Pjevac P, Silva J, Strauss M, Steffen C, Heck V, Aygün S, Duszka K, Doppelmayer K, Grune T, Pignitter M | 2025 | Redox Biology | Metabolism | Classifier, Area Quantification | HALO |
| NETs-CD44-IL-17A Feedback Loop Drives Th17-Mediated Inflammation in Behçet’s Uveitis | Wu Y, Ning K, Huang Z, Chen B, Chen J, Wen Y, Bu J, Hong H, Chen Q, Zhang Z, Jia R, Su W | 2025 | Advanced Science | Immunology | Highplex FL | HALO |
| Prevention of tuberculosis in cynomolgus macaques by an attenuated Mycobacterium tuberculosis vaccine candidate | Singh D K, Ahmed M, Akter S, Shivanna V, Bucşan A N, Mishra A, Golden N A, Didier P J, Doyle L A, Hall-Ursone S, Roy C J, Arora G, Dick E J, Jagannath C, Mehra S, Khader S A, Kaushal D | 2025 | Nature Communications | Infectious Disease | Area Quantification, Multiplex IHC | HALO |
| Neighborhood Environment, DNA Methylation, and Presence of Crown-Like Structures of the Breast | Harris A. R, Hughes J. D, Lawrence W. R, Lenz P, Franklin J, Bhawsar P. M. S, Dorsey T. H, Rossi E. L, Pichardo C. M, Pichardo M. S, White A. J, Ramin C, Duggan M. A, Abubakar M, Rozeboom A. M, Almeida J. S, Gierach G. L, Ambs S, Jenkins B. D | 2025 | JAMA Network Open | Oncology | HALO Link | |
| Hybrid EMT Phenotype and Cell Membrane Tension Promote Colorectal Cancer Resistance to Ferroptosis | Wei X, Ge Y, Zheng Y, Zhao S, Zhou Y, Chang Y, Wang N, Wang X, Zhang J, Zhang X, Hu L, Tan Y, Jia Q | 2025 | Advanced Science | Oncology | Area Quantification | HALO |
| Atezolizumab following definitive chemoradiotherapy in patients with unresectable locally advanced esophageal squamous cell carcinoma – a multicenter phase 2 trial (EPOC1802) | Bando H, Kumagai S, Kotani D, Mishima S, Irie T, Itahashi K, Tanaka Y, Habu T, Fukaya S, Kondo M, Tsushima T, Hara H, Kadowaki S, Kato K, Chin K, Yamaguchi K, Kageyama S, Hojo H, Nakamura M, Tachibana H, Wakabayashi M, Fukui M, Fuse N, Koyama S, Mano H, Nishikawa H, Shitara K, Yoshino T, Kojima T | 2025 | Nature Cancer | Immuno-oncology | Highplex FL | HALO |
| Human-correlated genetic models identify precision therapy for liver cancer | Müller M, May S, Hall H, Kendall T J, McGarry L, Blukacz L, Nuciforo S, Georgakopoulou A, Jamieson T, Phinichkusolchit N, Dhayade S, Suzuki T, Huguet-Pradell J, Powley I R, Officer-Jones L, Pennie R L, Esteban-Fabró R, Gris-Oliver A, Pinyol R, Skalka G L, Leslie J, Hoare M, Sprangers J, Malviya G, Mackintosh A, Johnson E, McCain M, Halpin J, Kiourtis C, Nixon C, Clark G, Clark W, Shaw R, Hedley A, Drake T M, Tan E H, Neilson M, Murphy D J, Lewis D Y, Reeves H L, Le Quesne J, Mann D A, Carlin L M, Blyth K, Llovet J M, Heim M H, Sansom O J, Miller C J, Bird T G | 2025 | Nature | Oncology | Area Quantification, Multiplex IHC | HALO |
| Monocyte-lineage tumor infiltration predicts immunoradiotherapy response in advanced pretreated soft-tissue sarcoma: phase 2 trial results | Levy A, Morel D, Texier M, Rodriguez-Ruiz M E, Bouarroudj L, Bouquet F, Bustillos A, Quevrin C, Clémenson C, Mondini M, Meziani L, Sun R, Zaghdoud N, Tselikas L, Assi T, Faron M, Honoré C, Ngo C, Verret B, Le Péchoux C, Le Cesne A, Ginhoux F, Massard C, Bahleda R, Deutsch E | 2025 | Signal Transduction and Targeted Therapy | Immuno-oncology | ISH | HALO |
| Tebentafusp, a T cell engager, promotes macrophage reprogramming and in combination with IL-2 overcomes macrophage immunosuppression in cancer | Güç E, Treveil A, Leach E, Broomfield A, Camera A, Clubley J, Nieto Garcia P, Kazachenka A, Khanolkar R, del Carpio L, Heyn H, Hassel J C, Sacco J J, Stanhope S, Collins L, Piulats J M, Ranade K, Benlahrech A | 2025 | Nature Communications | Immuno-oncology | Multiplex IHC | HALO |
| Involvement of lncRNA MIR205HG in idiopathic pulmonary fibrosis and IL-33 regulation via Alu elements | Takashima T, Zeng C, Murakami E, Fujiwara N, Kohara M, Nagata H, Feng Z, Sugai A, Harada Y, Ichijo R, Okuzaki D, Nojima S, Matsui T, Shintani Y, Kawai G, Hamada M, Hirose T, Nakatani K, Morii E | 2025 | JCI Insight | Fibrosis | ISH, Multiplex IHC | HALO |
| Potential pulmonary toxicity risks of metal products from hip implants: Using A549 lung cell and animal model | Konety R, Kanniyappan H, Walkay T, Jacob A, Barba M, Deaton R, Mathew MT | 2025 | Chemical Engineering Journal | Other | Multiplex IHC | HALO |
| Targeting Acetyl-CoA Carboxylase Suppresses De Novo Lipogenesis and Tumor Cell Growth in Multiple Myeloma | Morelli E, Ribeiro C F, Rodrigues S D, Gao C, Socciarelli F, Maisano D, Favasuli V, Liu N, Todoerti K, Chakraborty C, Yao Y, Fulciniti M, Samur M, Aktas-Samur A, Amodio N, Turi M, Barello F, Penailillo J, Giallongo C, Romano A, Gulla A, Anderson K C, Inghirami G, Munshi N C, Loda M | 2025 | Clinical Cancer Research | Oncology | Cytonuclear | HALO |
| A positron emission tomography tracer for the imaging of oxidative stress in the central nervous system | Wilde J H, Sun Y-Y, Simpson S R, Hill E R, Fu Z, Bian E J, Kinkaid M M, Villanueva P, Weybright A F, Terrell W R, Qureshi Z, Perera S S, Sheppard H S, Stone J R, Kundu B K, Kuan C-Y, Neumann K D | 2025 | Nature Biomedical Engineering | Neuroscience | Multiplex IHC | HALO |
| Neoleukin-2/15-armored CAR-NK cells sustain superior therapeutic efficacy in solid tumors via c-Myc/NRF1 activation | Luo J, Guo M, Huang M, Liu Y, Qian Y, Liu Q, Cao X | 2025 | Signal Transduction and Targeted Therapy | Immuno-oncology | Highplex FL | HALO |
| PARP inhibitor radiosensitization enhances anti-PD-L1 immunotherapy through stabilizing chemokine mRNA in small cell lung cancer | Ran X, Wu X, Vidhyasagar V, Song L, Zhang X, Ladak R, Teng M, Ba-alawi W, Philip V, He H, Sonenberg N, Lok B H | 2025 | Nature Communications | Immuno-oncology | Multiplex IHC | HALO |
| A first-in-human study of quantitative ultrasound to assess transplant kidney fibrosis | Hysi E, Baek J, Koven A, He X, Ulloa Severino L, Wu Y, Kek K, Huang S, Krizova A, Farcas M, Ordon M, Fok K-H, Stewart R, Pace K T, Kolios M C, Parker K J, Yuen D A | 2025 | Nature Medicine | Fibrosis | Area Quantification | HALO |
| SPARROW reveals microenvironment-zone-specific cell states in healthy and diseased tissues | Zhao PA, Li R, Adewunmi T, Garber J, Gustafson C, Kim J, Malone J, Savage A, Skene P, Li XJ | 2025 | Cell Systems | Other | Highplex FL | HALO, HALO AI |
| HER2-targeted star polymer conjugates for improved tumor distribution and efficacy | Sonzini S, England R M, Kapustin A N, Moss J I, Sutton D, Smith A, Sharma S, Siouve E, Mazza M, Ravn P, Puri S, Ashford M | 2025 | Journal of Controlled Release | Oncology | Area Quantification | HALO, HALO AI |
| Diffusion and contrast-enhancement MRI phenotypes associated with immune checkpoint inhibitor exposure and with immune cell infiltration in brain metastases | Sanvito F, Nocera G, Wang Z, Shiuan E, Sun L, Oshima S, Kim A, Kryukov I, Shao G, Cho N S, Salamon N, Ellingson B M, Prins R, Kim W, Yao J | 2025 | Neuro-Oncology | Immuno-oncology | Highplex FL | HALO |
| Single-cell transcriptomic and functional studies identify glial state changes and a role for inflammatory RIPK1 signaling in ALS pathogenesis | Zelic M, Blazier A, Pontarelli F, LaMorte M, Huang J, Tasdemir-Yilmaz O E, Ren Y, Ryan S K, Shapiro C, Morel C, Krishnaswami P, Levit M, Sood D, Chen Y, Gans J, Tang X, Hsiao-Nakamoto J, Huang F, Zhang B, Berry J D, Bangari D S, Gaglia G, Ofengeim D, Hammond T R | 2025 | Immunity | Neuroscience | Area Quantification | HALO |
| Soluble CD27 differentially predicts resistance to anti-PD1 alone but not with anti-CTLA-4 in melanoma | Sam I, Benhamouda N, Biard L, Da Meda L, Desseaux K, Baroudjan B, Nakouri I, Renaud M, Sadoux A, Alkatrib M, Deleuze J-F, Battistella M, Shen Y, Resche-Rigon M, Mourah S, Lebbe C, Tartour E | 2025 | EMBO Molecular Medicine | Immuno-oncology | Spatial Analysis, Highplex FL | HALO |
| A single-cell atlas reveals immune heterogeneity in anti-PD-1-treated non-small cell lung cancer | Liu Z, Yang Z, Wu J, Zhang W, Sun Y, Zhang C, Bai G, Yang L, Fan H, Chen Y, Zhang L, Jiang B, Liu X, Ma X, Tang W, Liu C, Qu Y, Yan L, Zhao D, Wu Y, He S, Xu L, Peng L, Chen X, Zhou B, Zhao L, Zhao Z, Tan F, Zhang W, Yi D, Li X, Gao Q, Zhang G, Wang Y, Yang M, Fu H, Guo Y, Hu X, Cai Q, Qi L, Bo Y, Peng H, She Y, Zou C, Zhu L, Cheng S, Zhang Y, Zhong W, Chen C, Gao S, Zhang Z | 2025 | Cell | Immuno-oncology | Highplex FL | HALO |
| Tumor cells that resist neutrophil anticancer cytotoxicity acquire a prometastatic and innate immune escape phenotype | Szlachetko JA, Hofmann-Vega F, Budeus B, Schröder L-J, Dumitru C A, Schmidt M, Deuss E, Vollmer S, Hanschmann E-M, Busch M, Kehrmann J, Lang S, Dünker N, Hussain T, Brandau S | 2025 | Cellular and Molecular Immunology | Immuno-oncology | Spatial Analysis, Highplex FL | HALO |
| A spatially resolved transcriptome landscape during thyroid cancer progression | Liao T, Zeng Y, Xu W, Shi X, Shen C, Du Y, Zhang M, Zhang Y, Li L, Ding P, Hu W, Huang Z, Fung M H M, Ji Q, Wang Y, Li S, Wei W | 2025 | Cell Reports Medicine | Oncology | Highplex FL | HALO |
| TIMEPOINT, a phase 1 study combining MTL-CEBPA with pembrolizumab, supports the immunomodulatory effect of MTL-CEBPA in solid tumors | Plummer R, Sodergren M H, Hodgson R, Ryan B M, Raulf N, Nicholls J P, Reebye V, Voutila J, Sinigaglia L, Meyer T, Pinato D J, Sarker D, Basu B, Blagden S, Cook N, Evans T R J, Yachnin J, Chee C E, Li D, El-Khoueiry A, Diab M, Huang K W, Pai M, Spalding D, Talbot T, Noel M S, Keenan B, Mahalingam D, Song M S, Grosso M, Arnaud D, Auguste A, Zacharoulis D, Storkholm J, McNeish I, Habib R, Rossi J J, Habib N A | 2025 | Cell Reports Medicine | Immuno-oncology | Highplex FL | HALO |
| Three-Dimensional Vector MR Elastography for Evaluating Tissue Mechanical Heterogeneity to Assess Liver Disease Progression | Wu H, Zhu Z, Li J, Qiu C, Xu P, Glaser K J, Murphy M C, Venkatesh S K, Yaqoob U, Graham R, Mounajjed T, Manduca A, Winkelmann C T, Yashiro H, Manohar R, Allen A M, Shah V H, Ehman R L, Yin M | 2025 | Radiology | Gastroenterology | Area Quantification | HALO |
| A human model to deconvolve genotype-phenotype causations in lung squamous cell carcinoma | Ogden J, Sellers R, Sahoo S, Oojageer A, Chaturvedi A, Dive C, Lopez-Garcia C | 2025 | Nature Communications | Oncology | Multiplex IHC | HALO |
| Benchmark of cellular deconvolution methods using a multi-assay dataset from postmortem human prefrontal cortex | Huuki-Myers L A, Montgomery K D, Kwon S H, Cinquemani S, Eagles N J, Gonzalez-Padilla D, Maden S K, Kleinman J E, Hyde T M, Hicks S C, Maynard K R, Collado-Torres L | 2025 | Genome Biology | Neuroscience | FISH-IF | HALO |
| Multiplex imaging of murine bone marrow using Phenocycler 2.0™ | Karnik S J, Gulbronson C, Jordan P C, Kanumuri R, Ramdas B, Kumar R, Hartman M L, Khurram I, Brown D M, Pollok K E, Singh P, Kapur R, Kacena M A | 2025 | Leukemia | Other | Highplex FL | HALO |
| Neoadjuvant toripalimab plus nimotuzumab combined with taxol-based chemotherapy in locally advanced penile squamous cell carcinoma | An X, Guo S J, Yan R, Xue T, Xiong L B, Ma H L, Xue C, Zhang Y C, Li J B, Chen M T, Li Z S, Liu T Y, Zhang Z L, Dong P, Li Y H, Yao K, Hu Z Q, Chen X F, Luo J X, Lei Y H, Liang P Y, Liu Z Z, Qi L, Xu W F, Cao Z G, Chen N H, Li X, Sheng X N, Luo G H, Shi B K, Xie Q, Liu Z W, Zhou F J, Spiess P E, Shi Y X, Han H | 2025 | Cancer Cell | Immuno-oncology | Multiplex IHC | HALO |
| Neo-adjuvant pembrolizumab in stage IV high-grade serous ovarian cancer: the phase II Neo-Pembro trial | Aronson S L, Thijssen B, Lopez-Yurda M, Koole S N, van der Leest P, León-Castillo A, Harkes R, Seignette I M, Sanders J, Alkemade M, Kemper I, Holtkamp M J, Mandjes I A M, Broeks A, Lahaye M J, Rijlaarsdam M A, van den Broek D, Wessels L F A, Horlings H M, van Driel W J, Sonke G S | 2025 | Nature Communications | Immuno-oncology | Classifier, Highplex FL | HALO |
| Targeting site-specific N-glycosylated B7H3 induces potent antitumor immunity | Huang Y, Zhong W-Q, Yang X-Y, Shan J-L, Zhou L, Li Z-L, Guo Y-Q, Zhang K-M, Du T, Zhang H-L, Hu B-X, Chen Y-H, Yang D, Feng G-K, Tang J, Zhu X-F, Deng R | 2025 | Nature Communications | Immuno-oncology | Multiplex IHC | HALO |
| A structural haplotype in the 17q21.31 MAPT region is associated with increased risk for chronic traumatic encephalopathy endophenotypes | Han X, Zhang Y, Petrosky J N, Bald S, Sherva R M, Labadorf A, Cherry J D, Chung J, Farrell K, Abdolmohammadi B, Durape S, Martin B M, Palmisano J N, Farrell J J, Alvarez V E, Huber B R, Dwyer B, Daneshvar D H, Dams-O’Connor K, Jun G R, Lunetta K L, Goldstein L E, Katz D I, Cantu R C, Shenton M E, Cummings J L, Reiman E M, Stern R A, Alosco M L, Tripodis Y, Farrer L A, Stein T D, Crary J F, McKee A C, Mez J | 2025 | Cell Reports Medicine | Neuroscience | HALO, HALO AI | |
| Phase 2 trial of perioperative chemo-immunotherapy for gastro-esophageal adenocarcinoma: The role of M2 macrophage landscape in predicting response | Alcindor T, Tankel J, Fiset P-O, Pal S, Opu T, Strasser M, Dehghani M, Bertos N, Zuo D, Mueller C, Cools-Lartigue J, Hickeson M, Marcus V, Camilleri-Broet S, Spatz A, Evaristo G, Farag M, Artho G, Elkrief A, Saleh R, Bailey S, Park M, Huang S, Sangwan V, Ferri L | 2025 | Cell Reports Medicine | Immuno-oncology | Classifier, Spatial Analysis, Highplex FL | HALO |
| Evolution of the tumor immune landscape during treatment with tebentafusp, a T cell receptor-CD3 bispecific | Sacco J, Kirk P, Leach E, Shoushtari A N, Carvajal R D, Britton-Rivet C, Khakoo S, Collins L, de la Cruz-Merino L, Eroglu Z, Ikeguchi A P, Nathan P, Hamid O, Butler M O, Stanhope S, Ranade K, Sato T | 2025 | Cell Reports Medicine | Immuno-oncology | Multiplex IHC | HALO |
| Midbrain cytotoxic T cells as a distinct neuropathological feature of progressive supranuclear palsy | Couto B, Forrest S L, Fearon C, Lee S, Knott S, Li J, Fox S H, Tartaglia M C, Lang A E, Kovacs G G | 2025 | Brain | Neuroscience | Area Quantification | HALO, HALO AI |
| Hypoxia-induced Wnt5a-secreting fibroblasts promote colon cancer progression | Harada A, Yasumizu Y, Harada T, Fumoto K, Sato A, Maehara N, Sada R, Matsumoto S, Nishina T, Takeda K, Morii E, Kayama H, Kikuchi A | 2025 | Nature Communications | Oncology | Area Quantification, Cytonuclear | HALO |
| Glycine receptor activation promotes pancreatic islet cell proliferation via the PI3K/mTORC1/p70S6K pathway | Zhang Z, Ye W W, Piro A L, Wang D S, Untereiner A, Lyons S A, Bhattacharjee A, Singh I, Beaudry J L, Orser B A, Dai F F, Wheeler M B | 2025 | JCI Insight | Other | Area Quantification, Highplex FL | HALO |
| Hypothalamic PNOC/NPY neurons constitute mediators of leptin-controlled energy homeostasis | Solheim M H, Stroganov S, Chen W, Subagia P S, Bauder C A, Wnuk-Lipinski D, Del Río-Martín A, Sotelo-Hitschfeld T, Beddows C A, Klemm P, Dodd G T, Lundh S, Secher A, Wunderlich F T, Steuernagel L, Brüning J C | 2025 | Cell | Neuroscience | FISH | HALO |
| Single-cell RNA sequencing dissects the immunosuppressive signatures in Helicobacter pylori-infected human gastric ecosystem | Hu W, Chen Z M, Wang Y, Yang C, Wu Z Y, You L J, Zhai Z Y, Huang Z Y, Zhou P, Huang S L, Li X X, Yang G H, Bao C J, Cui X B, Xia G L, Ou Yang M P, Zhang L, Wu W K K, Li L F, Tan L K, Zhang Y X, Gong W | 2025 | Nature Communications | Infectious Disease | HALO Link | |
| Stromal lipid species dictate melanoma metastasis and tropism | Gurung S, Budden T, Mallela K, Jenkins B, von Kriegsheim A, Manrique E, Millán-Esteban D, Romero-Camarero I, Amaral F, Craig S, Durao P, Pozniak J, Stennett L, Smith D, Ashton G, Baker A, Zeng K, Fruhwirth G, Sanz-Moreno V, Marques J, Koulman A, Marine J-C, Somervaille T C P, Motta L, Gaudy-Marqueste C, Nagore E, Virós A | 2025 | Cancer Cell | Oncology | Classifier | HALO |
| Mas Signaling Potentiates Neutrophil Extracellular Traps Formation Induced by Endothelial Cells Derived S1P in Mice with Acute Liver Failure | Yang B, Chen S, Xia X, Tao Z, Liu C, Li S, Zhang S, Huang J, Xia L, Quan W, Yang C, Li J | 2025 | Advanced Science | Gastroenterology | Area Quantification | HALO |
| LATE-NC Stage 3: a diagnostic rubric to differentiate severe LATE-NC from FTLD-TDP | Shahidehpour R K, Katsumata Y, Dickson D W, Ghayal N B, Aung K Z, Wu X, Phe P, Jicha G A, Neltner A M, Archer J R C, Corrada M M, Kawas C H, Sajjadi S A, Woodworth D C, Bukhari S A, Montine T J, Fardo D W, Nelson P T | 2025 | Acta Neuropathologica | Neuroscience | Object Colocalization | HALO |
| The anti-FRα antibody-drug conjugate luveltamab tazevibulin demonstrates efficacy in nonsmall cell lung cancer preclinical models and induces immunogenic cell death | Yuan R, McGeehan A, Zhou S, Cheng C, Armanini M, Smith J, Embry M, Pena R, Lewis D K, Hernandez G, Bajjuri K, Tran C, Yin G, Abrahams C, Li X, Gerber H-P, Yam A, Kiefel H | 2025 | Molecular Cancer | Immuno-oncology | Cytonuclear | HALO |
| Inhaled DNAI1 mRNA therapy for treatment of primary ciliary dyskinesia | Henniga M, Bhattacharjeea R B, Agarwala I, Alfaifia A, Casillasa J E, Chaveza S, Ishimarua D, Listona D, Mohapatraa S, Mollaa T, Patharea S, Sidhua M S, Wanga P, Wanga Z, Lombanaa T N, Kharitonova V G, Coucha J A, Lockharta D J, Wus B A | 2025 | Proceedings of the National Academy of Sciences | Other | Highplex FL | HALO |
| Efficacy of ATR kinase inhibitor elimusertib monotherapy or combination in tumors with DNA damage response pathway and other genomic alterations | Varadarajan K, Cruz Pico C X, Evans K W, Raso M G, Rizvi Y Q, Zheng X, Chachad D, DiPeri T P, Wang B, Scott S M, Zhao M, Akcakanat A, Wengner A M, Yap T A, Meric-Bernstam F | 2025 | Molecular Cancer | Oncology | Multiplex IHC | HALO |
| Harnessing the FGFR2/NF2/YAP signaling-dependent necroptosis to develop an FGFR2/IL-8 dual blockade therapeutic strategy | Chen D, Zhao Z, Hong R, Yang D, Gong Y, Wu Q, Wang Y, Cao Y, Chen J, Tai Y, Liu H, Li J, Fan J, Zhang W, Song Y, Zhan Q | 2025 | Nature Communications | Oncology | Multiplex IHC | HALO |
| Cancer‐Specific RNA Modifications in Tumour‐Derived Extracellular Vesicles Promote Tumour Growth | Monoe Y, Jingushi K, Taniguchi K, Hirosuna K, Arima J, Inomata Y, Takano Y, Hamamoto H, Komura K, Tanaka T, Hase H, Lee S-W, Tsujikawa K | 2025 | Journal of Extracellular Vesicles | Oncology | Multiplex IHC | HALO |
| SPP1 + macrophages cause exhaustion of tumor-specific T cells in liver metastases | Trehan R, Huang P, Zhu X B, Wang X, Soliman M, Strepay D, Nur A, Kedei N, Arhin M, Ghabra S, Rodríguez-Matos F, Benmebarek M R, Ma C, Korangy F, Greten T F | 2025 | Nature Communications | Immuno-oncology | Highplex FL | HALO |
| Highly conserved brain vascular receptor ALPL mediates transport of engineered AAV vectors across the blood-brain barrier | Moyer T C, Hoffman B A, Chen W, Shah I, Ren X-Q, Knox T, Liu J, Wang W, Li J, Khalid H, Kulkarni A S, Egbuchulam M, Clement J, Bloedel A, Child M, Kaur R, Rouse E, Graham K, Maura D, Thorpe Z, Sayed-Zahid A, Chung C H-Y, Kutchin A, Johnson A, Yao J, Thompson J, Pande N, Nonnenmacher M E | 2025 | Molecular Therapy | Neuroscience | Multiplex IHC, Highplex FL | HALO, HALO AI |
| Profiling triple-negative breast cancer-specific super-enhancers identifies high-risk mesenchymal development subtype and BETi-Targetable vulnerabilities | Chen Q, Cai R, Wang Y, Liang G, Zhang K, Yang X, Yang D, Zhao D, Zhu X, Deng R, Tang J | 2025 | Molecular Cancer | Oncology | Classifier, Cytonuclear, Highplex FL | HALO |
| Dissecting small cell carcinoma of the esophagus ecosystem by single-cell transcriptomic analysis | Wu H-X, Chen Y-K, Wang Y-N, Chen J-Y, Xiang S-J, Jin Y, Wang Z-X, Huang C-Y, Yang L-P, He Y, Guan W-L, Bai L, Chen Y-X, Wang M, Wang C-Y, Huang R-J, Huang Y, Zhang J-L, Lv Z-D, Yang S-Q, Xu R-H, Zhao Q, Wang F | 2025 | Molecular Cancer | Oncology | Highplex FL | HALO |
| Label-free multimodal optical biopsy reveals biomolecular and morphological features of diabetic kidney tissue in 2D and 3D | Fung A A, Li Z, Boote C, Markov P, Gaut J P, Jain S, Shi L | 2025 | Nature Communications | Other | HALO, HALO AI | |
| Spatial mapping of innate lymphoid cells in human lymphoid tissues and lymphoma at single-cell resolution | Van Acker N, Frenois F-X, Gravelle P, Tosolini M, Syrykh C, Laurent C, Brousset P | 2025 | Nature Communications | Immuno-oncology | Spatial Analysis, Highplex FL, Registration | HALO |
| USP2 inhibition unleashes CD47-restrained phagocytosis and enhances anti-tumor immunity | Dai P, Sun Y, Huang Z, Liu Y-T, Gao M, Liu H-M, Shi J, He C, Xiang B, Yao Y, Yu H, Xu G, Kong L, Xiao X, Wang X, Zhang X, Xiong W, Hu J, Lin D, Zhong B, Chen G, Gong Y, Xie C, Zhang J F | 2025 | Nature Communications | Immuno-oncology | Area Quantification | HALO |
| Cell-intrinsic metabolic phenotypes identified in patients with glioblastoma, using mass spectrometry imaging of 13C-labelled glucose metabolism | Tsyben A, Dannhorn A, Hamm G, Pitoulias M, Couturier D-L, Sawle A, Briggs M, Wright A J, Brodie C, Mendil L, Miller J L, Williams E C, Franzén L, De Jong G, Gracia T, Memi F, Bayraktar O A, Adapa R, Rao J, González-Fernández A, Consortium CRUK Rosetta Grand Challenge, Bunch J, Takats Z, Barry S T, Goodwin R J A, Mair R, Brindle K M | 2025 | Nature Metabolism | Oncology, Metabolism | Highplex FL | HALO |
| Rationale and feasibility of a rapid integral biomarker program that informs immune-oncology clinical trials: the ADVISE trial | Luke J, Bever K, Hodi F S, Taube J, Massey A, Yao D, Neely J, Tam R, Lee G, Gupta A, Dutta S, Szabo P, Bao R, Reilly T | 2025 | Journal for Immunotherapy of Cancer | Immuno-oncology | Cytonuclear | HALO |
| Atrial amyloidosis identified by biopsy in atrial fibrillation: prevalence and clinical presentation | Shinzato K, Takahashi Y, Yamaguchi T, Otsubo T, Nakashima K, Yoshioka G, Yokoi K, Tsuruta K, Osako R, Shichida S, Nishimura Y, Edayoshi M, Kawano Y, Shintani-Domoto Y, Miyazaki K, Fukui A, Kawaguchi A, Aoki S, Nomura S, Takahashi N, Ito K, Node K | 2025 | European Heart Journal | Fibrosis | HALO, HALO AI | |
| Type 2 cytokines pleiotropically modulate sensory nerve architecture and neuroimmune interactions to mediate itch | Jha M K, Han Y, Liu Z, Hara Y, Langohr I M, Morel C, Maloney C, Piepenhagen P, Xing H, Bodea C A, Bangari D S, Mattoo H, Hicks A | 2025 | Journal of Allergy and Clinical Immunology | Neuroscience | Cytonuclear | HALO |
| Synergistic blockade of SHP-2 and A2AR signal pathways with targeted nanoparticles restores anti-tumor immunity of CD8+ T cells | Chen M, Zhang L, Lin W, Zhou Z, Wang Y, Wang L, Gu H, Li J, Xu Z P | 2025 | Journal of Controlled Release | Immuno-oncology | Highplex FL | HALO |
| Phase II Trial of Hypofractionated Radiotherapy and Immunochemotherapy in Primary Refractory Diffuse Large B-Cell Lymphoma: Preliminary Results and Insights from Digital Spatial Profiling | Yang Y, Yu J, Hu X, Chen S, Zhao R, Huang C, Guo J, Tang T, Chen C, Lin Y, Wang Y, Liu T, Zheng H, Liao S, Chen J, Fu H, Liu T | 2025 | MedComm | Immuno-oncology | Highplex FL | HALO |
| Bronchopulmonary dysplasia with pulmonary hypertension associates with semaphorin signaling loss and functionally decreased FOXF1 expression | Shirazi S P, Negretti N M, Jetter C S, Sharkey A L, Garg S, Kapp M E, Wilkins D, Fortier G, Mallapragada S, Banovich N E, Eldredge L C, Deutsch G H, Wright C V E, Frank D B, Kropski J A, Sucre J M S | 2025 | Nature Communications | Other | FISH | HALO |
| Single-cell and spatial transcriptome analyses reveal tumor heterogeneity and immune remodeling involved in pituitary neuroendocrine tumor progression | Su W, Ye Z, Liu J, Deng K, Liu J, Zhu H, Duan L, Shi C, Wang L, Zhao Y, Gong F, Zhang Y, Hou B, You H, Feng F, Ling Q, Xiao Y, Guo Y, Fan W, Zhang S, Zhang Z, Hu X, Yao Y, Zheng C, Lu L | 2025 | Nature Communications | Oncology | Highplex FL | HALO |
| Anti-pyroglutamate-3 Aβ immunotherapy engages microglia and inhibits amyloid accumulation in transgenic mouse models of Aβ amyloidosis | Liao F, Calvo-Rodriguez M, Chhaya M, Sefrin J P, Charych E I, Mezler M, Clausznitzer D, McGlame E J, Zhao K, Rodgers A, Cao Y, Secker P F, Fernandez Garcia-Agudo L, Huang L, Klein C, Dellovade T, Karran E | 2025 | Acta Neuropathologica | Neuroscience | Area Quantification | HALO |
| Efficacy and safety of HBM4003 combined with toripalimab in refractory neuroendocrine neoplasms: a multicenter, phase II study | Zhang P, Chen K, Yang J, Song L, Zheng F, Luo R, He Y, Li F, Yang D, Cao N, Tao X, Shen L, Lu M, | 2025 | eClinicalMedicine | Immuno-oncology | Highplex FL | HALO |
| Epithelial GREMLIN1 disrupts intestinal epithelial-mesenchymal crosstalk to induce a wnt-dependent ectopic stem cell niche through stromal remodelling | Mulholland E J, Belnoue-Davis H L, Valbuena G N, Gunduz N, Ligeza A, Lin M, Biswas S, Vasquez E G, Omwenga S, Nasreddin N, Hodder M C, Wang L M, Ng A S, Jennings E, Midwood K S, Dedi N, Irshad S, Ridgway R A, Phesse T J, East J, Tomlinson I P M, Davies G C G, Sansom O J, Leedham S J | 2025 | Nature Communications | Other | FISH, Spatial Analysis, Highplex FL | HALO |
| Targeting CD39 boosts PD-1 blockade antitumor therapeutic efficacy via strengthening CD8 + TILs function and recruiting B cells in cervical cancer | Jiang L, Wu T, Qu X, Li S, Jiang Q, Ren T, Liang J, Ding Y, Hua K, Tang Z, Qiu J | 2025 | Journal of Nanobiotechnology | Immuno-oncology | Highplex FL | HALO |
| Multimodal data integration for biologically-relevant artificial intelligence to guide adjuvant chemotherapy in stage II colorectal cancer | Xie C, Ning Z, Guo T, Yao L, Chen X, Huang W, Li S, Chen J, Zhao K, Bian X, Li Z, Huang Y, Liang C, Zhang Q, Liu Z | 2025 | eBioMedicine | Oncology | Spatial Analysis, Highplex FL | HALO |
| Concurrent loss of the Y chromosome in cancer and T cells impacts outcome | Chen X, Shen Y, Choi S, Abdel-Hafiz H A, Basu M, Hoelzen L, Tufano M, Mani S K, Ranjpour M, Zhu J, Ramanujan V K, Koltsova E K, Calsavara V F, Knott S R V, Theodorescu D | 2025 | Nature | Oncology | FISH, Highplex FL, TMA | HALO |
| Gasdermin E deficiency limits inflammation and lung damage during influenza virus infection | Rosli S, Ambrose R L, Harpur C M, Lam M, Hodges C, Barry K T, West A C, Mansell A, Lawlor K E, Tate M D | 2025 | Cell Death & Disease | Infectious Disease | Highplex FL | HALO |
| Cyclophilin J Reprograms Tumor-associated Macrophages to Exert an Anti-tumor Effect in Liver Cancer | Wang J, Yao C, Zeng Q, Peng L, Zhang S, Mao Y, Fu L, Chen S, Sheng C | 2025 | International Journal of Biological Sciences | Immuno-oncology | Highplex FL | HALO |
| Anlotinib combined with benmelstobart as a chemo-free first-line treatment in advanced esophageal squamous cell carcinoma: an exploratory multicenter, single-arm phase II clinical trial | Meng X, Yang X, Hong Y, Wang W, Zhang Z, Xia J, Chen Y, Zhou Y, Lu T, Song M, Shan Z, Wu T, Wu W, Shen L, Guan L, Ma M, Wang L, Luo X, Xin D, Ma Y, Jiang G, Qi Y, Jiang B, Zhang D, Hu B, Wu X, Peng Z, Wang F | 2025 | Molecular Cancer | Oncology | Highplex FL | HALO |
| Single-cell transcriptome reveals the reprogramming of immune microenvironment during the transition from MASH to HCC | Huang Y, Xie Y, Zhang Y, Liu Z, Jiang W, Ye Y, Tang J, Li Z, Yin Z, Lin X-J | 2025 | Molecular Cancer | Immuno-oncology | Highplex FL | HALO |
| Mitsugumin 53 drives stem cell differentiation easing intestinal injury and inflammation | Pei Y, Fang M, Wu H-K, Cui Q, Quan L, Li X, Zhang K, Xie P, Jiang P, Liu Y, Huang M, Lv F, Hu X, Chen Y-G, Hu X, Xiao R-P | 2025 | Signal Transduction and Targeted Therapy | Gastroenterology | Highplex FL | HALO |
| Discovery of BMS-986408, a First-In-Class Dual DGKα and DGKζ Inhibitor That Unleashes PD-1 Checkpoint and CAR T-Cell Immunotherapies | Wichroski M, Liu S-Q, Zasadil L M, Benci J L, Gedeon P C, Condon K J, Joshi S, Posy S, Carlson P, Maier A, Shen J, Kureshi R, Amako Y, Wang T, Powles R L, Li Y, Lai T, Katsyv I, Qiu H, Qi H, Wong J, Zhao D, Banas D, Onorato J, Locke G, Chen X, Chou W-C, Cook E, Witt A E, Barbieri C M, Zhang H, Olsen J B, Font-Tello A, Drokhlyansky E, Grünenfelder D C, Chupak L, Longmire T A, Jones J C, Hollmann T J, Kugler D G, Feder J N, Bueno R, Wain J, Sivakumar P, Liu Y, Dougan S K, Paweletz C P, Barbie D A, Lees E | 2025 | Cancer Immunology Research | Immuno-oncology | Highplex FL, TMA | HALO |
| IFN-I-mediated neutropoiesis bias drives neutrophil priming and inflammatory comorbidities | Li Y, Chen Y, Deng C, Niu Y, Yang Y, Sun S, Hu Z, Wei Y, Xu M, Huang Y, Van Dyke T, Deng X | 2025 | Theranostics | Immunology | Highplex FL | HALO |
| Blood phenylalanine lowering partially reverses white matter changes in a mouse model of phenylketonuria | Manek R, Huang W, Huang Y, Guo L, Cornell C S, Shazeeb M S, Verbitsky A, Jackson R, Johnson J, Berthelette P, Yu D, Pfister E L, Bangari D, Ying X, Kumar D, Mueller C, Kyostio-Moore S | 2025 | Molecular Therapy | Neuroscience | Area Quantification | HALO |
| Cholesterol Metabolism-related Characteristics Predict Therapeutic Response and Survival in Esophageal Cancer | Tan L, Su X, Ma Y, Zeng C, Yue H, Zeng T, Li K, Guo Q, Li Y, Zhang X | 2025 | Journal of Advanced Research | Oncology | Highplex FL | HALO |
| TGFβ-dependent signaling drives tumor growth and aberrant extracellular matrix dynamics in NF1-associated plexiform neurofibroma | Abu-Sultanah M, Zhou Z, Jiang C, Mitchell D K, Bessler W K, Jiang L, Li X, Qian S, Smith A E, Mang H E, White E E, Ciesielski M D, Hickey B E, Brewster K M, Sandusky G E, Masters A, Angus S P, Clapp D W, Le L Q, Rhodes S D | 2025 | Science Advances | Neuroscience | Classifier, Area Quantification | HALO |
| Interferon-responsive HEVs drive tumor tertiary lymphoid structure formation and predict immunotherapy response in nasopharyngeal carcinoma | Liu S-X, Wu T-W, Luo D-H, Zhang L-L, Zhou L, Luo Y-L, Du W-T, Huang T-T, Jiang S, Zhang Z, Han P, Zeng M-S, Zhong Q | 2025 | Cell Reports Medicine | Immuno-oncology | Spatial Analysis, Highplex FL | HALO |
| Prophylactic and therapeutic neutralizing monoclonal antibody treatment prevents lethal yellow fever infection | Rust L, Ricciardi M J, Lutz S S, Yusova S, Louw J J, Yrizarry-Medina A, Biswas S, Fischer M, Barber-Axthelm A, Zilverberg G, Bailey L, Swanson T, Tonelli R, McElfresh G W, Rosen B C, Voigt T B, Panayiotou C, Mauter J T, Ghosh N, Meanor J, Godoy G, Axthelm M, Smedley J, Slifka M K, Kallas E G, Webb G, Zweig R, Labriola C S, Bimber B N, Sacha J B, Watkins D I, Burwitz B J | 2025 | JCI Insight | Infectious Disease | HALO Link | |
| Neo-antigen tumor vaccination depends on CD4-licensing conveyed by adenoassociated virus like particles | Neukirch L, Uhrig-Schmidt S, von Werthern K, Tuch A, Kraske J A, Lyu Y, Lenoir B, Eichmüller S B, Meyer M, Zörnig I, Jäger D, Schmidt P | 2025 | Molecular Therapy | Immuno-oncology | Multiplex IHC, Spatial Analysis | HALO |
| RPL6 Interacts with HMGCS1 to Stabilize HIF-1𝜶 by Promoting Cholesterol Production in Hepatocellular Carcinoma | Yang M, Cheng S, Gu H, Zhong S, Zhang D, He X, Chen W, Deng H, Ren J, Chen P, Tan M, Zhang H, Li F, Zhang Z, Hu Y, Chen J | 2025 | Advanced Science | Oncology | Highplex FL | HALO |
| Leptin levels are associated with body mass index and Alzheimer's disease in Down syndrome | Sordo L, Du A, Sandadi V, Dustagheer F B, Pasual J, Ngo P, Hom C L, Doran E, Head E | 2025 | Alzheimer's & Dementia | Neuroscience | HALO, HALO AI | |
| KEAP1 and STK11/LKB1 alterations enhance vulnerability to ATR inhibition in KRAS mutant non-small cell lung cancer | Galan-Cobo A, Vokes N I, Qian Y, Molkentine D, Ramkumar K, Paula A G, Pisegna M, McGrail D J, Poteete A, Cho S, Do M T, Karimi A, Kong Y, Solanki A, Karmokar A, Floc’h N, Hughes A, Sargeant R, Young L, Shen L, Kar G, Keshvani C, Arrechedera C, Hernandez S, Schlacher K, Wang J, Iyer S, Conway J, Keddar M R, Milo M, de Toma I, Critchlow S E, Barrett J C, Cosaert J, Lau A, Valge-Archer V, Byers L A, Barry S T, Heymach J V | 2025 | Cancer Cell | Oncology | Multiplex IHC | HALO |
| Amino acid changes in two viral proteins drive attenuation of the yellow fever 17D vaccine | Zhang J, Chavez E C, Winkler M, Liu J, Carver S, Lin A E, Biswas A, Tamura T, Tseng A, Wang D, Benhamou A, O' Connell A K, Matsuo M, Norton J E, Kenney D, Adamson B, Kleiner R E, Burwitz B, Crossland N A, Douam F, Ploss A | 2025 | Nature Microbiology | Infectious Disease | Highplex FL | HALO, HALO AI |
| Incidence and Immunopathology of Myositis in Rectal Cancer Patients Treated With Neoadjuvant Immune Checkpoint Inhibitors and Chemoradiotherapy: Findings From the CHINOREC Trial | Zirnbauer R, Hametner S, Bergler‐Klein J, Kuehrer I, Kulu A, Ammon D, Kabiljo J, Stift A, Schmid R, Müllauer L, Bittermann C, Laengle F, Machold K, Blüml S, Bergmann M, Laengle J | 2025 | MedComm | Immuno-oncology | Multiplex IHC | HALO, HALO AI |
| Enhancing CAR-T Cell Metabolic Fitness and Memory Phenotype for Improved Efficacy against Hepatocellular Carcinoma | You J, Yang X, Zhao J, Chen H, Tang Y, Ouyang D, Liu Y, Wang Y, Xie S, Chen Y, Liao J, Xiang T, Xia J, Yang C, Weng D | 2025 | International Journal of Biological Sciences | Immuno-oncology | Multiplex IHC | HALO |
| Unravelling relatlimab-specific biology using biomarker analyses in patients with advanced melanoma in RELATIVITY-047 | Lipson E, Dolfi S, Tang H, Tawbi H, Medina-Soto F, Castillo Gutiérrez E, Rutkowski P, Gogas H, Murillo E, Ascierto P, Desai K, Maio M, Demers K, Mazzei A, Keidel S, Miller-Moslin K, Yu J X, Hodi F S, Schadendorf D, Long G V, Garnett-Benson C | 2025 | Clinical Cancer Research | Immuno-oncology | Multiplex IHC | HALO |
| The CXCL16/CXCR6 axis is linked to immune effector cell-associated neurotoxicity in chimeric antigen receptor (CAR) T cell therapy | Lu I, Müller-Miny L, Krekeler C, Cheung P F-Y, Antonopoulou G, Jeibmann A, Schulte-Mecklenbeck A, Kerl K, Call S, Reicherts C, Bleckmann A, Stelljes M, Lenz G, Wiendl H, Meyer zu Hörste G, Grauer O M | 2025 | Genome Medicine | Immuno-oncology | Spatial Analysis, Highplex FL | HALO |
| Overcoming multidrug resistance in gastrointestinal cancers with a CDH17-targeted ADC conjugated to a DNA topoisomerase inhibitor | Wang R, Fang P, Chen X, Ji J, Yu D, Mei F, Wang Z, Zhou W, Peng W, Wang R, Wang J, Guo C, Wu H, Liu D, Tan X, Gui X | 2025 | Cell Reports Medicine | Oncology | Multiplex IHC | HALO |
| DLL3 serves as a pivotal hub bridging malignant progression and immunosuppression in NECC with therapeutic implications validated via organoid-TILs co-culture system | Liu Q, Qu X, Li S, Ding Y, Ren T, Jiang Q, Ding J, Hua K, Qiu J | 2025 | Genes & Diseases | Oncology | Highplex FL | HALO |
| B7-H3 CAR T-cells are effective against ependymomas, but limited by tumor size and immune response | Mehta S, Ippagunta S, Varadharajan S, Kardian A, Laboe N, Dinh D, Jones A B, Meehl M M, Ibañez J, Emanus E, Dao T, Ward M B, Orisme W, Lange S, Langfitt D, Steinberg J, Chiang J, Vogel P, Sheppard H, Ellison D W, Mack S C, Krenciute G | 2025 | Clinical Cancer Research | Immuno-oncology | Area Quantification, Multiplex IHC | HALO |
| Gene context drift identifies drug targets to mitigate cancer treatment resistance | Jassim A, Nimmervoll B V, Terranova S, Nathan E, Hu L, Taylor J T, Masih K E, Ruff L, Duarte M, Cooper E, Katyal G, Akhbari M, Gilbertson R J, Coleman J C, Toker J S, Terhune C, Balmus G, Jackson S P, Liu H, Jiang T, Taylor M D, Hua K, Abraham J E, Filbin M G, Hill A, Patrizi A, Dani N, Regev A, Lehtinen M K, Gilbertson R J | 2025 | Cancer Cell | Oncology | Highplex FL | HALO |
| Trajectory analysis reveals an uncommitted neuroblastic state in MYCN-driven neuroblastoma development | Tsubota S, Carter D R, Seneviratne J A, Hirose H, Shimamura T, Kashima Y, Suzuki Y, Tsuda K, Marshall G M, Kadomatsu K | 2025 | Neuro-Oncology | Oncology | FISH | HALO |
| Impact of the tumor immune contexture in microsatellite-stable metastatic colorectal cancer treated with avelumab, cetuximab, and irinotecan | Huyghe N, Benidovskaya E, Masoodi T, Sinapi I, De Cuyper A, Vempalli F, Beyaert S, Bouzin C, Maestre Osorio F, Ferraro L, van Baren N, Helaers R, Goffette P, Ghaye B, van Maanen A, Castella M-L, Ceccarelli M, Bedognetti D, Galon J, Hendrickx W R L, Carrasco J, Van den Eynde M | 2025 | Cell Reports Medicine | Immuno-oncology | Highplex FL | HALO, HALO AI |
| Performance of novel tau antibodies across multiple modalities for Alzheimer’s disease assessment | Trivedi P, Forrest K, Fisher D W, Winstone J K, McMillan P J, Valentine M, Postupna N, Wilson A, Bajwa T, MacCoss M J, Keene C D, Darvas M, Kraemer B C, Hoofnagle A N, Latimer C S | 2025 | Alzheimer's & Dementia | Neuroscience | Area Quantification | HALO |
| Macrophage-T cell interactions promote SLAMF1 expression for enhanced TB defense | Krishna Prasad G V R, Grigsby S J, Erkenswick G A, Portal-Celhay C, Mittal E, Yang G, Fallon S M, Chen F, Klevorn T, Jain N, Li Y, Mitreva M, Martinot A J, Ernst J D, Philips J A | 2025 | Nature Communications | Immunology | Area Quantification | HALO |
| A nociceptive amygdala-striatal pathway modulating affective-motivational pain | Wojick J A, Paranjapye A, Chiu J K, Oswell C S, Mahmood M, Wooldridge L M, Kimmey B A, Sandoval Ortega R A, McCall N M, Han S, Wu J W K, Yung M, Ejoh L L, Chehimi S N, Crist R C, Reiner B C, Korb E, Corder G | 2025 | Science Advances | Neuroscience | Highplex FL | HALO |
| ACLY inhibition promotes tumour immunity and suppresses liver cancer | Gautam J, Wu J, Lally J S V, McNicol J D, Fayyazi R, Ahmadi E, Oniciu D C, Heaton S, Newton R S, Rehal S, Bhattacharya D, Di Pastena F, Nguyen B, Valvano C M, Townsend L K, Banskota S, Batchuluun B, Jabile M J T, Payne A, Lu J, Desjardins E M, Kubota N, Tsakiridis E E, Mistry B, Aganostopoulos A, Houde V, Dansercoer A, Verschueren K H G, Savvides S N, Hammill J A, Bezverbnaya K, Muti P, Tsakiridis T, Dai W, Jiang L, Hoshida Y, Larché M, Bramson J L, Friedman S L, Verstraete K, Wang D, Steinberg G R | 2025 | Nature | Immuno-oncology | Multiplex IHC | HALO |
| AR+TREM2+ macrophage induced pathogenic immunosuppression promotes prostate cancer progression | Wang Q, Wu Y, Long Y, Li R, Shi Y, Zheng Y, Chen X, Li X, Zhou Y, Huang X, Jiang G | 2025 | Nature Communications | Immuno-oncology | Highplex FL | HALO |
| A diverse landscape of FGFR alterations and co-mutations suggests potential therapeutic strategies in pediatric low-grade gliomas | Apfelbaum A, Morin E, Sturm D, Ayoub G, DiGiacomo J, Bahadur S, Chandarana B, Power P C, Cusick M M, Novikov D, Prabhakar P, Jones R E, Vogelzang J, Bossi C C, Malinowski S, Woodward L M, Jones T A, Jeang J, Lamson S W, Collins J, Cai K Y, Jones J S, Oh S, Jeon H, Wang J, Cameron A, Rechter P, De Leon A, Murugesan K, Montesion M, Albacker L A, Ramkissoon S H, van Tilburg C M, Hardin E C, Sievers P, Sahm F, Yeo K K, Rosenberg T, Chi S N, Wright K D, Hébert S, Peck S, Picca A, Larouche V, Renzi S, Buhrlage S J, Bale T A, Smith A A, Touat M, Jabado N, Fischer E S, Eck M J, Baird L, Witt O, Kleinman C L, Nguyen Q D, Sheer D, Alexandrescu S, Jones D T W, Ligon K L, Bandopadhayay P | 2025 | Nature Communications | Oncology | HALO, HALO AI | |
| Endoplasmic reticulum-localized circular RNA FAM13B restrains nasopharyngeal carcinoma lymphatic metastasis through downregulating XBP1 | Jia G‑D, Xie S‑Y, Li X‑Y, Li L‑J, Jin J, Liu L‑T, Sun X‑S, Liu S‑L, Chen Q‑Y, Tang L‑Q, Yuan L, Mai H‑Q | 2025 | Journal of Experimental & Clinical Cancer Research | Oncology | ISH | HALO |
| Preclinical advances in glofitamab combinations: a new frontier for non-Hodgkin lymphoma | Sam J, Leclercq-Cohen G, Gebhardt S, Surowka M, Herter S, Lechner K, Relf J, Briner S, Varol A, Appelt B, Domocos I, Nicolini V G, Bez M, Bommer E, Jenni S, Schoenle A, Le Clech M, Colombetti S, Klein C, Umaña P, Lundberg P, Korfi K, Bottos A, Bacac M | 2025 | Blood | Immuno-oncology | Multiplex IHC | HALO |
| Identification of amino acid residues in polymerase PB2 responsible for differential replication and pathogenicity of avian influenza virus H5N1 isolated from human and cattle in Texas, US | Bayoumi M, Barre R S, Escobedo R A, Shivanna V, Jackson N, Ye C, García-Sastre A, Mostafa A, Martinez-Sobrido L | 2025 | Emerging Microbes & Infections | Infectious Disease | HALO, HALO AI | |
| Multi-omics prediction of axillary treatment response and tumour microenvironment alterations in lymph node-positive luminal breast cancer | Ma T, Wang Z, Zhou Z, Wang Y, Ma T, Liu X, Mao Y, Wang H | 2025 | Cell Death & Disease | Oncology | Highplex FL | HALO |
| PROCR diminishes the efficacy of radiation by impairing T-cell-mediated antitumour immunity | Chen W, Zhang C, Li Z, Xu Z, Ding C, Wu J, Wei H, Deng Z, He T, Long L, Mao Y, Ma J, Liang X | 2025 | Nature Communications | Immuno-oncology | HALO, HALO AI | |
| Histopathology-based protein multiplex generation using deep learning | Andani S, Chen B, Ficek-Pascual J, Heinke S, Casanova R, Hild B F, Sobottka B, Bodenmiller B, Koelzer V H, Rätsch G | 2025 | Nature Machine Intelligence | Other | HALO, HALO AI | |
| Targeting Msx2 as a brake in the fusion fate of osteoclasts and an anabolic therapy in pre-clinical models of osteoporosis | Ma Q, Wang S, Xue H, Ni L, Yuan P, Shen Y, Zheng B, Wang Q, Zhang J, Wang H, Xie H, Jiang C, Qin A, Fan S, Xie Z, Jie Z | 2025 | Nature Communications | Other | Highplex FL | HALO |
| Inhibition of astrocyte signaling leads to sex-specific changes in microglia phenotypes in a diet-based model of cerebral small vessel disease | Gollihue J L, Aung K Z, Rogers C B, Galopin L B, Wright N A, Sompoldej P, Weekman E M, Katsumata Y, Morganti J M, Norris C M | 2025 | Journal of Neuroinflammation | Neuroscience | Area Quantification | HALO |
| Phase I trial of ADP-A2AFP TCR T-cell therapy in patients with advanced hepatocellular or gastric hepatoid carcinoma | Meyer T, Finn R S, Borad M, Mahipal A, Edeline J, Houot R, Hausner P F, Hollebecque A, Goyal L, Frigault M, Evans T R J, Wong K M, Tan B R, Mitry E, Sarker D, Feun L, El-Rayes B, Thistlethwaite F, Kaseb A, Alese O, Jin Z, Cirillo C, Bruix J, Roddie C, Noto P, Fayngerts S, Cristiani S, Sampson J, Bai J, Isabelle M, Broad R, Sun A, Norry E, Sangro B | 2025 | Journal of Hepatology | Immuno-oncology | Highplex FL, ISH-IHC | HALO |
| Enhanced formation of tertiary lymphoid structures shapes the anti-tumor microenvironment in hepatocellular carcinoma after FOLFOX-HAIC therapy | Xing R, Mei J, Zuo Z, Zou H, Yu X, Xu J, Guo R, Wei W, Zheng L | 2025 | Cell Reports Medicine | Immuno-oncology | Multiplex IHC, Spatial Analysis, Highplex FL | HALO |
| Cancer-induced nerve injury promotes resistance to anti-PD-1 therapy | Baruch E N, Gleber-Netto F O, Nagarajan P, Rao X, Akhter S, Eichwald T, Xie T, Balood M, Adewale A, Naara S, Sathishkumar H N, Islam S, McCarthy W, Mattson B J, Ferrarotto R, Wong M K, Davies M A, Jindal S, Basu S, Roversi K, Nikpoor A R, Ahmadi M, Ahmadi A, Harwood C, Leigh I, Gong D, Tallón de Lara P, Tao D L, Davidson T M, Ajami N J, Futreal A, Rai K, Kochat V, Castillo M, Gunaratne P, Goepfert R P, Hernandez S D, Khushalani N I, Wang J, Watowich S S, Calin G A, Migden M R, Yuan M, Liu N, Ye Y, Hwang W L, Vermeer P D, D’Silva N J, Bunimovich Y L, Yaniv D, Burks J K, Gomez J, Dougherty P M, Tsai K Y, Allison J P, Sharma P, Wargo J A, Myers J N, Talbot S, Gross N D, Amit M | 2025 | Nature | Immuno-oncology | Multiplex IHC | HALO |
| Spatiotemporal analyses of the pan-cancer single-cell landscape reveal widespread profibrotic ecotypes associated with tumor immunity | Han Y, Zhang L, Sun D, Cao G, Wang Y, Yue J, Hu J, Dong Z, Li F, Li T, Zhang P, Wu Q, Wang C | 2025 | Nature Cancer | Oncology | Highplex FL | HALO |
| Development and Preclinical Evaluation of Next-generation ΔsigH-based Live Candidate Vaccines | Arora G, Munson C W, Ahmed M, Shivanna V, Devi A, Devireddy V S, Antony B, Hall-Ursone S, Gonzalez O D, Dick E Jr, Jagannath C, Alvarez X, Mehra S, Khader S A, Singh D K, Kaushal D | 2025 | JCI Insight | Infectious Disease | Multiplex IHC | HALO |
| Chronic integrated stress response causes dysregulated cholesterol synthesis in white matter disease | Lin K, Ly N, Kunjamma R B, Vu N, King B, Robb H M, Mohler E G, Sridar J, Hao Q, Zavala-Solorio J, Zhang C, Shahryari V, van Bruggen N, Connelly C F, Bennett B D, Lee J J, Sidrauski C | 2025 | JCI Insight | Neuroscience | Area Quantification, Multiplex IHC | HALO |
| Paris polyphylla var. yunnanensis Leaf-Derived Extracellular Vesicle-Like Particles Enhance Periodontal Regeneration | Huang G, Liu A, Hu Y, Yang R, Dai Z, Meng W, Yan Y, Yang H, Li S | 2025 | Biomaterials Research | Biomaterials | Area Quantification, Multiplex IHC | HALO |
| Immuno-oncologic profiling of renal masses using multiparametric MRI: a pilot study | Liu M, Bane O, Mu X, Al-Mubarak H, Abboud G, Reddy A, Kennedy P, Robson P, Meilika K, Zuluaga L, Horowitz A, Kuhn B, Thin T, Garcia-Barros M, Brody R, Badani K, Taouli B, Lewis S | 2025 | Journal for Immunotherapy of Cancer | Immuno-oncology | Multiplex IHC | HALO |
| PD-L1 phenotype classification based on expression in tumor and immune cells as a potential biomarker for optimizing anti-PD-1/CTLA-4 immunotherapies in NSCLC | Miyakoshi J, Yoshida T, Uehara Y, Takeyasu Y, Shirasawa M, Fukuda A, Kashima J, Kumagai S, Horinouchi H, Ono H, Shiraishi K, Kohno T, Kondo S, Goto Y, Yamamoto N, Yatabe Y, Hosomi Y, Kurata T, Naoki K, Suzuki T, Ohe Y | 2025 | Journal for Immunotherapy of Cancer | Immuno-oncology | Spatial Analysis, Highplex FL | HALO |
| Neutrophil extracellular traps–STC1 positive feedback loop promotes immune evasion and metastasis in bladder cancer | Cai T, Feng T, Zhang W, Ge Q, Peng L, Wang Y, Xie J, Deng X, Zhu W, Jin S, Wang J, Ye D, Zhu Y | 2025 | Journal for Immunotherapy of Cancer | Immuno-oncology | Spatial Analysis, Highplex FL | HALO |
| Innate immune and metabolic signals induce mitochondria-dependent membrane lysis via mitoxyperiosis | Wang Y, Lu J, Carisey A, Chadchan S, Lee H, Malireddi R, Sharma B, Pandian N, Tweedell R, Palacios G, Mora N, Robinson C, Pitre A, Vogel P, Chen T, Murphy M, Kanneganti T | 2025 | Cell | Other | Area Quantification | HALO |
| Mutations in the β-tubulin TUBB impair ciliogenesis and are associated with ciliopathy-like phenotypes | Mollica A, Omer S, Forguson G, Steiman S, Evagelou S, Naumenko S, Walker S, Li L, Teeling A, Lindsay K, Erwood S, Visuvanathan S, Vig A, Vernon R, Akman B, Smith-Hicks C, Forman-Kay J, Shroff M, Pai V, Harrison R, Cohn R, Ivakine E | 2025 | Nature Communications | Neuroscience | Area Quantification | HALO |
| NSD2 targeting reverses plasticity and drug resistance in prostate cancer | Li J, Vasciaveo A, Karagiannis D, Sun Z, Gretarsson K, Chen X, Ouerfelli O, Socciarelli F, Frankenstein Z, Dong H, Zou M, Yuan W, Yang G, Aizenman G, Pannellini T, Xu X, Beltran H, Chen Y, Gardner K, Robinson B, de Bono J, Gozani O, Abate-Shen C, Rubin M, Loda M, Sawyers C, Califano A, Lu C, Shen M | 2025 | Nature | Oncology | Highplex FL | HALO, HALO AI |
| Anti-uPAR CAR T cells reverse and prevent aging-associated defects in intestinal regeneration and fitness | Eskiocak O, Gewolb J, Shah V, Rouse J, Chowdhury S, Akyildiz E, Fernández-Maestre I, Boyer J, Filliol A, Harris A, Utama R, Guo G, Castro-Hernández C, Nnuji-John E, Chung C, Anderson A, Flowers S, Habel J, Romesser P, Levine R, Lowe S, Sadelain M, Beyaz S, Amor C | 2025 | Nature Aging | Gastroenterology | Highplex FL | HALO |
| HMGA2 links morphological evolution and microenvironment dynamics to systemic therapy response in clear cell renal cell carcinoma | Nakamoto T, Yoshida T, Ohe C, Yasukochi Y, Atsumi N, Sano T, Higasa K, Uchida K, Tsuta K, Kinoshita H | 2025 | Journal for Immunotherapy of Cancer | Oncology | Highplex FL | HALO |
| Presence of SARS-CoV-2 in fetal organs via intraamniotic infection | Wu S, Tang L, Liu Z, Wu M, He X, Shan S, Zhou Y, Lin K, Xu Q, Tan S, Zhang Z, Xu Y, Wang C, Zhu F, Wei Z, Jin L | 2025 | Nature Communications | Infectious Disease | Highplex FL | HALO |
| Efferocytosis-Driven Polyamine Metabolism in Macrophages Enhances Cancer Stem Cell Enrichment after Chemotherapy in Ovarian Cancer | Li W, Ying F, Pang X, Wu Q, Li G, Huang L, Xin J, Liu X, Liu P, Xu X, Tan S, Gao Y, Liu T, Sun S, Wang X, Wen Y, Cai L, Du S, Zhang Y, Cai J | 2025 | Advanced Science | Oncology | Highplex FL | HALO |
| Distinct spatially resolved tumor microenvironment trajectories define benefit from ramucirumab plus pembrolizumab in refractory PD-L1+ gastric cancer | Lim S, An M, Heo Y, Lee H, Min B, Mehta A, Ahn S, Kim K, Kim S, Klempner S, Lee J | 2025 | Cancer Immunology Research | Immuno-oncology | Spatial Analysis, Highplex FL | HALO |
| USP22 drives tumor immune evasion and checkpoint blockade resistance through EZH2-mediated epigenetic silencing of MHC-I | Liu K, Iyer R, Li Y, Zhu J, Cai Z, Wei J, Cheng Y, Tang A, Wang H, Gao Q, Mani N, Marx N, Gao B, Watterson D M, Khan S A, Gradishar W J, Liu H, Fang D | 2025 | The Journal of Clinical Investigation | Immuno-oncology | Highplex FL | HALO |
| Oncolytic virus-induced IL-1β+ monocyte-IL-6+ CAF axis suppresses dendritic cell-mediated antitumor immunity in pancreatic cancer | Li F, Chen J, Li Y, Wang W, Yang Y, Wang J, Han M, Wang H, Zhou F, Ma W, Wang Y, Zhang Z, Yu J, Zhao Z, Deng L, Liu S, Wan Y, Zhao Z, Xu S, Li J, Cao Y, Zhang H | 2025 | Journal for Immunotherapy of Cancer | Immuno-oncology | Highplex FL | HALO |
| Tumour-reactive heterotypic CD8 T cell clusters from clinical samples | Ibáñez-Molero S, Veldman J, Nieto J, Traets J, George A, Hoefakker K, Karomi A, Harkes R, van den Broek B, Pack S, Tas L, Visser N, van Hal-van Veen S, Alóndiga-Mérida P, Alkemade M, Seignette I, Tissier R, Nieuwland M, van Baalen M, Poźniak J, Mul E, Tol S, Stenqvist S, Nilsson L, Nilsson J, Haanen J, van Houdt W, Peeper D | 2025 | Nature | Immuno-oncology | Highplex FL | HALO |
| Mature tertiary lymphoid structures support B cell-mediated antitumour immunity and are disrupted by neoadjuvant therapy in rectal cancer: a multicentre, retrospective study | Tian N, Wang Q, Lv Y, Zhong W, Li W, Cai H, An R, Zhu H, Sun L, Yuan Q, Dong X, Dong J, Bai J, Liu A, Chen G, Wu B, Du J | 2025 | eBioMedicine | Immuno-oncology | Spatial Analysis, Highplex FL | HALO |
| Hepatic zonation determines tumorigenic potential of mutant β-catenin | Raven A, Gilroy K, Jin H, Waldron J, Leslie H, Munro J, Hall H, Ridgway R, Ford C, Gulhan D, Vlahov N, Mills M, Hartley A, Anderson E, Bryson S, Sphyris N, Müller M, May S, Cadden B, Nixon C, Waddell S, Guest R, Boulter L, Barker N, Clevers H, Zhu H, Ivaska J, Strathdee D, Miller C, Jamieson N, Bushell M, Park P, Bird T, Sansom O | 2025 | Nature | Oncology | Classifier, Area Quantification, Highplex FL | HALO |
| Genetic variation in TMEM106B alters microglial activation and cytokine responses in chronic traumatic encephalopathy | Hartman S, Aytan N, Nicks R, Hawkins S, Cherry J, Alvarez V, Meng G, Tripodis Y, Martin B, Palmisano J, Goldstein L, Katz D, Dwyer B, Daneshvar D, Crary J, Alosco M, Xia W, McKee A, Mez J, Stein T | 2025 | Acta Neuropathologica | Neuroscience | HALO, HALO AI | |
| Targeting tumor-intrinsic BCL9 reverses immunotherapy resistance by eliciting macrophage-mediated phagocytosis and antigen presentation | Wu S, Zhu Y, Sun J, Wang C, Wang Y, Nie Y, Song F, Huang X, Chen Z, He T, Shen L, Xu Y, Huang C, Qiu S, Zhou J, Zhu A, Fan J, Zhu D, Hu B, Yang X | 2025 | Nature Communications | Immuno-oncology | Highplex FL | HALO |
| ZUP1 promotes DNA repair and immune evasion to drive olaparib resistance in triple-negative breast cancer | Huang S, Qiu Y, Wu L, Xie Y, He Z, Li Y, Xie X | 2025 | Journal of Advanced Research | Oncology | Microglia, Highplex FL | HALO |
| Microbial signals in primary and metastatic brain tumors | Morad G, Damania A, Melendez B, Singh B, Veguilla F, Soto R, Hoballah Y, Sahasrabhojane P, Wong M, Ahmed M, Rico R, Lewis K, Wani K, Shamsutdinova D, Segura R, Ingram D, Goethe E, Day A, Flores I, McDaniel L, Chelvanambi M, Johnson S, Dimitriou F, Gupta P, Oberai S, Zal M, Doss P, Jamal M, Hayase E, Wathoo C, Norberg L, Jenkins S, Nass S, Gumin J, Long L, Yang J, Bradley G, Bekal M, Dono A, Pichardo-Rojas P, Andrewes S, Ballester L, Losh J, Liang J, Huo L, Nielsen D, Kerrigan B, Brastianos P, Fowlkes N, Chang C, Jenq R, Gomez-Manzano C, Huse J, Davies M, Lazar A, Bhat K, Tandon N, Esquenazi Y, Peterson C, Puduvalli V, Lang F, Johnston C, Bullman S, Ajami N, Ferguson S, Wargo J | 2025 | Nature Medicine | Oncology | Highplex FL | HALO |
| Orexin receptors 1 and 2 in serotonergic neurons differentially regulate peripheral glucose metabolism in obesity | Xiao X, Yeghiazaryan G, Hess S, Klemm P, Sieben A, Kleinridders A, Morgan D A, Wunderlich F T, Rahmouni K, Kong D, Scammell T E, Lowell B B, Kloppenburg P, Brüning J C, Hausen A C | 2025 | Nature Communications | Neuroscience | Highplex FL | HALO |
| HIF‐1 Targeting Intervention Renders Protection From Alzheimer's‐Like Pathology in a Humanized Mice Model of HIV Infection | Ray S, Kumar M, Chemparathy DT, Dash PK, Sil S | 2025 | Journal of Extracellular Vesicles | Neuroscience | Classifier | HALO |
| APOE4 to APOE2 allelic switching in mice improves Alzheimer’s disease-related metabolic signatures, neuropathology and cognition | Golden L, Siano D, Stephens I, MacLean S, Saito K, Nolt G, Funnell J, Pallerla A, Lee S, Smith C, Chen J, Zhu H, Voy C, Whitus C, Hernandez G, Farmer B, Pandya K, Cowley D, Macauley S, Gordon S, Morganti J, Johnson L | 2025 | Nature Neuroscience | Neuroscience | Area Quantification, Object Colocalization, Spatial Analysis | HALO |
| REMODELing mechanistic trials for kidney disease: a multimodal, tissue-centered approach to understand the renal mechanism of action of semaglutide | Pruijm M, Belmar N, Bjornstad P, Cherney D, Das V, Gunnarsson T, Hodgin J, Schytz P, Tuttle K, Kretzler M | 2025 | Kidney International | Other | HALO, HALO AI | |
| Anti-progestin therapy targets hallmarks of breast cancer risk | Simões B, Pedley R, McCloskey C, Roberts M, Reed A, Twigger A, Tharmapalan P, Caruso A, Cabral S, Wilby A, Harrison H, Zhou Y, Greenhalgh A, Alghamdi S, Forestiero M, Lopez-Muñoz J, Roche J, Tuieng R, Khan M, Squires S, Astley S, Harkness E, Santiago-Gómez A, Spence K, Ritchie J, Pritchard S, Lim Y, Sherratt M, Andò S, Howell A, Evans D, Gilmore A, Khaled W, Khokha R, Clarke R, Howell S | 2025 | Nature | Oncology | Multiplex IHC, Highplex FL | HALO |
| Single-cell multi-omics analysis revealed the expansion of age-associated B cells in the pancreas of type 1 autoimmune pancreatitis patients | Wang J, Liu C, Zhang X, Che T, Zhao Y, Yang Q, Qin X, Chen Y, Ao X, Shen X, He X, Gong T, Zhang L, Zhang M, Wang D, Du Y, Wen L, Ye Y, Zhang Y, Zhou C, Zou D | 2025 | Genome Medicine | Immunology | Classifier, Spatial Analysis, Highplex FL | HALO |
| HDAC4/MybL1/YAP novel signaling axis is required for pancreatic cancer metastasis to the liver | Edderkaoui M, Elmadbouh O, Lim A, Ou Y, Hauptschein D, Guha A, Darwish A, Calsavara V, Murali R, Bhowmick N, Osipov A, Mathison A, Urrutia R, Wang Q, Pandol S | 2025 | International Journal of Biological Sciences | Oncology | Highplex FL | HALO |
| Cryoablation plus sintilimab and lenvatinib in advanced or metastatic intrahepatic cholangiocarcinoma: a phase 2 trial | Gu S, Luo Q, Zhang Y, Qian L, Chen K, Liang F, Hu Y, Zhou R, Wang Y, Liu J, Ning Z, Xu L, Meng Z, Li Y, Wang P | 2025 | Nature Cancer | Immuno-oncology | Highplex FL | HALO |
| Prostate cancer in situ autovaccination with the intratumoral viral mimic poly-ICLC: Modulating the cold tumor microenvironment | Nair S, Chakravarty D, Balan S, Hakansson A, Duval M, Davicioni E, Liu Y, Bhardwaj S, Thin T, Garcia-Barros M, Haines K, Al Shaarani M, Weil R, Meseck M, Ratnani P, Fatterpekar M, Gonzalez-Gugel E, Farkas A, Wagaskar V, Jambor I, Schlussel K, Pasat-karasik C, Bhatt K, Dovey Z, Pedraza A, Gupta A, Lundon D, Peros A, Parekh S, Davenport L, Zhang X, Gupta R, Robison M, Knauer C, Ellis E, Rykunov D, Reva B, Padanilam B, Galsky M, Brody R, Menon M, Salazar A, Bhardwaj N, Tewari A | 2025 | Med | Immuno-oncology | Multiplex IHC | HALO |
| The swine IsoLoop model of the gut host-microbiota interface enables intra-animal treatment comparisons to advance 3R principles | Bayne J, Charavaryamath C, Hu Y, Yousefi F, Murphy M, Law A, Michael A, Muyyarikkandy M, Nibbering B, Smits W, Kuijper E, Opriessnig T, Sauer M, Scaria J, Sponseller B, Ramirez A, Mooyottu S | 2025 | Gut Microbes | Infectious Disease | Classifier | HALO |
| Empowering chemotherapy-induced antitumor immunity by multi-targeted synergistic combination nanomedicine for triple-negative breast cancer | Alradwan I, Zhi P, Zetrini A, Wang L, He C, Rezaeifarimani M, Henderson J, Rauth A, Wu X | 2025 | Materials Today Bio | Immuno-oncology | Area Quantification, Multiplex IHC, Highplex FL | HALO |
| Prognostic Significance of the Density and Spatial Distribution of Tumor‐Associated Macrophages in Giant Cell Tumor of Bone and Their Association With Denosumab Treatment Responsiveness | Yang Y, Liu J, Han Y, Zhu G, Niu H, Zheng B, Tang X, Li J, Kang Y, Yu J, Zheng B, Zhou B | 2025 | MedComm | Immuno-oncology | Spatial Analysis, Highplex FL | HALO |
| Spatiotemporal transcriptomics deciphered neutrophil-activated interleukin-36 as driver and effective therapeutic target in Sweet syndrome | Fu Y, Wu C, Pang Z, Liu T, Jia Q, Liu Y, Li H, Zhang S, Zhang H, Li X, Wang S, Feng J, Liu J, Lv Y, Zhang F, Chen W, Jin H | 2025 | British Journal of Dermatology | Dermatology | Multiplex IHC | HALO |
| Neoadjuvant immunotherapy in mismatch-repair-proficient colon cancers | Tan P, Verschoor Y, van den Berg J, Balduzzi S, Kok N, Ijsselsteijn M, Moore K, Jurdi A, Tin A, Kaptein P, van Leerdam M, Haanen J, Voest E, de Miranda N, Schumacher T, Wessels L, Chalabi M | 2025 | Nature | Immuno-oncology | Multiplex IHC | HALO |
| Parity and lactation induce T-cell-mediated breast cancer protection | Virassamy B, Caramia F, Savas P, Harris M, Pan J, Wang J, Brown E, O’Malley M, van Geelen C, Hun M, Burn T, Sant S, Ballan J, Kay J, Lara Gonzalez L, Clarke K, Aw Yeang H, Idrizi R, Jana M, Challice D, Salgado R, Thorne H, consortium k, Poliness C, Nightingale S, Teo S, Speed T, Visvader J, Neeson P, Darcy P, Mackay L, Loi S | 2025 | Nature | Immuno-oncology | Spatial Analysis, Highplex FL | HALO |
| Spatial immune profiling defines a subset of human gliomas with functional tertiary lymphoid structures | Cakmak P, Lun J, Singh A, Macas J, Schupp J, Schuck J, Mahmoud Z, Köhler M, Starzetz T, Burger M, Steidl E, Hasse L, Hattingen E, Plate K, Reiss Y, Imkeller K | 2025 | Immunity | Immuno-oncology | Spatial Analysis, Highplex FL | HALO |
| Smohaze-Upregulated RFWD3 Competes with TRIM24 to Stabilize TREX1 and Reduce Cytosolic dsDNA in Non-Small Cell Lung Cancer | Shi X, Shen Y, Lv M, Sun Y, Lin Y, Wang Z, Jie X, Liu Z, Liu Y, Fu Y, Ren Z, Wang G, Zhou G | 2025 | Advanced Science | Oncology | Spatial Analysis, Highplex FL | HALO |
| Adjuvant nivolumab and relatlimab in stage III/IV melanoma: the randomized phase 3 RELATIVITY-098 trial | Long G, Garnett-Benson C, Dolfi S, Ascierto P, Guo J, Tarhini A, Chandra S, Muñoz-Couselo E, Del Vecchio M, de Melo A, Callahan M, Gogas H, Dummer R, Schadendorf D, Koelblinger P, Quereux G, Thomas I, Yu J, Fisher A, Wang B, Djidel P, Chouzy A, Semaan M, Chen B, Cheong A, Tawbi H | 2025 | Nature Medicine | Immuno-oncology | Highplex FL | HALO, HALO AI |
| αTIGIT-IL2 achieves tumor regression by promoting tumor-infiltrating regulatory T cell fragility in mouse models | Wang T, Xu Y, Zhang Z, Wu Y, Chen L, Zheng X, Peng H, Zou Q, Sun R, Ma H, Sun H, Tian Z, Zheng X | 2025 | Nature Communications | Immuno-oncology | Highplex FL | HALO |
| Mesenchymal stromal cells induce neutrophil aggregation and extracellular vesicle storms for systemic lupus erythematosus | Ou Q, Niu L, Wang D, Yao G, Ren Q, Li Z, Mao X, Teng W, Chen Z, Xiang A, Shi S, Sun L | 2025 | Signal Transduction and Targeted Therapy | Immunology | Multiplex IHC, TMA | HALO |
| Tonic type I interferon signaling optimizes the antiviral function of plasmacytoid dendritic cells | Pucella J, Maqueda-Alfaro R, Ni H, Sulczewski F, Eichinger A, Esteva E, Ra A, Das A, Perez O, Feng J, Stoeckius M, Smibert P, Khodadadi-Jamayran A, Dolgalev I, Ivanova E, Sota S, Cadwell K, Koralov S, Zhong J, Soni C, Stetson D, Weisberg S, Farber D, Idoyaga J, Reizis B | 2025 | Nature Immunology | Immunology | Highplex FL | HALO |
| Age-related severity of nontuberculous mycobacterial lung disease is mediated by aberrant macrophage responses and lung microbial dysbiosis | Napier E, Doratt B, Cinco I, Stuart E, Geron R, Davies M, Malherbe D, Kohama S, Bermudez L, Winthrop K, Fuss C, Spindel E, Messaoudi I | 2025 | Journal of Infection | Infectious Disease | Highplex FL | HALO |
| Extracellular vesicles derived EBV tegument protein BRRF2 suppresses cGAS phase separation to promote anti-viral innate immune evasion | Hu Z, Li Z, Wang Y, Luo Y, Guo W, Meng N, Bu G, Zhang L, Li S, Kong X, Fang X, Wang Q, Han R, Zhao Z, Zhao G, Jiang Z, Jin R, Zeng M, Zhong Q | 2025 | Nature Communications | Infectious Disease | Spatial Analysis, Highplex FL | HALO |
| Signal Amplification for Fluorescent Staining of Single Particles in Liquid Biopsies: Circulating Tumour Cells and Extracellular Vesicles | Cavallaro S, Veiga S, Ahmad R, Aldikacti B, Bienstock M, Capen D, Rabe D, Ho U, Lee D, Ruiz-Torres D, Wakimoto H, Dietrich J, Nahed B, Stott S | 2025 | Journal of Extracellular Vesicles | Other | Highplex FL | HALO, HALO AI |
| Peripheral nerve injury-induced remodeling of the tumor-associated macrophages promotes immune evasion in breast cancer | Jiang Y, Zeng W, Feng Y, Deng X, Wang J, Liu H, Gao B, Bi D, Liu Z, Yang C, Chen M, Li T, Chen H, Zhang Y, Liang L, Xu J, Deng W, Yao Z, Wu W, Lao L, Chen J, Huang P | 2025 | Journal of Experimental & Clinical Cancer Research | Immuno-oncology | Object Colocalization | HALO |
| SFPQ-TFE3 reciprocally regulates mTORC1 and induces lineage plasticity in a mouse model of renal tumorigenesis | Kaushal Asrani, Adrianna Amaral, Juhyung Woo, Sanaz Nourmohammadi Abadchi, Thiago Vidotto, Eddie Imada, Alyza Skaist, Kewen Feng, Hans B. Liu, Mithila Kasbe, Yorifumi Satou, Masaya Baba, Yuichi Oike, Patricia Outeda, Terry Watnick, Avi Z. Rosenberg, Laura S. Schmidt, W. Marston Linehan, Pedram Argani & Tamara L. Lotan | 2025 | Nature Communications | Oncology | Classifier, Cytonuclear | HALO |
| Microglial glycolytic reprogramming in alzheimer’s disease: association with impaired phagocytic function and altered vascular proximity | Lu N, Jin Z, Liu N, Zhu C, Wei H, Xu Q | 2025 | Journal of Neuroinflammation | Neuroscience | Object Colocalization, Highplex FL | HALO |
| Characterizing the Immune Response in Pig-to-Human Heart Xenografts Using a Multimodal Diagnostic System | Giarraputo A, Morgand E, Stern J, Mezine F, Coutance G, Goutaudier V, Sannier A, Certain A, Hauet T, Giraud S, Kerforne T, Allain G, Ayares D, Khalil K, Kim J, Mehta S, Narula N, Reyentovich A, Smith D, Tissier R, Saraon T, Kadosh B, Divita M, Goldberg R, Pass H, Mangiola M, Bruneval P, Griesemer A, Moazami N, Montgomery R, Loupy A | 2025 | Circulation | Immunology | Highplex FL | HALO, HALO AI |
| Dissection of immunotherapeutic predictive versus prognostic transcriptional programs identifies SLC22A5-centric carnitine metabolism-driven resistance to anti-PD-(L)1 treatment in non-small cell lung cancer | Wang Y, Gao N, Lin Z, Wang S, Ai S, Wei Z, Zhang S, Cai J, Yang W, Ma S, Cheng C | 2025 | Drug Resistance Updates | Immuno-oncology | Multiplex IHC | HALO |
| Antibody-gamma/delta T cell receptors targeting GPC2 regress neuroblastoma with low antigen density | Quan A, Huo M, Li D, Hutchins L, Rodriguez C, Oh J, Tsao H, Spetz M, Edmondson E, Ashworth D, Zheng R, Zhou J, Chen J, Liu J, Xiong G, Zhang H, Liu C, Nguyen R, Li N, Ho M | 2025 | Cell Reports Medicine | Immuno-oncology | Multiplex IHC | HALO |
| Sex differences in atrial fibrillation-related atrial remodelling assessed by electroanatomic mapping and biopsy | Nakashima K, Yamaguchi T, Takahashi Y, Otsubo T, Shichida S, Osako R, Shinzato K, Tsuruta K, Nishimura Y, Edayoshi M, Kawano Y, Shintani-Domoto Y, Miyazaki K, Fukui A, Kawaguchi A, Aoki S, Nomura S, Takahashi N, Soejima K, Ito K, Node K | 2025 | European Heart Journal | Other | Area Quantification | HALO |
| High Treg and PMN-MDSC densities are a hallmark of tertiary lymphoid structures in fatal cases of cervical cancer | Syding L, Plačková K, Pavelková L, Aquino-Perez C, Santegoets S, Laco J, Grega M, Dundr P, Němejcová K, Hodek M, Bouček J, Zábrodský M, Vošmiková H, Halaška M, Rob L, Čelakovský P, Chrobok V, Iheme M, Práznovec I, Vošmik M, Katina S, Cibula D, Ryška A, van der Burg S, Špíšek R, Fialová A | 2025 | Journal for Immunotherapy of Cancer | Immuno-oncology | Multiplex IHC, Highplex FL | HALO |
| CCL5hi Macrophages Interact with CD8+ T Cells and Potentiate Responsiveness to PD-1 Blockade Plus Chemotherapy in Esophageal Squamous Cell Carcinoma | Ma Y, Su X, Zeng T, Zhou C, Yang G, Xia Z, Zeng C, Zhan J, Guan X, Zhang X, Li Y | 2025 | Advanced Science | Immuno-oncology | Spatial Analysis, Highplex FL | HALO |
| Tertiary lymphoid structures in Merkel cell carcinoma facilitate naïve and central memory T-cell infiltration linked to immunotherapy response | Srinivas N, Spassova I, Lei K, Gao J, Pino M, Giglio G, Kitanovski S, Dalkoohi M, Livingstone E, Leiter U, Mohr P, Gambichler T, Stoffels I, Ugurel S, Cheung P, Engblom C, Lui W, Becker J | 2025 | Journal for Immunotherapy of Cancer | Immuno-oncology | Spatial Analysis, Highplex FL | HALO |
| Autophagy inhibition improves the efficacy of anlotinib and PD-1 inhibitors in the treatment of NSCLC | Tang H, You T, Ge H, Bai C, Wang Y, Sun Z, Han Q, Zhao RC | 2025 | Journal for Immunotherapy of Cancer | Oncology | Multiplex IHC, Highplex FL | HALO |
| Repeated head trauma causes neuron loss and inflammation in young athletes | Butler M, Pervaiz N, Breen K, Calderazzo S, Ypsilantis P, Wang Y, Cammasola Breda J, Mazzilli S, Nicks R, Spurlock E, Hefti M, Fiock K, Huber B, Alvarez V, Stein T, Campbell J, McKee A, Cherry J | 2025 | Nature | Neuroscience | Object Colocalization, FISH, Spatial Analysis, Highplex FL, FISH-IF | HALO, HALO AI |
| Live biotherapeutic enterococcus lactis MNC-168 promotes the efficacy of immune checkpoint blockade in cancer therapy by activating STING pathway via bacterial membrane vesicles | Xian Y, Chen Z, Zhou L, Zhang C, Sun H, Liu Z, Kong P, Liang Y, Zhao Y, Liu S, Zhou Y, Gan L, Li B, Su X, Huang B, Chen X, Zhu R, Zhao G, Lao C, Lin C, Zhang D, Jiang X | 2025 | Gut Microbes | Immuno-oncology | Multiplex IHC | HALO |
| Gene Signature-Based Drug Screening Reveals Ponatinib Enhances Immunotherapy Efficacy in Triple-Negative Breast Cancer by Reversing MDSC-Mediated Immunosuppressive Tumor Microenvironment | Wang Q, Li S, Wu Y, Yu X, Dai Y, Wang Y, Li L, Yang M, Lin K, Shao W, Wang H, Wang H, Zhang G, Wang D | 2025 | Research | Immuno-oncology | Multiplex IHC | HALO |
| Down syndrome and a presenilin 2 variant: dual genetic risk of Alzheimer’s disease | Ogg J, Postupna N, Gibbons L E, Ariza J, Xiao M, Fonseca L M, Jayadev S, Keene C D, Bird T D, Latimer C S | 2025 | Acta Neuropathologica | Neuroscience | Area Quantification | HALO, HALO AI |
| Supplementing HIV-ART with cannabinoids increases serotonin, BHB, and Ahr signaling while reducing secondary bile acids and acylcholines | Premadasa LS, Romero L, Mohan M | 2025 | Science Advances | Other | Area Quantification | HALO |
| Simultaneous STING and lymphotoxin-β receptor activation induces B cell responses in tertiary lymphoid structures to potentiate antitumor immunity | Sawada J, Kikuchi Y, Duah M, Herrera J, Kanamori F, Csomos K, Stansel T, Hiraoka N, Yoshida M, Walter J, Ware C, Komatsu M | 2025 | Nature Immunology | Immuno-oncology | Cytonuclear | HALO |
| AAV delivery of artificial miRNA targeting MAPT for the reduction of tau pathology in Alzheimer's disease | Hogestyn J, Wischhof E, Chen Y, Chan T, Richards B, Mahendran T, Adams J, Dubreuil D, Bu J, Jackson R, Goulet M, Mueller C, Ramachandran S, Elmer B | 2025 | Molecular Therapy | Neuroscience | Area Quantification | HALO |
| Steroid-dependent metabolic rewiring reveals novel therapeutic and imaging approaches for glioblastoma | Allega M, Deshmukh R, Hillinger T, Akhmetshina A, Oudin A, Bielik R, Soloviev D, Villar V, Ackermann T, Bourmeau G, Chahal S, Stevenson K, Nixon C, Shaw R, Morrison G, Chalmers A, Pollard S, Lund-Johansen M, Bjerkvig R, Seano G, Niclou S, Vik-Mo E, Lewis D, Sumpton D, Tardito S | 2025 | Science Advances | Oncology | Multiplex IHC | HALO |
| AAK1 activation-mediated iron trafficking drives ferroptotic cell death | Li L, Ye Z, Xiao Y, Zhu X, Li Q, Guo Y, Wu H, Li Z, Wu L, Chen Y, Feng G, Yang D, Liu S, Hu B, Tang J, Zhou Y, Li J, Deng R, Zhang H, Zhu X | 2025 | Nature Communications | Other | Multiplex IHC | HALO |
| Uncovering the signatures of aging and senescence in the human dorsolateral prefrontal cortex | Sloan N, Mares J, Daly A, Grier S, Haq I, Jackson C, Barretto N, Casel O, Kang K, Khiste S, Harris K, Eschbach J, Fullerton B, Mattison C, Gebremedhin B, Petrescu J, Coie L, Hauge Pedersen M, Zhang K, Shu J, Teich A, Reddy H, Smith C, Suh Y, Menon V, Phatnani H | 2026 | Cell Genomics | Neuroscience | Highplex FL | HALO, HALO AI |
| Marked expansion of exocrine and endocrine pancreas with incretin therapy in humans with increased exocrine pancreas dysplasia and potential for glucagon-producing neuroendocrine tumors | Butler AE, Campbell-Thompson M, Gurlo T, Dawson DW, Atkinson M, Butler PC | 2013 | Diabetes | Oncology, Metabolism | Cytonuclear | HALO |
| ANGPTL8/betatrophin does not control pancreatic beta cell expansion | Gusarova V, Alexa CA, Na E, Stevis PE, Xin Y, Bonner-Weir S, Cohen JC, Hobbs HH, Murphy AJ, Yancopoulos GD, Gromada J | 2014 | Cell | Metabolism | Area Quantification | HALO |
| Characterization of the exocrine pancreas in the male Zucker diabetic fatty rat model of type 2 diabetes mellitus following 3 months of treatment with sitagliptin | Forest T, Holder D, Smith A, Cunningham C, Yao X, Dey M, Frederick C, Prahalada S | 2014 | Endocrinology | Metabolism | Cytonuclear | HALO |
| Islet-1 is essential for pancreatic β-cell function | Ediger BN, Du A, Liu J, Hunter CS, Walp ER, Schug J, Kaestner KH, Stein R, Stoffers DA, May CL | 2014 | Diabetes | Metabolism | Cytonuclear | HALO |
| PD-1 blockade induces responses by inhibiting adaptive immune resistance | Tumeh PC, Harview CL, Yearley JH, Shintaku IP, Taylor EJM, Robert L, Chmielowski B, Spasic M, Henry G, Ciobanu V, West AN, Carmona M, Kivork C, Seja E, Cherry G, Gutierrez A, Grogan TR, Mateus C, Tomasic G, Glaspy JA, Emerson RO, Robins H, Pierce RH, Elas | 2014 | Nature | Oncology, Immuno-oncology | Cytonuclear | HALO |
| Peripheral androgen receptor gene suppression rescues disease in mouse models of spinal and bulbar muscular atrophy | Lieberman AP, Yu Z, Murray S, Peralta R, Low A, Guo S, Yu XX, Cortes CJ, Bennett CF, Monia BP, La Spada AR, Hung G | 2014 | Cell Reports | Myology | Muscle Fiber | HALO |
| Applicability of digital analysis and imaging technology in neuropathology assessment | Dunn WD, Gearing M, Park Y, Zhang L, Hanfelt J, Glass JD, Gutman DA | 2015 | Neuropathology | Neuroscience | HALO | |
| A combined oral contraceptive affects mucosal SHIV susceptibility factors in a pigtail macaque (Macaca nemestrina) model | Ostergaard DS, Butler K, Ritter JM, Johnson R, Sanders J, Powell N, Lathrop G, Zaki SR, McNicholl JM, Kersh EN | 2015 | Journal of medical primatology | Infectious Disease | HALO | |
| Analysis of putative mucosal SHIV susceptibility factors during repeated DMPA treatments in pigtail macaques | Butler K, Ritter J, Ellis S, Henning TR, Montague J, Zaki S, Garber, McNicholl JM, Kersh EN | 2015 | Journal of medical primatology | Infectious Disease | HALO | |
| Glucagon Receptor Blockade With a Human Antibody Normalizes Blood Glucose in Diabetic Mice and Monkeys | Okamoto H, Kim J, Aglione JP, Lee J, Cavino K, Na E, Rafique A, Kim JH, Harp J, Valenzuela DM, Yancopoulos GD, Murphy AJ, Gromada J | 2015 | Endocrinology | Metabolism | Area Quantification | HALO |
| G-protein-independent coupling of MC4R to Kir7. 1 in hypothalamic neurons | Ghamari-Langroudi M, Digby GJ, Sebag JA, Millhauser GL, Palomino R, Matthews R, Gillyard T, Panaro BL, Tough IR, Cox HM, Denton JS, Cone RD | 2015 | Nature | Metabolism | ISH/FISH | HALO |
| Combination therapy reverses hyperglycemia in NOD mice with established type 1 diabetes | Xue S, Posgai A, Wasserfall C, Myhr C, Campbell-Thompson M, Mathews CE, Brusko T, Rabinovitch A, Savinov A, Battaglia M, Schatz D, Haller M, Atkinson MA | 2015 | Diabetes | Metabolism | Cytonuclear | HALO |
| Myostatin blockade with a fully human monoclonal antibody induces muscle hypertrophy and reverses muscle atrophy in young and aged mice | Latres E, Pangilinan J, Miloscio L, Bauerlein R, Na E, Potocky TB, Huang Y, Eckersdorff M, Rafique A, Mastaitis J, Lin C, Murphy AJ, Yancopoulos GD, Gromada J, Stitt T | 2015 | Skeletal Muscle | Myology | Muscle Fiber | HALO |
| Nerve fibers infiltrate the tumor microenvironment and are associated with nerve growth factor production and lymph node invasion in breast cancer | Pundavela J, Roselli S, Faulkner S, Attia J, Scott RJ, Thorne RF, Forbes JF, Bradshaw RA, Walker MM, Jobling P, Hondermarck H | 2015 | Molecular Oncology | Oncology, Neuroscience | Area Quantification | HALO |
| Semi-Automated Digital Image Analysis of Pick’s Disease and TDP-43 Proteinopathy | Irwin DJ, Byrne MD, McMillan CT, Cooper F, Arnold SE, Lee EB, Van Deerlin VM, Xie SX, Lee VM, Grossman M, Trojanowski JQ | 2015 | Journal of Histochemistry & Cytochemistry | Neuroscience | Object Colocalization | HALO |
| Phenotyping of tumor-associated macrophages in colorectal cancer: impact on single cell invasion (tumor budding) and clinicopathological outcome | Koelzer VH, Canonica K, Dawson H, Sokol L, Karamitopoulou-Diamantis E, Lugli A, Zlobec I | 2015 | OncoImmunology | Oncology, Immuno-oncology, Gastroenterology | Cytonuclear | HALO |
| Relationship of Estimated SHIV Acquisition Time Points During the Menstrual Cycle and Thinning of Vaginal Epithelial Layers in Pigtail Macaques | Kersh EN, Ritter J, Butler K, Ostergaard SD, Hanson D, Ellis S, Zaki S, McNicholl JM | 2015 | Sexually Transmitted Diseases | Infectious Disease | HALO | |
| Tasquinimod triggers an early change in the polarization of tumor associated macrophages in the tumor microenvironment | Olsson A, Nakhle J, Sundstedt A, Plas P, Bauchet AL, Pierron V, Bruetschy L, Deronic A, Tomgren M, Liberg D, Schmidlin F, Leanderson T | 2015 | Journal for ImmunoTherapy of Cancer | Oncology, Immuno-oncology | Cytonuclear | HALO |
| Exacerbated experimental colitis in TNFAIP8-deficient mice | Sun H, Lou Y, Porturas T, Morrissey S, Luo G, Qi J, Ruan Q, Shi S, Chen YH | 2015 | The Journal of Immunology | Gastroenterology | Cytonuclear | HALO |
| The PDE10A inhibitor MP-10 and haloperidol produce distinct gene expression profiles in the striatum and influence cataleptic behavior in rodents | Gentzel RC, Toolan D, Roberts R, Koser AJ, Kandebo M, Hershey J, Renger JJ, Uslaner J, Smith SM | 2015 | Neuropharmacology | Neuroscience | Cytonuclear | HALO |
| Variability in Platelet-Derived Growth Factor Receptor Alpha Antibody Specificity May Impact Clinical Utility of Immunohistochemistry Assays | Holzer TR, Reising LO, Credille KM, Schade AE, Oakley | 2016 | Journal of Histochemistry & Cytochemistry | Oncology | Cytonuclear, ISH/FISH | HALO |
| A Depot Medroxyprogesterone Acetate Dose That Modes Human Use and Its Effect on Vaginal SHIV Acquisition Risk | Butler K, Ritter JM, Ellis S, Morris MR, Hanson DL, McNicholl JM, Kersh EN | 2016 | JAIDS: Journal of Acquired Immune Deficiency Syndromes | Infectious Disease | HALO | |
| A Phase II Trial of Dovitinib in BCD-Unresponsive Urothelial Carcinoma with FGFR3 Mutations or Over-Expression: Hoosier Cancer Research Network Trial HCRN 12-157 | Hahn NH, Bivalacqua TJ, Ross AE, Netto GJ, Baras AS, Park JC, Chapman C, Masterson TA, Koch MO, Bihrle R, Foster RS, Gardner TA, Cheng L, Jones DR, Kyle McElyea K, Sandusky GE, Breen T, Liu Z, Albany C, Moore ML, Loman RA, Reed A, Turner SA, de Abreu FB, Gallagher TL, Tsongalis GJ, Plimack ER, Greenberg RE, Geynisman DM | 2016 | Clinical Cancer Research | Oncology | Classifier, Cytonuclear | HALO |
| Bimodality of intratumor Ki67 expression is an independent prognostic factor of overall survival in patients with invasive breast carcinoma | Laurinavicius A, Plancoulaine B, Rasmusson A, Besusparis J, Augulis R, Meskauskas R, Herlin P, Laurinaviciene A, Muftah AAA, Miligy I, Aleskandarany M, Rakha EA, Green AR, Ellis IO | 2016 | Virchows Archiv | Oncology | Classifier, Cytonuclear | HALO |
| Cerebral Protection During MitraClip Implantation: Initial Experience at 2 Centers | Frerker C, Schlüter M, Sanchez OD, Reith S, Romero ME, Ladich E, Schröder J, Schmidt T, Kreidel F, Joner M | 2016 | JACC: Cardiovascular Interventions | Myology | Object Colocalization | HALO |
| Control of mitochondrial function and cell growth by the atypical cadherin Fat1 | Cao LL, Riascos-Bernal DF, Chinnasamy P, Dunaway CM, Hou R, Pujato MA, O'Rourke BP, Miskolci V, Guo L, Hodgson L, Fiser A, Sibinga NES | 2016 | Nature | Metabolism | Cytonuclear | HALO |
| Cutaneous wound healing through paradoxical MAPK activation by BRAF inhibitors | Escuin-Ordinas H, Li S, Xie MW, Sun L, Hugo W, Huang RR, Jiao J, Meira de-Faria F, Realegeno S, Krystofinski P, Azhdam A, Komenan SMD, Atefi M, Comin-Anduix B, Pellegrini M, Cochran AJ, Modlin RL, HerschmanHR, Lo RS, McBride WH, Segura T, Ribas A | 2016 | Nature Communications | Other | Cytonuclear | HALO |
| Development of antibody-siRNA conjugate targeted to cardiac and skeletal muscles | Sugo T, Terada M, Oikawa T, Miyata K, Nishimura S, Kenjo E, Ogasawara-Shimizu M, Makita Y, Imaichi S, Murata S, Kentaro Otaka, Kikuchi K, Teratani M, Masuda Y, Kamei T, Takagahara S, Ikeda S, Ohtaki T, Matsumoto H | 2016 | The Journal of Controlled Release | Myology | Cytonuclear, Muscle Fiber | HALO |
| Differential Cytokine Gene Expression in Granulomas from Lungs and Lymph Nodes of Cattle Experimentally Infected with Aerosolized Mycobacterium bovis | Palmer MV, Thacker TC, Waters WR | 2016 | PLOS One | Infectious Disease | ISH/FISH | HALO |
| Epigenetic regulation of the thioredoxin-interacting protein (TXNIP) gene by hyperglycemia in kidney | De Marinis Y, Cai M, Bompada P, Atac D, Kotova O, Johansson ME, Garcia-Vaz E, Gomez MF, Laakso M, Groop L | 2016 | Kidney International | Metabolism | Area Quantification | HALO |
| Evaluation of the brain-penetrant microtubule-stabilizing agent, dictyostatin, in the PS19 tau transgenic mouse model of tauopathy | Makani V, Zhang B, Han H, Yao Y, Lassalas P, Lou K, Paterson I, Lee VMY, Trojanowski JQ, Ballatore C, Smith AB, Brunden KR | 2016 | Acta Neuropatholgica Communications | Neuroscience | Area Quantification | HALO |
| Leptin, BMI, and a Metabolic Gene Expression Signature Associated with Clinical Outcome to VEGF Inhibition in Colorectal Cancer | Pommier AJC, Farren M, Patel B, Wappett M, Michopoulos F, Smith NR, Kendrew J, Frith J, Huby R, Eberlein C, Campbell H, Womack C, Smith PD, Robertson J, Morgan S, Critchlow SE, Barry ST | 2016 | Cell Metabolism | Oncology, Metabolism, Gastroenterology | Area Quantification | HALO |
| Fully automated RNAscope in situ hybridization assays for formalin‐fixed paraffin‐embedded cells and tissues | Anderson CM, Zhang B, Miller M, Butko E, Wu X, Laver T, Kernag C, Kim J, Luo Y, Lamparski H | 2016 | Journal of Cellular Biochemistry | Oncology, Gastroenterology, Infectious Disease | ISH/FISH | HALO |
| Mitogen-activated Protein Kinase Kinase Activity Maintains Acinar-to-Ductal Metaplasia and Is Required for Organ Regeneration in Pancreatitis | Halbrook CJ, Wen H-J, Ruggeri JM, Takuchi KK, Zhang Y, di Magliano MP, Crawford HC | 2016 | Cellular and Molecular Gastroenterology and Hepatology | Immunology, Gastroenterology | Cytonuclear | HALO |
| Intrathecal Administration of AAV/GALC Vectors in 10- 11-Day-Old Twitcher Mice Improves Survival and Is Enhanced by Bone Marrow Transplant | Karmuthil-Melethil S, Marshall MS, Heindel C, Jakubauskas B, Bongarzone ER, Gray SJ | 2016 | Journal of Neuroscience Research | Neuroscience | Axon | HALO |
| KS-Detect-Validation of Solar Thermal PCR for the Diagnosis of Kaposi's Sarcoma Using Pseudo-Biopsy Samples | Snodgrass R, Gardner A, Jiang L, Fu C, Cesarman E, Erickson D | 2016 | PLOS ONE | Oncology | Cytonuclear | HALO |
| Comparison of the methods for measuring the Ki-67 labeling index in adrenocortical carcinoma: manual versus digital image analysis | Yamazaki Y, Nakamura Y, Shibahara Y, Konosu-Fukaya S, Sato N, Kubota-Nakayama F, Oki Y, Baba S, Midorikawa S, Morimoto R, Satoh F, Sasano | 2016 | Human Pathology | Oncology | Cytonuclear | HALO |
| Mutations Associated with Acquired Resistance to PD-1 Blockade in Melanoma | Zaretsky JM, Garcia-Diaz A, Shin DS, Escuin-Ordinas H, Hugo W, Hu-Lieskovan S, Torrejon DY, Abril-Rodriguez G, Sandoval S, Barthly L, Saco J, Homet Moreno BH, Mezzadra R, Chmielowski B, Ruchalski K, Shintaku IP, Sanchez PJ, Puig-Saus C, Cherry G, Seja E, Kong X, Pang J, Berent-Maoz B, Comin-Anduix B, Graeber TG, Tumeh PC, Schumacher TNM, Lo RS, Ribas A | 2016 | The New England Journal of Medicine | Oncology, Immuno-oncology | Cytonuclear | HALO |
| Phosphorylation of calcium/calmodulin-stimulated protein kinase II at T286 enhances invasion and migration of human breast cancer cells | Chi M, Evans, Gilchrist J, Mayhew J, Hoffman A, Pearsall EA, Jankowski H, Brzozowski JS, Skelding KA | 2016 | Scientific Reports | Oncology | Cytonuclear | HALO |
| Primary resistance to PD-1 blockade mediated by JAK1/2 mutations | Shin DS, Zaretsky JM, Escuin-Ordinas H, Garcia-Diaz A, Hu-Lieskovan S, Kalbasi A, Grasso CS, Hugo W, Sandoval S, Torrejon DY, Palaskas N, Rodriguez GA, Parisi G, Azhdam A, Chmielowski B, Cherry G, Seja E, Berent-Maoz B, Shintaku IP, Le DT, Pardol DM, Diaz LA, Tumeh PC, Graeber TG, Lo RS, Comin-Anduix B, Ribas A | 2016 | Cancer Discovery | Oncology, Immuno-oncology | Cytonuclear | HALO |
| CNS-accessible inhibitor of glucosylceramide synthase for substrate reduction therapy of neuronopathic Gaucher disease | Marshall J, Sun Y, Bangari DS, Budman E, Park H, Nietupski JB, Allaire A, Cromwell MA, Wang B, Grabowski GA, Leonard JP, Cheng SH | 2016 | Molecular Therapy | Neuroscience | Area Quantification | HALO |
| ProNGF is a potential diagnostic biomarker for thyroid cancer | Faulkner S, Roselli S, Demont Y, Pundavela J, Choquet G, Leissner P, Oldmeadow C, Attia J, Walker MM, Hondermarck H | 2016 | Oncotarget | Oncology | Area Quantification | HALO |
| Resistance to Anti-VEGF Therapy Mediated by Autocrine IL6/STAT3 Signaling and Overcome by IL6 Blockade | Eichten A, Su J, Adler AP, Zhang L, Ioffe E, Parveen AA, Yancopoulos GD, Rudge J, Lowy I, Lin HC, MacDonald D, Daly C, Duan X, Thurston G | 2016 | Cancer Research | Oncology, Immuno-oncology | Cytonuclear, Object Colocalization | HALO |
| Synergistic targeted inhibition of MEK and dual PI3K/mTOR diminishes viability and inhibits tumor growth of canine melanoma underscoring its utility as a preclinical model for human mucosal melanoma | Wei B-R, Michael HT, Hasley CHC, Peer CJ, Adhikari A, Dwyer JE, Hoover SB, El Meskini R, Kozlov S, Ohler ZW, Figg WD, Merlino G, Simpson RM | 2016 | Pigment Cell & Melanoma Research | Oncology | Area Quantification | HALO |
| Single-Cell RNAseq Reveals That Pancreatic β-Cells From Very Old Male Mice Have a Young Gene Signature | Xin Y, Kim J, Okamoto H, Ni M, Wei Y, Adler C, Murphy AJ, Yancopoulos GD, Lin C, Gromada J | 2016 | Endocrinology | Metabolism | Islet | HALO |
| Solid-state NMR structure of a pathogenic fibril of full-length human [alpha]-synuclein | Tuttle MD, Comellas G, Nieuwkoop AJ, Covell DJ, Berthold DA, Kloepper KD, Courtney JM, Kim JK, Barclay AM, Kendall A, Wan W, Stubbs G, Schwieters CD, Lee VMY, George JM, Rienstra CM | 2016 | Structural & Molecular Biology | Neuroscience | Area Quantification | HALO |
| Tasquinimod modulates tumor-infiltrating myeloid cells and improves the antitumor immune response to PD-L1 blockade in bladder cancer | Nakhlé J, Pierron V, Bauchet A-L, Plas P, Thiongane A, Meyer-Losic F, Schmidlin F | 2016 | OncoImmunology | Oncology, Immuno-oncology | Cytonuclear | HALO |
| Evidence of β-Cell Dedifferentiation in Human Type 2 Diabetes | Cinti F, Bouchi R, Kim-Muller JY, Ohmura Y, Sandoval PR, Masini M, Marselli L, Suleiman M, Ratner LE, Marchetti P, Accili D | 2016 | The Journal of Clinical Endocrinology & Metabolism | Metabolism | Cytonuclear | HALO |
| The Dynamics and Turnover of Tau Aggregates in Cultured Cells: Insights into Therapies for Tauopathies | Guo JL, Buist A, Soares A, Callaerts K, Calafate S, Stevenaert F, Daniels JP, Zoll BE, Crowe A, Brunden KR, Moechars D, Lee VMY | 2016 | The Journal of Biological Chemistry | Neuroscience | Area Quantification | HALO |
| The Prognostic Impact of NK/NKT Cell Density in Periampullary Adenocarcinoma Differs by Morphological Type and Adjuvant Treatment | Lundgren S, Warfvinge CF, Elebro J, Heby M, Nodin B, Krzyzanowska A, Bjartell A, Leandersson K, Eberhard J, Jirstrom K | 2016 | PLOS ONE | Oncology, Immuno-oncology | Object Colocalization | HALO |
| Unique pathological tau conformers from Alzheimer's brains transmit tau pathology in nontransgenic mice | Guo JL, Narasimhan S, Changolkar L, He Z, Stieber Z, Zhang B, Gathagan RJ, Iba M, McBride JD, Trojanowski JQ, Lee VMY | 2016 | Journal of Experimental Medicine | Neuroscience | Area Quantification | HALO |
| Upregulation of Glucose-Regulated Protein 78 in Metastatic Cancer Cells Is Necessary for Lung Metastasis Progression | Lizardo MM, Morrow JJ, Miller TE, Hong ES, Ren L, Mendoza A, Halsey CH, Scacheri PC, Helman LJ, Khanna C | 2016 | Neoplasia | Oncology | Cytonuclear | HALO |
| Use of the Fluidigm C1 platform for RNA sequencing of single mouse pancreatic islet cells | Xin Y, Kim J, Ni M, Wei Y, Okamoto H, Lee J, Adler C, Cavino K, Murphy AJ, Yancopoulos GD, Lin HC, Gromada J | 2016 | Proceedings of the National Academy of Sciences | Metabolism | Cytonuclear | HALO |
| Qualitative Comparison Between Carrier-based and Classical Tissue Microarrays | Lisenko K, Leichsenring J, Zgorzelski C, Longuespee R, Casadonte R, Harms A, Kazdal D, Stenzinger A, Warth A, Kriegsmann M | 2017 | Applied Immunohistochemistry & Molecular Morpholgy | Other | HALO | |
| Obstruction of BRAFV600E transcription by complementary PNA oligomers as a means to inhibit BRAF-mutant melanoma growth | Rothman JH, Surriga O, de Stanchina E, Vasudeva SD, Schwartz GK | 2017 | Cancer Gene Therapy | Oncology | HALO | |
| Cysteinyl leukotriene receptor 1 facilitates tumorigenesis in a mouse model of colitis-associated colon cancer | Osman J, Savari S, Chandrashekar NK, Bellamkonda K, Souglas D, Sjolander A | 2017 | Oncotarget | Oncology, Immunology | Classifier, Area Quantification | HALO |
| Ki67 reproducibility using digital image analysis: an inter-platform and inter-operator study | Acs B, Pelekanou V, Bai Y, Martinez-Morilla S, Toki M, Leung SCY, Nielsen TO, Rimm DL | 2017 | Laboratory Investigations | Oncology | Classifier, Cytonuclear | HALO |
| The integrative clinical impact of tumor-infiltrating T lymphocytes and NK cells in relation to B lymphocyte and plasma cell density in esophageal and gastric adenocarcinoma | Svensson MC, Warfvinge CF, Fristedt R, Hedner C, Borg D, Eberhard J, Micke P, Nodin B, Leandersson K, Jirstrom K | 2017 | Oncotarget | Immuno-oncology | Object Colocalization | HALO |
| A randomized, open-label study of the efficacy and safety of AZD4547 monotherapy versus paclitaxel for the treatment of advanced gastric adenocarcinoma with FGFR2 polysomy or gene amplification | Van Cutsem E, Bang Y-J, Mansoor W, Petty RD, Chao Y, Cunningham D, Ferry DR, N. R. Smith NR, Frewer P, Ratnayake J, Stockman PK, Kilgour E, and Landers D | 2017 | Annals of Oncology | Oncology | Classifier, ISH/FISH | HALO |
| A single dose of peripherally infused EGFRvIII-directed CAR T cells mediates antigen loss and induces adaptive resistance in patients with recurrent glioblastoma | O’Rourke DM, Nasrallah MP, Desai A, Melenhorst JJ, Mansfield K, MorrissetteJJD, Martinez-Lage M, Brem S, Maloney E, Shen A, Isaacs R, Mohan S, Plesa G, Lacey SF, Navenot J-M, Zheng Z, Levine BL, Okada H, June CH, Brogdon JL, Maus MV | 2017 | Science Translational Medicine | Oncology, Immuno-oncology | Cytonuclear, Multiplex IHC | HALO |
| Acetate Recapturing by Nuclear Acetyl-CoA Synthetase 2 Prevents Loss of Histone Acetylation during Oxygen and Serum Limitation | Bulusu V, Tumanov S, Michalopoulou E, van den Broek NJ, MacKay G, Nixon C, Dhayade S, Schug ZT, Voorde JV, Blyth K, Gottlieb E, Vazquez A, Kamphorst JJ | 2017 | Cell Reports | Oncology, Metabolism | Cytonuclear | HALO |
| Aging African green monkeys manifest transcriptional, pathological, and cognitive hallmarks of human Alzheimer’s disease | Cramer PE, Gentzel RC, Tanis KQ, Vardigan J, Wang Y, Connolly B, Manfre P, Lodge K, Renger JJ, Zerbinatti C, Uslaner JM | 2017 | Neurobiology of Aging | Neuroscience | Object Colocalization | HALO |
| Amino Acid Transporter Slc38a5 Controls Glucagon Receptor Inhibition-Induced Pancreatic α Cell Hyperplasia in Mice | Kim J, Okamoto H, Huang ZJ, Anguiano G, Chen S, Liu Q, Cavino K, Xin Y, Na E, Hamid R, Lee J, Zambrowicz B, Unger R, Murphy AJ, Xu Y, Yancopoulos GD, Li W, Gromada J | 2017 | Cell Metabolism | Metabolism | Cytonuclear | HALO |
| Amyloid-β plaques enhance Alzheimer's brain tau-seeded pathologies by facilitating neuritic plaque tau aggregation | He Z, Guo JL, McBride JD, Narasimhan S, Kim H, Changolkar L, Zhang B, Gathagan RJ, Yue C, Dengler C, Stieber A, Nitla M, Coulter DA, Abel T, Brunden KR, Trojanowski JQ, Lee V M-Y | 2017 | Nature Medicine | Neuroscience | Area Quantification | HALO |
| An ancestral retroviral protein identified as a therapeutic target in type-1 diabetes | Levet S, Medina J, Joanou J, Demolder A, Queruel N, Réant K, Normand M, Seffals M, Dimier J, Germi R, Piofczyk T, Portoukalian J, Touraine J-L, Perron H | 2017 | JCI Insight | Immunology, Metabolism | Classifier, Cytonuclear | HALO |
| Angptl4 does not control hyperglucagonemia or α-cell hyperplasia following glucagon receptor inhibition | Okamoto H, Cavino K, Na E, Krumm E, Kim SY, Stevis PE, Harp J, Murphy AJ, Yancopoulos GD, Gromada J | 2017 | Proceedings of the National Academy of Sciences | Metabolism | Area Quantification | HALO |
| Ante mortem CSF tau levels correlate with post mortem tau pathology in FTLD | Irwin DJ, Lleó A, Xie SX, McMillan CT, Wolk D, Lee EB, Van Deerlin VM, Shaw LM, Trojanowski JQ, Grossman M | 2017 | Annals of Neurology | Neuroscience | Area Quantification | HALO |
| APNG as a prognostic marker in patients with glioblastoma | Fosmark S, Hellwege S, Dahlrot RH, Jensen KL, Derand H, Lohse J, Sørensen MD, Hansen S, Kristensen BW | 2017 | PLOS One | Oncology | ISH/FISH | HALO |
| Association of HIV Status With Local Immune Response to Anal Squamous Cell Carcinoma: Implications for Immunotherapy | Yanik EL, Kaunitz GJ, Cottrell TR, Succaria F, McMiller TL, Ascierto ML, Esandrio J, Xu H, Ogurtsova A, Cornish T, Lipson EJ, Topalian SL, Engels EA, Taube JM | 2017 | JAMA Oncology | Oncology, Immuno-oncology | Cytonuclear | HALO |
| Asymmetry of post-mortem neuropathology in behavioural-variant frontotemporal dementia | DJ Irwin, CT McMillan, SX Xie, K Rascovsky, VM Van Deerlin, HB Coslett, R Hamilton, G Aguirre, EB Lee, VMY Lee, JQ Trojanowski, M Grossman | 2017 | Brain | Neuroscience | Area Quantification | HALO |
| Both brown adipose tissue and skeletal muscle thermogenesis processes are activated during mild to severe cold adaptation in mice | Bal NC, Singh S, Reis FCG, Maurya SK, Pani S, Rowland LA, Periasamy M | 2017 | Journal of Biological Chemistry | Myology | Area Quantification | HALO |
| cFOS-SOX9 Axis Reprograms Bone Marrow-Derived Mesenchymal Stem Cells into Chondroblastic Osteosarcoma | He Y, Zhu W, Shin MH, Gary J, Liu C, Dubois W, Hoover SB, Jiang S, Marrogi E, Mock B, Simpson RM, and Huang J | 2017 | Stem Cell Reports | Oncology | Classifier | HALO |
| Chronic Verubecestat Treatment Suppresses Amyloid Accumulation in Advanced Aged Tg2576-AβPPswe Mice Without Inducing Microhemorrhage | Villarreal S, Zhao F, Hyde LA, Holder D, Forest T, Sondey M, Chen X, Sur C, Parker EM, Kennedy ME | 2017 | Journal of Alzheimer’s Disease | Neuroscience | Object Colocalization | HALO |
| Co-clinical Analysis of a Genetically Engineered Mouse Model and Human Prostate Cancer Reveals Significance of NKX3.1 Expression for Response to 5α-reductase Inhibition | Dutta A, Panja S, Virk RK, Kim JY, Zott R, Cremers S, Golombos DM, Liu D, Mosquera JM, Mostaghel EA, Barbieri CE, Mitrofanova A, Abate-Shen C | 2017 | European Urology | Oncology | Area Quantification | HALO |
| Comparison of branch and distally focused main renal artery denervation using two different radio-frequency systems in a porcine model | Mahfoud F, Pipenhagen CA, Moon LB, Ewen S, Kulenthiran S, Fish JM, Jensen JA, Virmani R, Joner M, Yahagi K, Tsioufis C, Böhm M | 2017 | International Journal of Cardiology | Myology | HALO | |
| Connexin-43 and aquaporin-4 are markers of ageing-related tau astrogliopathy (ARTAG)-related astroglial response | Kovacs GG, Yousef A, Kaindl S, Lee VM, Trojanowski JQ | 2017 | Neuropathology and Applied Neurobiology | Neuroscience | Area Quantification | HALO |
| Differential roles of RET isoforms in medullary and papillary thyroid carcinomas | Lian EY, Maritan SM, Cockburn JG, Kasaian K, Crupi MJF, Hurlbut D, Jones SJM, Wiseman SM, Mulligan LM | 2017 | Endocrine-Related Cancer | Oncology | Cytonuclear | HALO |
| Digital analysis and epigenetic regulation of the signature of rejection in colorectal cancer | Koelzer VH, Sokol L, Zahnd S, Christe L, Dawson H, Berger MD, Inderbitzin D, Zlobec I, Lugli A | 2017 | OncoImmunology | Oncology | Cytonuclear | HALO |
| Digital image analysis agrees with visual estimates of bone marrow trephine biopsy cellularity | Hagiya AS, Etman A, Siddiqi IN, Cen S, Matcuk Jr GR, Brynes RK, Salama ME | 2017 | International Journal of Laboratory Hematology | Oncology | Cytonuclear | HALO |
| DPP9 enzyme activity controls survival of mouse migratory tongue muscle progenitors and its absence leads to neonatal lethality due to suckling defect | Kim M, Minoux M, Piaia A, Kueng B, Gapp B, Weber D, Haller C, Barbieri S, Namoto K, Lorenz T, Wirsching J, Bassilana F, Dietrich W, Rijli FM, Ksiazek I | 2017 | Developmental Biology | Myology | Classifier, Area Quantification | HALO |
| Efficacy of injectable praziquantel for elimination of trematode metacercariae in bluegills (Lepomis macrochirus) and quantification of parasite death by propidium iodide staining | Bader C, Chelladurai JJ, Starling DE, Jones DE, Brewer MT | 2017 | Parasitology Research | Infectious Disease | Area Quantification | HALO |
| Expression of PD-L1 and presence of CD8-positive T cells in pre-treatment specimens of locally advanced cervical cancer | Enwere EK, Kornaga EN, Dean M, Koulis TA, Phan T, Kalantarian M, Köbel M, Ghatage P, Magliocco AM, Lees-Miller DP, Doll CM | 2017 | Modern Pathology | Oncology, Immuno-oncology | Membrane | HALO |
| Persistence of Pancreatic Insulin mRNA Expression and Proinsulin Protein in Type 1 Diabetes Pancreata | Wasserfall C, Nick HS, Campbell-Thompson M, Beachy D, Haataja L, Kusmartseva I, Posgai A, Beery M, Rhodes C, Bonifacio E, Arvan P, Atkinson M | 2017 | Cell Metabolism | Metabolism | Area Quantification | HALO |
| Glucagon receptor inhibition normalizes blood glucose in severe insulin-resistant mice | Okamoto H, Cavino K, Na E, Krumm E, Kim SY, Cheng X, Murphy AJ, Yancopoulos GD, Gromada J | 2017 | Proceedings of the National Academy of Sciences | Metabolism | Area Quantification | HALO |
| High levels of tumor-associated neutrophils are associated with improved overall survival in patients with stage II colorectal cancer | RS Berry, M-J Xiong, A Greenbaum, P Mortaji, RA Nofchissey, F Schultz, C Martinez, L Luo, KT Morris, JA Hanson | 2017 | PLOS One | Oncology, Immuno-oncology | Cytonuclear | HALO |
| Identification of the SUMO E3 ligase PIAS1 as a potential survival biomarker in breast cancer | Chanda A, Chan A, Deng L, Kornaga EN, Enwere EK, Morris DG, Bonni S | 2017 | PLOS One | Oncology | Classifier, Cytonuclear | HALO |
| Transcriptional mechanisms of resistance to anti-PD-1 therapy | Ascierto ML, Makohon-Moore A, Lipson EJ, Taube JM, McMiller TL, Berger AE, Fan J, Kaunitz GJ, Cottrell TR, Kohutek ZA, Favorov A, Makarov V, Riaz N, Chan TA, Cope L, Hruban RH, Pardoll DM, Taylor BS, Solit DB, Iacobuzio-Donahue CA, Topalian SL | 2017 | Clinical Cancer Research | Oncology, Immuno-oncology | Immune | HALO |
| In vivo characterization of a new type of biodegradable starch microsphere for transarterial embolization | Sommer CM, Do TD, Schlett CL, Flechsig P, Gockner TL, Kuthning A, Vollherbst DF, Pereira PL, Kauczor HU, Macher-Göppinger S | 2017 | Journal of Biomaterials Applications | Oncology | Classifier | HALO |
| Loss of the imprinted, non-coding Snord116 gene cluster in the interval deleted in the Prader Willi syndrome results in murine neuronal and endocrine pancreatic developmental phenotypes | Burnett LC, Hubner G, LeDuc C, Morabito MV, Carli JFM, Leibel RL | 2017 | Human Molecular Genetics | Metabolism | Cytonuclear | HALO |
| Modulating the therapeutic response of tumours to dietary serine and glycine starvation | Maddocks ODK, Athineos D, Cheung EC, Lee P, Zhang T, van den Broek NJF, Mackay GM, Labuschagne CF, Gay D, Kruiswijk F, Blagih J, Vincent DF, Campbell KJ, Ceteci F, Sansom OJ, Blyth K, Vousden KH | 2017 | Nature | Oncology | Cytonuclear | HALO |
| Spatial distribution of EGFR and KRAS mutation frequencies correlates with histological growth patterns of lung adenocarcinomas | Dietz S, Harms A, Endris V, Eichhorn, Kriegsmann M, Longuespée R, Stenzinger A, Sültmann H, Warth A, and Kazdal D | 2017 | International Journal of Cancer | Oncology | Cytonuclear | HALO |
| The clinical impact of tumour-infiltrating lymphocytes in colorectal cancer differs by anatomical subsite: A cohort study | Berntsson J, Svensson MC, Leandersson K, Nodin B, Micke P, Larsson AH, Eberhard J, Jirstrom K | 2017 | International Journal of Cancer | Oncology, Immuno-oncology | Cytonuclear | HALO |
| Neuron loss and degeneration in the progression of TDP-43 in frontotemporal lobar degeneration | Yousef A, Robinson JL, Irwin DJ, Byrne MD, Kwong LK, Lee EB, Xu Y, Xie SX, Rennert L, Suh ER, Van Deerlin VM, Grossman M, Lee VM-Y, Trojanowski JQ | 2017 | Acta Neuropathologica Communications | Neuroscience | Area Quantification, Cytonuclear | HALO |
| Selective imaging of internalized proteopathic α-synuclein seeds in primary neurons reveals mechanistic insight into transmission of synucleinopathies | Karpowicz RJ, Haney CM, Mihaila TS, Sandler RM, Petersson EJ, and Lee VM-Y | 2017 | Journal of Biological Chemistry | Neuroscience | Area Quantification, Cytonuclear | HALO |
| Neutorphils dominate the immune cell composition in non-small cell lung cancer | Kargl J, Busch SE, Yang GHY, Kim K-H, Hanke ML, Metz HE, Hubbard JJ, Lee SM, Madtes DK, McIntosh MW, Houghton AM | 2017 | Nature Communications | Oncology, Immuno-oncology | Area Quantification | HALO |
| Pathological tau strains from human brains recapitulate the diversity of tauopathies in non-transgenic mouse brain | S Narasimhan, JL Guo, L Changolkar, A Stieber, JD McBride, LV Silva, Z He, B Zhang, RJ Gathagan, JQ Trojanowski, VMY Lee | 2017 | Journal of Neuroscience | Neuroscience | Cytonuclear | HALO |
| Plant-based vaccines for oral delivery of type 1 diabetes-related autoantigens: Evaluating oral tolerance mechanisms and disease prevention in NOD mice | Posgai AL, Wasserfall CH, Kwon K-C, Daniell H, Schatz DA, Atkinson MA | 2017 | Scientific Reports | Metabolism | Area Quantification | HALO |
| Prevalence of somatic mitochondrial mutations and spatial distribution of mitochondria in non-small cell lung cancer | Kazdal D, Harms A, Endris V, Penzel R, Kriegsmann M, Eichhorn F, Muley T, Stenzinger A, Pfarr N, Weichert W, and Warth A | 2017 | British Journal of Cancer | Oncology | Cytonuclear | HALO |
| Expression of protein disulfide isomerase family members correlates with tumor progression and patient survival in ovarian cancer | Samanta S, Tamura S, Dubeau L, Mhawech-Fauceglia P, Miyagi Y, Kato H, Lieberman R, Buckanovich RJ, Lin YG, Neamati N | 2017 | Oncotarget | Oncology | Area Quantification | HALO |
| Receptor tyrosine kinase expression and phosphorylation in canine nasal carcinoma | Hocker SA, Higginbotham ML, Schermerhorn T, Henningson J | 2017 | Research in Veterinary Science | Oncology | Area Quantification, Multiplex IHC | HALO |
| Retinoic-acid-orphan-receptor-C inhibition suppresses Th17 cells and induces thymic aberrations | Guntermann C, Piaia A, Hamel M-L, Theil D, Rubic-Schneider T, del Rio-Espinola A, Dong L, Billich A, Kaupmann K, Dawson J, Hoegenauer K, Orain D, Hintermann S, Stringer R, Pate DD, Doelemeyer A, Deurinck M, and Schümann J | 2017 | JCI Insight | Oncology, Immuno-oncology | Area Quantification, Cytonuclear | HALO |
| Sex- and Dose-Specific Effects of Maternal Bisphenol A Exposure on Pancreatic Islets of First- and Second-Generation Adult Mice Offspring | Bansal A, Rashid C, Xin F, Li C, Polyak E, Duemler A, van der Meer T, Stefaniak M, Wajid S, Doliba N, Bartolomei MS, Simmons RA | 2017 | Environmental Health Perspectives | Metabolism | Area Quantification | HALO |
| Targeting autophagy inhibits melanoma growth by enhancing NK cells infiltration in a CCL5-dependent manner | Mgrditchiana T, Arakeliana T, Paggettia J, Nomana MZ, Virya E, Moussaya E, Van Moera K, Kreisb S, Guerinc C, Buartd S, Roberte C, Borgf C, Vielhg P, Chouaibd S, Berchema G, Janji B | 2017 | Proceedings of the National Academy of Sciences | Oncology, Immuno-oncology | Cytonuclear | HALO |
| The R-enantiomer of ketorolac delays mammary tumor development in mouse mammary tumor virus-polyoma middle T antigen (MMTV-PyMT) mice | AS Peretti, D Dominguez, MM Grimes, HJ Hathaway, ER Prossnitz, MR Rivera, A Wandinger-Ness, D Kusewitt, LG Hudson | 2017 | The American Journal of Pathology | Oncology | Classifier, Area Quantification, Cytonuclear | HALO |
| T-cell Localization, Activation, and Clonal Expansion in Human Pancreatic Ductal Adenocarcinoma | Stromnes IM, Hulbert A, Pierce RH, Greenberg PD, Hingorani SR | 2017 | Cancer Immunology Research | Oncology, Immuno-oncology | Highplex FL | HALO |
| TGFβ pathway limits dedifferentiation following WNT and MAPK pathway activation to suppress intestinal tumourigenesis | Cammareri P, Vincent DF, Hodder MC, Ridgway RA, Murgia C, Nobis M, Campbell AD, Varga J, Huels DJ, Subramani C, Prescott KLH, Nixon C, Hedley A, Barry ST, Greten FR, Inman GJ, and Sansom OJ | 2017 | Cell Death and Differentiation | Oncology | HALO | |
| The action of β-hydroxybutyrate on the growth, metabolism and global histone H3 acetylation of spontaneous mouse mammary tumours: evidence of a β-hydroxybutyrate paradox | Rodrigues LM, Uribe-Lewis S, Madhu B, Honess DJ, Stubbs M, Griffiths JR | 2017 | Cancer & Metabolism | Oncology, Metabolism | Area Quantification, Cytonuclear | HALO |
| In situ macrophage phenotypic transition is affected by altered cellular composition prior to acute sterile muscle injury | Patsalos A, Pap A, Varga T, Trencsenyi G, Contreras GA, Garai I, Papp Z, Dezso B, Pintye E, Nagy L | 2017 | The Journal of Physiology | Myology | HALO | |
| Treatment with the WNT5A-mimicking peptide Foxy-5 effictively reduces the metastatic spread of WNT5A-low prostate cancer cells in an orthotopic mouse model | Canesin G, Evans-Axelsson S, Hellsten R, Krzyzanowska A, Prasad CP, Bjartell A, Andersson T | 2017 | PLOS One | Oncology | Membrane | HALO |
| Weight Pertubation Alters Leptin Signal Transduction in a Region-Specific Manner throughout the Brain | Morabito MV, Ravussin Y, Mueller BR, Skowronski AA, Watanabe K, Foo KS, Lee SX, Lehmann A, Hjorth S, ZeltserLM, LeDuc CA, Leibel RL | 2017 | PLOS One | Metabolism | Cytonuclear | HALO |
| Digital image analysis supports a nuclear-to-cytoplasmic ratio cutoff value below 0.7 for positive for high-grade urothelial carcinoma and suspicious for high-grade urothelial carcinoma in urine cytology specimens | McIntire PJ, Snow JT, Elsoukkary SS, Soong L, Sweeney J, Robinson BD, Siddiqui MT | 2018 | Cancer Cytopathology | Oncology | HALO | |
| Hot Spot and Whole-Tumor Enumeration of CD8(+) Tumor-Infiltrating Lymphocytes Utilizing Digital Image Analysis Is Prognostic in Triple-Negative Breast Cancer | McIntire PJ, Irshaid L, Liu Y, Chen Z, Menken F, Nowak E, Shin SJ, Ginter PS | 2018 | Clinical Breast Cancer | Oncology, Immuno-oncology | Cytonuclear, Figure Maker | HALO |
| Acquired cancer resistance to combination immunotherapy from transcriptional loss of class I HLA | Paulson KG, Voillet V, McAfee MS, Hunter DS, Wagener FD, Perdicchio, Valente WJ, Koelle SJ, Church CD, Vandeven N, Thomas H, Colunga AG, Iyer JG, Yee C, Kulikauskas R, Koelle DM, Pierce RH, Bielas JH, Greenberg PD, Bhatia S, Gottardo R, Nghiem P, Chapuis AG | 2018 | Nature Communications | Immuno-oncology | Figure Maker | HALO |
| Innate Sex Bias of Staphylococcus aureus Skin Infection Is Driven by a-Hemolysin | Castleman MJ, Pokhrel S, Triplett KD, Kusewitt DF, Elmore BO, Joyner JA, Femling JK, Sharma G, Hathaway HJ, Prossnitz ER, Hall PR | 2018 | The Journal of Immunology | Infectious Disease | HALO | |
| The use of automated Ki67 analysis to predict Oncotype DX risk-of-recurrence categories in early-stage breast cancer | Thakur SS, Li H, Chan AMY, Tudor R, Bigras G, Morris D, Enwere EK | 2018 | PLOS ONE | Oncology | Cytonuclear, Figure Maker | HALO |
| Ultrasensitive automated RNA in situ hybridization for kappa and lambda light chain mRNA detects B-cell clonality in tissue biopsies with performance comparable or superior to flow cytometry | Guo L, Wang Z, Anderson CA, Doolittle E, Kernag S, Cotta CV, Ondrejka SL, Ma X-J, Cook JR | 2018 | Modern Pathology | Other | Classifier, ISH/FISH | HALO |
| Subclonal evolution of pulmonary adenocarcinomas delineated by spatially distributed somatic mitochondrial mutations | Kazdal D, Harms A, Endris V, Penzel R, Oliveira C, Kriegsmann M, Longuespee R, Winter H, Schneider MA, Muley T, Pfarr N, Weichert W, Stenzinger A,Warth A | 2018 | Lung Cancer | Oncology | HALO | |
| pRAD50: a novel and clinically applicable pharmacodynamic biomarker of both ATM and ATR inhibition identified using mass spectrometry and immunohistochemistry | Jones GN, Rooney C, Griffin N, Roudier M, Young LA, Garcia-Trinidad A, Hughes GD, Whiteaker JR, Wilson Z, Odedra R, Zhao L, Ivey RG, Howat WJ, Harrington EA, Carrett JC, Ramos-Montoya A, Lau A, Paulovich AG, Cadogan EB, Pierce AJ | 2018 | British Journal of Cancer | Oncology | Classifier, Cytonuclear | HALO |
| Tough Composite Hydrogels with High Loading and Local Release of Biological Drugs | Li J, Weber E, Guth‐Gundel S, Schuleit M, Kuttler A, Halleux C, Accart N, Doelemeyer A, Basler A, Tigani B, Wuersch K, Fornaro M, Kneissel M, Stafford A, Freedman BR, Mooney DJ | 2018 | Advanced Healthcare Materials | Biomaterials | Area Quantification | HALO |
| A brain-penetrant triazolopyrimidine enhances microtubule-stability, reduces axonal dysfunction and decreases tau pathology in a mouse tauopathy model | Zhang B, Yao Y, Cornec A-S, Oukoloff K, James MJ, Koivula P, Trojanowski JQ, Smith AB III, Lee VM-Y, Ballatore C, Brunden KR | 2018 | Molecular Neurodegeneration | Neuroscience | Area Quantification | HALO |
| A CD3-bispecific molecule targeting P-cadherin demonstrates T cell-mediated regression of established solid tumors in mice | TS Fisher, AT Hooper, J Lucas, TH Clark, AK Rohner, B Peano, MW Elliott, K Tsaparikos, H Wang, J Golas, M Gavriil, N Haddish-Berhane, L Tchistiakova, H-P Gerber, AR Root, C May | 2018 | Cancer Immunology, Immunotherapy | Oncology, Immuno-oncology | Area Quantification | HALO |
| A murine glaucoma model induced by rapid in vivo photopolymerization of hyaluronic acid glycidyl methacrylate | Guo C, Qu X, Rangaswamy N, Leehy B, Xiang C, Rice D, Prasanna G | 2018 | PLOS One | Biomaterials | Area Quantification | HALO |
| A phase II study of the dual mTOR inhibitor MLN0128 in patients with metastatic castration resistant prostate cancer | Graham L, Banda K, Torres A, Carver BS, Chen Y, Pisano K, Shelkey G, Curley T, Scher HI, Lotan TL, Hsieh AC, Rathkopf DE | 2018 | Investigational New Drugs | Oncology | ISH/FISH | HALO |
| A suboptimal maternal diet combined with accelerated postnatal growth results in an altered aging profile in the thymus of male rats | Tarry-Adkins JL, Aiken CE, Ashmore TJ, Fernandez-Twinn DS, Chen J-H, Ozanne SE | 2018 | The FASEB Journal | Neuroscience, Metabolism | Classifier, Vacuole | HALO |
| A transcriptionally and functionally distinct PD-1+ CD8+ T cell pool with predictive potential in non-small-cell lung cancer treated with PD-1 blockade | Thommen DS, Koelzer VH, Herzig P, Roller A, Trefny M, Dimeloe S, Kiialainen A, Hanhart J, Schil C, Hess C, Prince SS, Wiese M, Lardinois D, Ho P-C, Klein C, Karanikas V, Mertz KD, Schumacher TN, Zippelius A | 2018 | Nature Medicine | Oncology, Immuno-oncology | Multiplex IHC | HALO |
| Accelerated wound healing by injectable star poly(ethylene)-b-poly(propylene sulfide) scaffolds loaded with poorly water-soluble drugs | Zhu S, Li S, Escuin-Ordinas H, Dimatteo R, Xia W, Ribas A, Segura T | 2018 | Journal of Controlled Release | Biomaterials, Other | Cytonuclear | HALO |
| RAD51 foci as a functional biomarker of homologous recombination repair and PARP inhibitor resistance in germline BRCA mutated breast cancer | Cruz C, Castroviejo-Bermejo M, Gutiérrez-Enríquez S, Llop-Guevara A, Ibrahim YH, Gris-Oliver A, Bonache S, Morancho B, Bruna A, Rueda OM, Lai Z, Polanska UM, Jones GN,Kristel P, de Bustos L, Guzman M, Rodriguez O, Grueso J, Montalban G, Caratú G, Mancuso F, Fasani R, Jiménez J, Howat WJ, Dougherty B, Vivancos A, Nuciforo P, Serres-Créixams X, Rubio IT, Oaknin A, Cadogan O, Barrett JC, Caldas C, Baselga J, Saura C, Cortés J, Arribas J, Jonkers J, Díez O, O’Connor MJ, Balmaña J, SerraV | 2018 | Annals of Oncology | Oncology | Classifier, Cytonuclear | HALO |
| Age-related pathology after adenoviral overexpression of the leucine-rich repeat kinase 2 in the mouse striatum | Kritzingerab A, Ferger B, Gillardon F, Stierstorfer B, Birk G, Kochanek S, Ciossek T | 2018 | Neurobiology of Aging | Neuroscience | Area Quantification, Object Colocalization, Microglia | HALO |
| Altered dopaminergic regulation of the dorsal striatum is able to induce tic-like movements in juvenile rats | Nespoli E, Rizzo F, Boeckers T, Schulze U, Hengerer B | 2018 | PLOS One | Neuroscience | Cytonuclear | HALO |
| Anti-NKG2A mAb Is a Checkpoint Inhibitor that Promotes Anti-tumor Immunity by Unleashing Both T and NK Cells | Andre ́P, Denis C, Soulas C, Bourbon-Caillet C, Lopez J, Arnoux T, Bléry M, Bonnafous C, Gauthier L, Morel A, Rossi B, Remark R, Breso V, Bonnet E, Habif G, Guia S, Lalanne AI, Hoffmann C, Lantz O, Fayette J, Boyer-Chammard A, Zerbib R, Dodion P, Ghadially H, Jure-Kunkel M, Morel Y, Herbst R, Narni-Mancinelli E, Cohen RB, Vivier E | 2018 | Cell | Oncology, Immuno-oncology | Area Quantification, Cytonuclear | HALO |
| Attenuation of diet-induced hypotalamic inflammation following bariatric surgery in female mice | Herrick MK, Favela KM, Simerly RB, Abumrad NN, Bingham NC | 2018 | Molecular Medicine | Immunology, Neuroscience | Cytonuclear | HALO |
| Biomarker Evaluation and Toxic Effects of an Acute Oral and Systemic Fumonisin Exposure of Pigs with a Special Focus on Dietary Fumonisin Esterase Supplementation | Schertz H, Danicke S, Frahm J, Schatzmayr D, Dohnal I, Bichl G, Schwartz-Zimmerman HE, Colicchia S, Breves G, Teifke JP, Kluess J | 2018 | Toxins | Toxicology | Classifier | HALO |
| Blocking HIF signaling via novel inhibitors of CA9 and APE1/Ref-1 dramatically affects pancreatic cancer cell survival | Logsdon DP, Fenil S, Fabrizio C, Supuran CT, Kamocka M, Jacobsen MH, Sandusky GE, Kelley MR, Fishel ML | 2018 | Scientific Reports | Oncology | Classifier, Cytonuclear | HALO |
| Bortezomib prevents cytarabine resistance in MCL, which is characterized by down-regulation of dCK and up-regulation of SPIB resulting in high NF-κB activity | Freiburghaus C, Emruli VK, Johansson A, Eskelund CW, Grønbæk K, Olsson R, Ek F, Jerkeman M, Ek S | 2018 | BMC Cancer | Oncology | Classifier, Cytonuclear | HALO |
| Breast and pancreatic cancer interrupt IRF8-dependent dendritic cell development to overcome immune surveillance | Meyer MA, Baer JM, Knolhoff BL, Nywening TM, Panni RZ, Su X, Weilbaecher KN, Hawkins WG, Ma C, Fields RC, Linehan DC, Challen GA, Faccio R, Aft RL, DeNardo DG | 2018 | Nature Communications | Oncology, Immuno-oncology | ISH/FISH | HALO |
| CD163+ macrophages promote angiogenesis and vascular permeability accompanied by inflammation in atherosclerosis | Guo L, Akahori H, Harari E, Smith SL, Polavarapu R, Karmali V, Otsuka F, Gannon RL, Braumann RE, Dickinson MH, Gupta A, Jenkins AL, Lipinski MJ, Kim J, Chhour P, de Vries PS, Jinnouchi H, Kutys R, Mori H, Kutyna MD, Torii S, Sakamoto A, Choi CU, Cheng Q, Grove M, Mariem A. Sawan MA, Zhang Y, Cao Y, Kolodgie FD, Cormode DP, Arking DE, Boerwinkle E, Morrison AC, Erdmann J, Sotoodehnia N, Virmani R, and Finn AV | 2018 | The Journal of Clinical Investigation | Immunology | HALO | |
| Cellular milieu imparts distinct pathological α-synuclein strains in α-synucleinopathies | Peng C, Gathagan RJ, Covell DJ, Medellin C, Stieber A, Robinson JL, Zhang B, Pitkin RM, Olufemi MF, Luk KC, Trojanowski JQ, Lee VM-Y | 2018 | Nature | Neuroscience | Area Quantification | HALO |
| Chronic Intermittent Hypoxia Induces Robust Astrogliosis in an Alzheimer’s Disease-Relevant Mouse Model | Macheda T, Roberts K, Lyons DN, Higgins E, Ritter KJ, Lin A-L, Alilain WJ, Bachstetter AD | 2018 | Neuroscience | Neuroscience | Area Quantification | HALO |
| Class 4 Semaphorins and Plexin-B receptors regulate GABAergic and glutamatergic synapse development in the mammalian hippocampus | McDermott JE, Goldblatt D, Paradis S | 2018 | Molecular and Cellular Neuroscience | Neuroscience | HALO | |
| Comparison of Biologic Effect and Particulate Embolization after Femoral Artery Treatment with Three Drug-Coated Balloons in Healthy Swine Model | Torii S, Jinnouchi H, Sakamoto A, Romero ME, Kolodgie FD, Virmani R, Finn AV | 2018 | Journal of Vascular and Interventional Radiology | Other | Object Colocalization | HALO |
| Cystic fibrosis–related diabetes is caused by islet loss and inflammation | Hart NJ, Aramandla R, Poffenberger G, Fayolle C, Thames AH, Bautista A, Spigelman AF, Babon JAB, DeNicola ME, Dadi PK, Bush WS, Balamurugan AN, Brissova M, Dai C, Prasad N, Bottino R, Jacobson DA, Drumm ML, Kent SC, MacDonald PE, Powers AC | 2018 | JHI Insights | Immunology, Metabolism, Fibrosis | Cytonuclear | HALO |
| Diet-Induced Growth Is Regulated via Acquired Leptin Resistance and Engages a PomcSomatostatin-Growth Hormone Circuit | Lohr H, Hess S, Pereira MMA, Reino P, Leibold S, Schenkel C, Wunderlich CM, Kloppenburg P, Bruning JC, Hammerschmidt M | 2018 | Cell Reports | Neuroscience, Metabolism | Cytonuclear | HALO |
| Differential α-synuclein expression contributes to selective vulnerability of hippocampal neuron subpopulations to fibril-induced toxicity | Luna E, Decker SC, Riddle DM, Caputo A, Zhang B, Cole T, Caswell C, Xie SX, Lee VMY, Luk KC | 2018 | Acta Neuopathologica | Neuroscience | Area Quantification, Cytonuclear | HALO |
| Digital image analysis improves precision of PD‐L1 scoring in cutaneous melanoma | Koelzer VH, Gisler A, Hanhart JC, Griss J, Wagner SN, Willi N, Cathomas G, Sachs M, Kempf W, Thommen DS, Mertz KD | 2018 | Histopathology | Oncology, Immuno-oncology | Classifier, Multiplex IHC | HALO |
| Digital image analysis of Ki67 proliferation index in breast cancer using virtual dual staining on whole tissue sections: clinical validation and inter‑platform agreement | Koopman T, Buikema HJ, Hollema H, de Bock GH, van der Vegt B | 2018 | Breast Cancer Research and Treatment | Oncology | Classifier, Cytonuclear | HALO |
| Disease Progression and Pharmacological Intervention in a Nutrient-Deficient Rat Model of Nonalcoholic Steatohepatitis | Tølbøl KS, Stierstorfer B, Rippmann JF, Veidal SS, Rigbolt KTG, Schönberger T, Gillum MP, Hansen HH, Vrang N, Jelsing J, Feigh M, Broermann A | 2018 | Digestive Diseases and Sciences | Metabolism | Area Quantification | HALO |
| Evaluation of PD-L1 expression on vortex-isolated circulating tumor cells in metastatic lung cancer | Dhar M, Wong J, Che J, Matsumoto M, Grogan T, Elashof D, Garon EB, Goldman JW, Christen ES, Carlo DD, Kulkarni RP | 2018 | Scientific Reports | Oncology, Immuno-oncology | Area Quantification | HALO |
| Food Perception Primes Hepatic ER Homeostasis via Melanocortin-Dependent Control of mTOR Activation | Brandt C, Nolte H, Henschke S, Ruud LE, Awazawa M, Morgan DA, Gabel P, Sprenger H-G, Hess ME, Günther S, Langer T, Rahmouni K, Fenselau H, Krüger M, Brüning JC | 2018 | Cell | Neuroscience, Metabolism | ISH/FISH | HALO |
| FOXM1 contributes to treatment failure in acute myeloid leukemia | Khan I, Halasi M, Patel A, Schultz R, Kalakota N, Chen Y-H, Aardsma N, Liu L, Crispino JD, Mahmud N, Frankfurt O, Gartel AL | 2018 | JCI Insight | Oncology | Multiplex IHC | HALO |
| GABA promotes β-cell proliferation, but does not overcome impaired glucose homeostasis associated with diet-induced obesity | Untereiner A, Abdo S, Bhattacharjee A, Gohil H, Pourasgari F, Ibeh N, Lai M, Batchuluun B, Wong A, Khuu N, Liu Y, Rijjal DA, Winegarden N, Virtanen C, Orser BA, Cabrera O, Varga G, Rocheleau J, Dai FF, Wheeler MB | 2018 | The FASEB Journal | Metabolism | Cytonuclear | HALO |
| Gene Signature of Proliferating Human Pancreatic α-Cells | Dominguez Gutierrez G, Xin Y, Okamoto H, Kim J, Lee A-H, Ni M, Adler C, Yancopoulos GD, Murphy AJ, Gromada J | 2018 | Endocrinology | Metabolism | ISH/FISH | HALO |
| Glucagon contibutes to liver zonation | Cheng X, Kim SK, Okamoto H, Xin Y, Yancopoulos GD, Murphy AJ, Gromada J | 2018 | Proceedings of the National Academy of Sciences | Metabolism | Area Quantification | HALO |
| High response rate to PD-1 blockade in desmoplastic melanomas | Eroglu Z, Zaretsky JM, Hu-Lieskovan H, Kim DW, Algazi A, Johnson DB, Liniker E, Kong B, Munhoz R, Rapisuwon S, Gherardini PF, Chmielowski B, Wang X, Shintaku IP, Wei C, Sosman JA, Joseph RW, Postow MA, Carlino MS, Hwu W-J, Scolyer RA, Messina J, Cochran AJ, Long GV, Ribas A | 2018 | Nature | Oncology, Immuno-oncology | Cytonuclear | HALO |
| Early Stage HER2-Positive Breast Cancers Not Achieving a pCR From Neoadjuvant Trastuzumab- or Pertuzumab-Based Regimens Have an Immunosuppressive Phenotype | Force J, Howie LJ, Abbot SE, Bentley R, Marcom PK, Kimmick G, Westbrook K, Sammons SL, Parks M, Topping DL, Emerson R, Broadwater G, Hyslop T, Blackwell KL, Nair SK | 2018 | Clinical Breast Cancer | Oncology, Immuno-oncology | Cytonuclear | HALO |
| Induction of hemangiosarcoma in mice after chronic treatment with S1P-modulator siponimod and its lack of relevance to rat and human | Pognan F, Mahl JA, Papoutsi M, David Ledieu D, Raccuglia M, Theil D, Voytek SB, Devine PJ, Kubek‑Luck K, Claudio N, Cordier A, Heier A, Kolly C, Hartmann A, Chibout S-D, Bouchard P, Trendelenburg C | 2018 | Archives of Toxicology | Toxicology | Classifier, Cytonuclear | HALO |
| Inhibiting Interleukin 36 Receptor Signaling Reduces Fibrosis in Mice with Chronic Intestinal Inflammation | Scheibe K, Kersten C, Schmied A, Vieth M, Primbs T, Carlé B, Knieling F, Claussen J, Klimowicz AC, Zheng J, Baum P, Meyer S, Schürmann S, Friedrich O, Waldner MJ, Rath T, Wirtz S, Kollias G, Ekici AB, Atreya R, Raymond EL, Mbow ML, Neurath MF, Neufert C | 2018 | Gastroenterology | Immunology, Fibrosis | HALO | |
| Intermittent Hypoxia Exacerbates Increased Blood Pressure in Rats with Chronic Kidney Disease | Riggs J, Pace C, Ward HH, Gonzalez Bosc L, Rios L, Barrera A, Kanagy NL | 2018 | American Journal of Physiology-Renal Physiology | Metabolism | Classifier, Cytonuclear | HALO |
| Lenvatinib inhibits angiogenesis and tumor fibroblast growth factor signaling pathways in human hepatocellular carcinoma models | Matsuki M, Hoshi T, Yamamoto Y, Ikemori-Kawada M, Minoshima Y, Funahashi Y, Matsui J | 2018 | Cancer Medicine | Oncology | Cytonuclear | HALO |
| Low and variable tumor reactivity of the intratumoral TCR repertoire in human cancers | Scheper W, Kelderman S, Fanchi LF, Linnemann C, Bendle G, de Rooij MAJ, Hirt C, Mezzadra R, Slagter M, Dijkstra K, Kluin RJC, Snaebjornsson P, Milne K, Nelson BH, Zijlmans H, Kenter G, Voest EE, Haanen JBAG, Schumacher TN | 2018 | Nature Medicine | Oncology, Immuno-oncology | Cytonuclear | HALO |
| Mice harboring the human SLC30A8 R138X loss-of-function mutation have increased insulin secretory capacity | Kleinera S, Gomeza D, Megraa B, Naa E, Bhavsara R, Cavinoa K, Xina Y, Rojasa J, Dominguez-Gutierreza G, Zambrowicza B, Carratb G, Chabosseaub P, Hub M, Murphya AJ, Yancopoulosa GD, Rutterb GA, Gromadaa J | 2018 | Proceedings of the National Academy of Sciences | Metabolism | Cytonuclear | HALO |
| Mild Impairment of Mitochondrial OXPHOS Promotes Fatty Acid Utilization in POMC Neurons and Improves Glucose Homeostasis in Obesity | Timper K, Paeger L, Sánchez-Lasheras C, Varela L, Jais A, Nolte H, Vogt MC, Hausen AC, Heilinger C, Evers N, Pospisilik JA, Penninger JM, Taylor EB, Horvath TL, Kloppenburg P, Brüning JC | 2018 | Cell Reports | Neuroscience, Metabolism | Cytonuclear | HALO |
| Luminally-polarized mural and vascular remodeling in ileal strictures of Crohn's Disease | Zhang X, Ko HM, Torres J, Panchal HJ, Cai Z, WagneR M, Sands BE, Colombel J-F, Cho J, Taouli B, Harpaz N | 2018 | Human Pathology | Immunology | HALO | |
| Tumor Microenvironment in Functional Adrenocortical Adenomas: Immune Cell Infiltration in Cortisol-producing Adrenocortical Adenoma | Kitawaki Y, Nakamura Y, Kubota-Nakayama F, YamazakiY, Miki Y, Hata S, Ise K, Kikuchie K, MorimotoR, Satoh F, Sasano H | 2018 | Human Pathology | Oncology, Immuno-oncology | Area Quantification | HALO |
| Molecular and immunologic analysis of laryngeal squamous cell carcinoma in smokers and non-smokers | Malm I-J, rooper LM, Bishop JA, Ozgursoy SK, Hillel AT, Akst LM, Best SR | 2018 | American Journal of Otolaryngology | Oncology, Immuno-oncology | HALO | |
| Mutant myocilin impacts sarcomere ultrastructure in mouse gastrocnemius muscle | Lynch JM, Dolman AJ, Guo C, Dolan K, Xiang C, Reda S, Li B, Prasanna G | 2018 | PLOS One | Gastroenterology, Myology | ISH/FISH | HALO |
| Ossabaw Pigs With a PCSK9 Gain‐of‐Function Mutation Develop Accelerated Coronary Atherosclerotic Lesions: A Novel Model for Preclinical Studies | Yuan F, Guo L, Park K-H, Woollard JR, Taek‐Geun K, Jiang K, Melkamu T, Zang B, Smith SL, Fahrenkrug SC, Kolodgie FD, Lerman A, Virmani R, Lerman LO, Carlson DF | 2018 | Journal of the American Heart Association | Myology | Area Quantification | HALO |
| Ovarian Tumor Microenvironment Signaling: Convergence on the Rac1 GTPase | Hudson LG, Gillette JM, Kang H, Rivera MR, Wandinger-Ness A | 2018 | Cancers | Review | Classifier, Cytonuclear, Figure Maker | HALO |
| Up-Regulation of Iba-1 and GFAP in the Acidic Saline Model of Chronic Widespread Musculoskeletal Pain: A Pilot Study Examining the Relationship Between Gliosis and Hyperalgesia | Lambert DM, Kumar U, Hafell UO | 2018 | Journal of Neuroscience and Neuropharmacology | Neuroscience | Area Quantification | HALO |
| Pharmacogenetic neuronal stimulation increases human tau pathology and trans-synaptic spread of tau to distal brain regions in mice | Schultz MK, Gentzel R, Usenovic M, Gretzul C, Ware C, Parmentier-Batteur S, Schachter JB, Zariwala HA | 2018 | Neurobiology of Disease | Neuroscience | Object Colocalization | HALO |
| Relationship between mismatch repair immunophenotype and long-term survival in patients with resected periampullary adenocarcinoma | Heby M, Lundgren S, Nodin B, Elebro J, Eberhard J, Jirström K | 2018 | Journal of Translational Medicine | Oncology, Immuno-oncology | Object Colocalization | HALO |
| The novel ATM inhbitior (AZ31) enhances antitumor activity in patient derived xenografts that are resistant to irinotecan montherapy | Greene J, Nguyen A, Bagby SM, Jones GN, Tai WM, Quackenbush KS, Schreiber A, Messersmith WA, Devaraj KM, Blatchford P, Eckhardt SG, Cadogan EB, Hughes GD, Smith A, Pitts TM, Arcaroli JJ | 2018 | Oncotarget | Oncology | Classifier, Area Quantification, Cytonuclear | HALO |
| Selective modulation of the androgen receptor AF2 domain rescues degeneration in spinal bulbar muscular atrophy | Badders NM, Korff A, Miranda HC, Vuppala PK, Smith RB, Winborn BJ, Quemin ER, Sopher BL, Dearman J, Messing J, Kim NC, Moore J, Freibaum BD, Kanagaraj AP, Fan B, Tillman H, Chen P-C, Wang Y, Freeman BB, Li Y, Kim HJ, La Spada AR, Taylor JP | 2018 | Nature Medicine | Myology | Area Quantification | HALO |
| The brain-penetrant clinical ATM inhibitor AZD1390 radiosensitizes and improves survival of preclinical brain tumor models | Durant ST, Zheng L, Wang Y, Chen K, Zhang L, Zhang T, Yang Z, Riches L, Trinidad AG, Fok JHL, Hunt T, Pike KG, Wilson J, Smith A, Colclough N, Reddy VP, Sykes A, Janefeldt A, Johnström P, Varnäs K, Takano A, Ling S, Orme J, Stott J, Roberts C, Barrett I, Jones G, Roudier M, Pierce A, Allen J, Kahn J, Sule A, Karlin J, Cronin A, Chapman M, Valerie K, Illingworth R, Pass M | 2018 | Science Advances | Oncology, Neuroscience | Classifier, Cytonuclear | HALO |
| Systemic messenger RNA as an etiological treatment for acute intermittent porphyria | Jiang L, Berraondo P, Jericó D, Guey LT, Sampedro A, Frassetto A, Benenato KE, Burke K, Santamaría E, Alegre M, Pejenaute A, Kalariya M, Butcher W, Park JS, Zhu X, Sabnis S, Kumarasinghe ES, Salerno T, Kenney M, Lukacs CM, Ávila MA, Martini PGV, Fontanellas A | 2018 | Nature Medicine | Metabolism | Area Quantification | HALO |
| TGFβ inhibition restores a regenerative response in acute liver injury by suppressing paracrine senescence | Bird TG, Müller M, Boulter L, Vincent DF, Ridgway RA, Elena Lopez-Guadamillas E, Lu W-Y, Jamieson T, Govaere O, Campbell AD, Ferreira-Gonzalez S, Cole AM, Hay T, Simpson KJ, Clark W, Hedley A, Clarke M, Gentaz P, Nixon C, Bryce S, Kiourtis C, Sprangers J, Nibbs RJB, Van Rooijen N, Bartholin L, McGreal SR, Apte U, Barry ST, Iredale JP, Clarke AR, Serrano M, Roskams TA, Sansom OJ, Forbes SJ | 2018 | Science Translational Medicine | Metabolism | ISH/FISH | HALO |
| The neurotrophic tyrosine kinase receptor TrkA and its ligand NGF are increased in squamous cell carcinomas of the lung | Gao F, Griffin N, Faulkner S, Rowe CW, Williams L, Roselli S, Thorne RF, Ferdoush A, Jobling P, Walker MM, Hondermarck H | 2018 | Scientific Reports | Oncology | Area Quantification | HALO |
| Tumor Cell Subtypes Based on the Intracellular Hormonal Activity in KCNJ5-Mutated Aldosterone-Producing Adenoma | Yamazaki Y, Omata K, Tezuka Y, Ono Y, Morimoto R, Adachi Y, Ise K, Nakamura Y, Gomez-Sanchez CE, Shibahara Y, Kitamoto T, Nishikawa T, Ito S, Satoh F, Sasano H | 2018 | Hypertension | Oncology | Area Quantification, Cytonuclear | HALO |
| Tuning of delta-protocadherin adhesion through combinatorial diversity | Bisogni AJ, Ghazanfar S, Williams EO, Marsh HM, Yang JYH, Lin DM | 2018 | eLife | Neuroscience | Area Quantification | HALO |
| What is the added value of digital image analysis of HER2 immunohistochemistry in breast cancer in clinical practice? A study with multiple platforms | Koopman T, Buikema HJ, Hollema H, de Bock GH, van der Vegt B | 2018 | Histopathology | Oncology | Membrane | HALO |
| Multidimensional, quantitative assessment of PD-1/PD-L1 expression in patients with Merkel cell carcinoma and association with response to pembrolizumab | Giraldo NA, Nguyen P, Engle EL, Kaunitz GJ, Cottrell TR, Berry S, Green B, Soni A, Cuda JD, Stein JE, Sunshine JC, Succaria F, Xu H, Ogurtsova A, Danilova L, Church CD, Miller NJ, Fling S, Lundgren L, Ramchurren N, Yearley JH, Lipson EJ, Cheever M, Anders RA, Nghiem PT, Topalian SL, Taube JM | 2018 | Journal for ImmunoTherapy of Cancer | Oncology, Immuno-oncology | Spatial Analysis, Serial Section | HALO |
| Methacrylic Acid Copolymer Coating Enhances Constructive Remodeling of Polypropylene Mesh by Increasing the Vascular Response | Coindre VF, Carleton MM, Sefton MV | 2019 | Advanced Healthcare Materials | Biomaterials | Area Quantification | HALO |
| CXCR3 enables recruitment and site-specific bystander activation of memory CD8+ T cells | Maurice NJ, McElrath MJ, Andersen-Nissen E, Frahm N, Prlic M | 2019 | Nature Communications | Immunology | Highplex FL | HALO |
| Epithelial NOTCH Signaling Rewires the Tumor Microenvironment of Colorectal Cancer to Drive Poor-Prognosis Subtypes and Metastasis | Jackstadt R, van Hooff ST, Leach JD, Cortes-Lavaud X, Lohuis JO, Ridgway RA, Wouters VM, JatinRoper J, Kendall TJ, Roxburgh CS, Horgan PG, Nixon C, Nourse C, Gunzer M, Clark W, Hedley A, Yilmaz OH, Rashid M, Bailey P, Biankin AV, Campbell AD, Adams DJ, Barry ST, Steele CW, Medema JP, Sansom OJ | 2019 | Cancer Cell | Oncology | HALO | |
| Ex vivo tissue slice culture system to measure drug-response rates of hepatic metastatic colorectal cancer | Martin SZ, Wagner DC, Hörner N, Horst D, Lang H, Tagscherer KE, Roth W | 2019 | BMC Cancer | Oncology | Classifier, Cytonuclear | HALO |
| Glucose-Dependent Insulinotropic Polypeptide Receptor-Expressing Cells in the Hypothalamus Regulate Food Intake | Adriaenssens AE, Biggs EK, Darwish T, Tadross J, Sukthankar T, Girish M, Polex-Wolf J, Lam BY, Zvetkova I, Pan W, Chiarugi D, Yeo GSH, Blouet C, Gribble FM, Reimann F | 2019 | Cell Metabolism | Metabolism | ISH/FISH | HALO |
| Nuclear Glycogenolysis Modulates Histone Acetylation in Human Non-Small Cell Lung Cancers | Sun RC, Dukhande VV, Zhou Z, Young LEA, Emanuelle S, Brainson CF, Gentry MS | 2019 | Cell Metabolism | Oncology | Multiplex IHC | HALO |
| Inducing and exploiting vulnerabilities for the treatment of liver cancer | Wang C, Vegna S, Jin H, Benedict B, Lieftink C, Ramirez C, de Oliveira RL, Morris B, Gadiot J, Wang W, du Chatinier A, Wang L, Gao D, Evers B, Jin G, Xue Z, Schepers A, Jochems F, Sanchez AM, Mainardi S, te Riele H, Beijersbergen RL, Qin W, Akkari L, Bernards R | 2019 | Nature | Oncology | Multiplex IHC | HALO |
| IRAK4 mediates colitis-induced tumorigenesis and chemoresistance in colorectal cancer | Li Q, Chen Y, Zhang D, Grossman J, Li L, Khurana N, Jiang H, Grierson PM, Herndon J, DeNardo DG, Challen GA, Liu J, Ruzinova MB, Fields RC, Lim K-H | 2019 | JCI Insight | Oncology, Immuno-oncology | Area Quantification | HALO |
| Logic-Gated ROR1 Chimeric Antigen Receptor Expression Rescues T Cell-Mediated Toxicity to Normal Tissues and Enables Selective Tumor Targeting | Srivastava S, Salter A, Liggitt D, Yechan-Gunja S, Sarvothama M, Cooper K, Smythe KS, Dudakov JA, Pierce RH, Rader C, Riddell SR | 2019 | Cancer Cell | Oncology, Immuno-oncology | HALO | |
| Magnetic Resonance Imaging as a Biomarker in Rodent Peripheral Nerve Injury Models Reveals an Age-Related Impairment of Nerve Regeneration | Giorgetti E, Obrecht M, Ronco M, Panesar M, Lambert C, Accart N, Doelemeyer A, Nash M, Bidinosti M, Beckmann N | 2019 | Scientific Reports | Neuroscience | Classifier | HALO |
| MAPKAPK2 (MK2) inhibition mediates radiation-induced inflammatory cytokine production and tumor growth in head and neck squamous cell carcinoma | Berggren KL, Cruz SR, Hixon MD, Cowan AT, Keysar SB, Craig S, James J, Barry M, Ozbun MA, Jimeno A, McCance DJ, Beswick EJ, Gan GN | 2019 | Oncogene | Oncology | Cytonuclear, Figure Maker | HALO |
| Hotspot enumeration of CD8+ tumor infiltrating lymphocyte using digital image analysis in triple negative breast Cancer yields consistent results | McIntire PJ, Zhong E, Patel A, Khani F, D'Alfonso T, Chen Z, Shin SJ, Ginter PS | 2019 | Human Pathology | Oncology | Cytonuclear | HALO |
| Mitogenic and progenitor gene programmes in single pilocytic astrocytoma cells | Reitman ZJ, Paolella BR, Bergthold G, Pelton K, Becker S, Jones R, Sinai CE, Malkin H, Huang Y, Grimmet L, Herbert ZT, Sun Y, Weatherbee JL, Alberta JA, Daley JF, Rozenblatt-Rosen O, Condurat AL, Qian K, Khadka P, Segal RA, Haas-Kogan D, Filbin MG, Suva ML, Regev A, Stiles CD, Kieran MW, Goumnerova L, Ligon KL, Shalek AK, Bandopadhayay P, Beroukhim R | 2019 | Nature Communications | Oncology | HALO | |
| Next-generation computational tools for interrogating cancer immunity | Finotello F, Rieder D, Hackl H, Trajanoski Z | 2019 | Nature Reviews Genetics | Review | HALO | |
| Open radial artery harvesting better preserves endothelial function compared to the endoscopic approach | Gaudino MF, Lorusso R, Ohmes LB, Narula N, McIntire PJ, Gargiulo A, Bucci MR, Leonard J, Rahouma M, Di Franco A, He GW, Girardi LN, Tranbaugh RF, Di Lorenzo A | 2019 | Interdisciplinary CardioVascular and Thoracic Surgery | Other | HALO | |
| Quantification of histopathological findings using a novel image analysis platform | Horai Y, Mizukawa M, Nishina H, Nishikawa S, Ono Y, Takemoto K, Baba N | 2019 | Journal of Toxicologic Pathology | Toxicology | Classifier | HALO |
| Reduction of Global H3K27me3 Enhances HER2/ErbB2 Targeted Therapy | Hirukawa A, Singh S, Wang J, Rennhack JP, Swiatnicki M, Sanguin-Gendreau V, Zuo D, Daldoul K, Lavoie C, Park M, Andrechek ER, Westbrook TF, Harris LN, Varadan V, Smith HW, Muller WJ | 2019 | Cell Reports | Oncology | Highplex FL | HALO |
| Single cell transcriptomic profiling of large intestinal enteroendocrine cells in mice - Identification of selective stimuli for insulin-like peptide-5 and glucagon-like peptide-1 co-expressing cells | Billing LJ, Larraufie P, Lewis J, Leiter A, Li J, Lam B, Yeo GSH, Goldspink DA, Kay RG, Gribble FM, Reimann F | 2019 | Molecular Metabolism | Metabolism | HALO | |
| Single-Cell Quantification of mRNA Expression in The Human Brain | Jolly S, Lang V, Koelzer VH, Frigerio CS, Magno L, Salinas PC, Whiting P, Palomer E | 2019 | Scientific Reports | Neuroscience | ISH/FISH | HALO |
| Detection of Lung Cancer Lymph Node Metastases from Whole-Slide Histopathologic Images Using a Two-Step Deep Learning Approach | Pham HHN, Futakuchi M, Bychkov A, Furukawa T, Kuroda K, Fukuoka J | 2019 | The American Journal of Pathology | Oncology | Classifier | HALO, HALO AI |
| Role of IL-15 Signaling in the Pathogenesis of Simian Immunodeficiency Virus Infection in Rhesus Macaques | Okoye AA, DeGottardi MQ, FukazawaY, Vaidya M, Abana CO, Konfe AL, Fachko DN, Duell DM, He Li H, Lum R, Gao L, Park BS, Skalsky RL, Lewis AD, Axthelm MK, Lifson JD, Wong SW, Picker LJ | 2019 | The Journal of Immunology | Infectious Disease | Cytonuclear, Figure Maker | HALO |
| TNF-α Contributes to Lymphoid Tissue Disorganization and Germinal Center B Cell Suppression during Intracellular Bacterial Infection | Popescu M, Cabrera-Martinez B, Winslow GM | 2019 | The Journal of Immunology | Immunology | Cytonuclear | HALO |
| The role of WNT10B in normal prostate gland development and prostate cancer | Madueke I, Hu W-Y, Hu D, Swanson SM, Griend DV, Abern M, Prins GS | 2019 | The Prostate | Oncology | Multiplex IHC, TMA | HALO, HALO AI |
| A MYC–GCN2–eIF2α negative feedback loop limits protein synthesis to prevent MYC-dependent apoptosis in colorectal cancer | Schmidt S, Gay D, Uthe FW, Denk S, Paauwe M, Matthes N, Diefenbacher ME, Bryson S, Warrander FC, Erhard F, Ade CP, Baluapuri A, Walz S, Jackstadt R, Ford C, Vlachogiannis G, Valeri N, Otto C, Schülein-Völk C, Maurus K, Schmitz W, Knight JRP, Wolf E, Strathdee D, Schulze A, Germer C-T, Rosenwald A, Sansom OJ, Eilers M | 2019 | Nature Cell Biology | Oncology | HALO | |
| Farnesoid X Receptor Agonism, AcetylCoenzyme A Carboxylase Inhibition, and Back Translation of Clinically Observed Endpoints of De Novo Lipogenesis in a Murine NASH Model | Gapp B, Jourdain M, Bringer P, Kueng B, Weber D, Osmont A, Zurbruegg S, Knehr J, Falchetto R, Roma G, Dietrich W, Valdez R, Beckmann N, Nigsch F, Sanyal AJ, Ksiazek I | 2019 | Hepatology Communications | Metabolism | Cytonuclear | HALO |
| Modulation of Microglia by Voluntary Exercise or CSF1R Inhibition Prevents Age-Related Loss of Functional Motor Units | Giorgetti E, Panesar M, Zhang Y, Joller S, Ronco M, Obrecht M, Lambert C, Accart N, Beckmann N, Doelemeyer A, Perrot L, Fruh I, Mueller M, Pierrel E, Summermatter S, Bidinosti M, Shimshek DR, Brachat S, Nash M | 2019 | Cell Reports | Neuroscience | Classifier, Cytonuclear | HALO |
| Persistence of inflammatory phenotype in residual psoriatic plaques in patients on effective biologic therapy: Residual Psoriatic Plaques After Treatment | Mashiko S, Edelmayer RM, Bi Y, Olson LM, Wetter JB, Wang J, Maari C, Proulx ES-C, Kaimal V, Li X, Salte K, Garcet S, Kannan AK, Huang SM, Cao X, Liu Z, Krueger JG, Sarfati M, Bissonnette R, Smith KM | 2019 | Journal of Investigative Dermatology | Immunology, Dermatology | Area Quantification | HALO |
| Alzheimer’s disease tau is a prominent pathology in LRRK2 Parkinson’s disease | Henderson MX, Sengupta M, Trojanowski JQ, Lee VMY | 2019 | Acta Neuropathologica Communications | Neuroscience | Area Quantification | HALO |
| Amyloid-Beta (Aβ) Plaques Promote Seeding and Spreading of Alpha-Synuclein and Tau in a Mouse Model of Lewy Body Disorders with Aβ Pathology | Bassil F, Brown HJ, Pattabhiraman S, Iwasyk JE, Maghames CM, Meymand ES, Cox TO, Riddle FM, BinZhang N, Trojanowski JQ, Lee VM-Y | 2019 | Neuron | Neuroscience | HALO | |
| The KDM5A/RBP2 histone demethylase represses NOTCH signaling to sustain neuroendocrine differentiation and promote small cell lung cancer tumorigenesis | Oser MG, Sabet AH, Gao W, Chakraborty AA, Schinzel AC, Jennings RB, Fonseca R, Bonal DM, Booker MA, Flaifel A, Novak JS, Christensen VL, Zhang H, Herbert ZT, Tolstorukov MY, Buss EJ, Wong K-K, Bronson RT, Nguyen Q-D, Signoretti S, Kaelin Jr WG | 2019 | Genes & Development | Oncology | Multiplex IHC | HALO |
| Alzheimer Disease Pathology-Associated Polymorphism in a Complex Variable Number of Tandem Repeat Region Within the MUC6 Gene, Near the AP2A2 Gene | Katsumata Y, Fardo DW, Bachstetter AD, Artiushin SC, Wang W-X, Wei A, Brzezinski LJ, Nelson BG, Huang Q, Abner EL, Anderson S, Patel I, Shaw BC, Price DA, Niedowicz DM, Wilcock DW, Jicha GA, Neltner JH, Van Eldik LJ, Estus S, Nelson PT | 2019 | Journal of Neuropathology & Experimental Neurology | Neuroscience | Area Quantification, Cytonuclear | HALO |
| Branched Photoswitchable Tethered Ligands Enable Ultra-efficient Optical Control and Detection of G Protein-Coupled Receptors In Vivo | Acosta-Ruiz A, Gutzeit VA, Skelly MJ, Meadows S, Lee J, Parekh P, Orr AG, Liston C, Pleil KE, Broichhagan J, Levitz J | 2019 | Neuron | Neuroscience | HALO | |
| Histological characterization of aldosterone-producing adrenocortical adenomas with different somatic mutations | Ono Y, Yamazaki Y, Omata K, Else T, Tomlins SA, Rhayem Y, Williams TA, Reincke M, Carling T, Monticone S, Mulatero P, Beuschlein F, Ito S, Satoh F, Rainey WE, Sasano H | 2019 | The Journal of Clinical Endocrinology & Metabolism | Oncology | Classifier, Area Quantification | HALO |
| PAK4 inhibition improves PD-1 blockade immunotherapy | Abril-Rodriguez G, Torrejon DY, Liu W, Zaretsky JM, Nowick TS, Tsoi J, Puig-Saus C, Baselga-Carretero I, Medina E, Quist MJ, Garcia AJ, Senapedis W, Baloglu E, Kalbasi A, Cheung-Lau G, Berent-Maoz B, Comin-Anduix B, Hu-Lieskovan S, Wang C-Y, Grasso CS, Ribas A | 2019 | Nature Cancer | Immuno-oncology | HALO | |
| Characterization of novel conformation-selective α-synuclein antibodies as potential immunotherapeutic agents for Parkinson's disease | Henderson MX, Covell DJ, Chung C-HY, Pitkin RM, Sandler RM, Decker SC, Riddle DM, Zhang B, Gathagan RJ, James MJ, Trojanowski JQ, Brunden KR, Lee VMY, Luk KC | 2019 | Neurobiology of Disease | Neuroscience | Area Quantification | HALO |
| Epithelial to mesenchymal plasticity and differential response to therapies in pancreatic ductal adenocarcinoma | Porter RL, Magnus NKC, Thapar V, Morris R, Szabolcs A, Neyaz A, Kulkarni AS, Tai E, Chougule A, Hillis A, Golczer G, Guo H, Yamada T, Kurokawa T, Yashaswini C, Ligorio M, Vo KD, Nieman L, Liss AS, Deshpande V, Lawrence MS, Maheswaran S, Fernandez-Del Castillo C, Hong TS, Ryan DP, O’Dwyer PJ, Drebin JA, Ferrone CR, Haber DA, Ting DT | 2019 | Proceedings of the National Academy of Sciences | Oncology | Area Quantification | HALO |
| Macrophage-Derived CXCL9 and CXCL10 Are Required for Antitumor Immune Responses Following Immune Checkpoint Blockade | House IG, Savas P, Lai J, Chen AXY, Oliver AJ, Teo ZL, Todd KL, Henderson MA, Giuffrida L, Petley EV, Sek K, Mardiana S, Gide TN, Quek C, Scolyer RA, Long GV, Wilmott JS, Loi S, Darcy PK, Beavis PA | 2019 | Clinical Cancer Research | Immuno-oncology | Highplex FL | HALO |
| Validation and characterisation of prognostically significant PD-L1+ immune cells in HPV+ oropharyngeal squamous cell carcinoma | Young RJ, Bressel M, Porceddu S, Cernelc J, Savas P, Liu H, Urban D, Thai AA, Cooper C, Fua T, Neeson P, Rischin D, Solomon B | 2019 | Oral Oncology | Oncology, Infectious Disease | Classifier, Highplex FL | HALO |
| Targeting glutamate metabolism in melanoma | Singh S, Shah R, Chen S, Filipp FV | 2019 | arXiv | Oncology, Metabolism | HALO | |
| Neutrophil content predicts lymphocyte depletion and anti-PD1 treatment failure in NSCLC | Kargl J, Zhu X, Zhang H, Yang GHY, Friesen TJ, Shipley M, Maeda DY, Zebala JA, McKay-Fleisch J, Meredith G, Mashadi-Hossein A, Baik C, Pierce RH, Redman MW, Thompson JC, Albelda SM, Bolouri H, Houghton AM | 2019 | JCI Insight | Immuno-oncology | Classifier, Highplex FL | HALO |
| Multiplex Immunofluorescence of Bone Marrow Core Biopsies: Visualizing the Bone Marrow Immune Contexture | Walters DK, Jelinek DF | 2019 | Journal of Histochemistry & Cytochemistry | Immunology | Spatial Analysis, Highplex FL | HALO |
| Oral tenofovir disoproxil fumarate/emtricitabine for HIV pre-exposure prophylaxis increases expression of type I/III interferon-stimulated factors in the gastrointestinal tract but not in the blood | Hughes SM, Levy CN, Calienes F, Stekler JD, Pandey U, Vojtech L, Berard AR, Birse K, Noel-Romas L, Richardson B, Golden J, Cartwright M, Collier AC, Stevens CE, Curlin ME, Holtz TH, Mugo N, Irungu E, Katabira E, Muwonge T, Lama JR, Baeten JM, Burgener A, Lingappa JR, McElrath MJ, Mackelprang R, McGowan I, Cranston RD, Cameron MJ, Hladik F | 2019 | bioRxiv | Infectious Disease | Cytonuclear | HALO |
| Evaluation of Peritumoral Fibrosis in Metastatic Colorectal Adenocarcinoma to the Liver Using Digital Image Analysis | Waters KM, Cottrell TR, Besharati S, Zhu Q, Anders RA | 2019 | American Journal of Clinical Pathology | Oncology | Area Quantification | HALO |
| A Deep Learning Convolutional Neural Network Can Recognize Common Patterns of Injury in Gastric Pathology | Martin DR, Hanson JA, Gullapalli RR, Schultz FA, Sethi A, Clark DP | 2019 | Archives of Pathology and Laboratory Medicine | Gastroenterology | HALO, HALO AI | |
| Divergent patterns of TDP‐43 and tau pathologies in primary progressive aphasia | Giannini LAA, Xie SX, McMillan CT, Liang M, Williams A, Jester C, Rascovsky K, Wolk DA, Ash S, Lee EB, Trojanowski JQ, Grossman M, Irwin DJ | 2019 | Annals of Neurology | Neuroscience | Area Quantification | HALO |
| A Short Isoform of Coagulation Factor XII mRNA Is Expressed by Neurons in the Human Brain | Zamolodchikov D, Bai Y, Tang Y, McWhirter JR, Macdonald LE, Alessandri-Haber N | 2019 | Neuroscience | Neuroscience | Figure Maker | HALO |
| Automated macrophage counting in DLBCL tissue samples: a ROF filter based approach | Wagner M, Hansel R, Reinke S, Richter J, Altenbuchinger M, Braumann U-D, Spang R, Loffler Mk Klapper W | 2019 | Biological Proectures Online | Oncology | Object Colocalization | HALO |
| Delayed Azithromycin Treatment Improves Recovery After Mouse Spinal Cord Injury | Kopper TJ, McFarlane KE, Bailey WM, Orr MB, Zhang B, Gensel JC | 2019 | Frontiers in Cellular Neuroscience | Neuroscience | HALO | |
| Efficacy of ruthenium coordination complex–based Rutherrin in a preclinical rat glioblastoma model | Munegowda MA, Fisher C, Molehuis D, Foltz W, Roufaiel M, Bassan J, Nitz M, Mandel A, Lilge L | 2019 | Neuro-Oncology Advances | Neuroscience | HALO | |
| Empiric Methods to Account for Pre-analytical Variability in Digital Histopathology in Frontotemporal Lobar Degeneration | Giannini LAA, Xie SX, Peterson C, Zhou C, Lee EB, Wolk DA, Grossman M, Trojanowski JQ, McMillan CT, Irwin DJ | 2019 | Frontiers in Neuroscience | Neuroscience | Area Quantification, Registration, Figure Maker | HALO |
| Expression of cholecystokinin by neurons in mouse spinal dorsal horn | Guitierrez-Mecinas M, Bell AM, Shepherd F, Polgar E, Watanabe M, Furuta T, Todd AJ | 2019 | The Journal of Comparative Neurology | Neuroscience | ISH/FISH | HALO |
| Human 3D Gastrointestinal Microtissue Barrier Function As a Predictor of Drug-Induced Diarrhea | Peters MF, Landry T, Pin C, Maratea K, Dick C, Wagoner MP, Choy AL, Barthlow H, Snow D, Stevens Z, Armento A, Scott CW, Ayehunie S | 2019 | Toxicological Sciences | Toxicology | HALO | |
| Tumor Characteristics Associated with Benefit from Pembrolizumab in Advanced Non–Small Cell Lung Cancer | Hu-Lieskovan S, Lisberg A, Zaretsky JM, Grogan TR, Rizvi H, Wells DK, Carroll J, Cummings A, Madrigal J, Jones B, Gukasyan J, Shintaku IP, Slamon D, Dubinett S, Goldman JW, Elashoff D, Hellmann MD, Ribas A, Garon EB | 2019 | Clinical Cancer Research | Immuno-oncology | Cytonuclear | HALO |
| Exposure to maternal obesity programs sex differences in pancreatic islets of the offspring in mice | Nicholas LM, Nagao M, Kusinski LC, Fernandez-Twinn DS, Eliasson L, Ozanne SE | 2019 | Diabetologia | Metabolism | Area Quantification | HALO |
| MEDI3039, a novel highly potent tumor necrosis factor (TNF)-related apoptosis-inducing ligand (TRAIL) receptor 2 agonist, causes regression of orthotopic tumors and inhibits outgrowth of metastatic triple-negative breast cancer | Greer YE, Gilbert SF, Gril B, Narwal R, Brooks DLP, Tice DA, Steeg PS, Lipkowitz | 2019 | Breast Cancer Research | Oncology | Classifier | HALO |
| Precision immunoprofiling by image analysis and artificial intelligence | Koelzer VH, Sirinukunwattana K, Rittscher J, Mertz KD | 2019 | Vichows Archiv | Review | Classifier, Multiplex IHC, Spatial Analysis | HALO |
| Myeloid Cell-Derived HB-EGF Drives Tissue Recovery After Pancreatitis | Wen H-J, Gao S, Wang Y, Ray M, Magnuson MA, Wright CVE, Di Magliano MP, Frankel TL, Crawford HC | 2019 | Cellular and Molecular Gastroenterology and Hepatology | Immunology | HALO | |
| Impact of pre‐therapy glioblastoma multiforme microenvironment on clinical response to autologous CMV‐specific T‐cell therapy | Walker DG, Shakya R, Morrison B, Neller MA, Matthews KK, Nicholls J, Smith C, Khanna R | 2019 | Clinical & Translational Immunology | Immuno-oncology | Classifier | HALO |
| Lenvatinib plus anti-PD-1 antibody combination treatment activates CD8+ T cells through reduction of tumor-associated macrophage and activation of the interferon pathway | Kato Y, Tabata K, Kimura T, Yachie-Kinoshita A, Ozawa Y, Yamada K, Ito J, Tachino S, Hori Y, Matsuki M, Matsuoka Y, Ghosh S, Kitano H, Nomoto K, Matsui J, Funahashi Y | 2019 | PLOS One | Immuno-oncology | HALO | |
| Long-Term Persistence of Anti-HIV Broadly Neutralizing Antibody-Secreting Hematopoietic Cells in Humanized Mice | Kuhlmann A-S, Haworth KG, Barber-Axthelm IM, Ironside C, Giese MA, Peterson CW, Kiem H-P | 2019 | Molecular Therapy | Infectious Disease | Figure Maker | HALO |
| Pre-diagnostic anthropometry, sex, and risk of colorectal cancer according to tumor immune cell composition | Berntsson J, Eberhard J, Nodin B, Leandersson K, Larsson AH, Eberhard J, Jirstrom K | 2019 | OncoImmunology | Immuno-oncology | HALO | |
| Prohibitin is a prognostic marker of relapse and therapeutic target to block chemotherapy resistance in Wilms tumor | Ortiz MV, Ahmed S, Burns M, Henssen AG, Hollmann TJ, MacArthur I, Gunasekera S, Gaewsky L, Bradwin G, Ryan J, Letai A, He Y, Naranjo A, Chi Y-Y, LaQuaglia M, Heaton T, Cifani P, Dome JS, Gadd S, Perlman E, Mullen E, Steen H, Kentsis A | 2019 | JCI Insight | Oncology | Cytonuclear | HALO |
| Extramammary Paget disease shows differential expression of B7 family members B7-H3, B7-H4, PD-L1, PD-L2 and cancer/testis antigens NY-ESO-1 and MAGE-A | Pourmaleki M, Young JH, Socci ND, Chiang S, Edelweiss M, Li Y, Zhang M, Roshal L, Chi DS, Busam KJ, Mellinghoff IK, Hollmann TJ | 2019 | Oncotarget | Oncology, Immuno-oncology | HALO | |
| A phase 2 study of GVAX colon vaccine with cyclophosphamide and pembrolizumab in patients with mismatch repair proficient advanced colorectal cancer | Yarchoan M, Huang C-Y, Zhu Q, Ferguson AK, Durham JN, Anders RA, Thompson ED, Rozich NS, Thomas DL, Nauroth JM, Rodriguez C, Osipov A, De Jesus-Acosta A, Le DT, Murphy AG, Laheru D, Donehower RC, Jaffee EM, Zheng L, Azad NS | 2019 | Cancer Medicine | Immuno-oncology | Area Quantification | HALO |
| Advanced Prostate Cancer with ATM Loss: PARP and ATR Inhibitors | Neeb A, Herranz N, Arce-Gallego S, Miranda S, Lorenzo Buroni L, Wei Yuan W, Alejandro Athie A, Teresa Casals T, Juliet Carmichael J, Daniel Nava Rodrigues DN, Bora Gurel B, Pasquale Rescigno P, Jan Rekowski J, Jon Welti J, Ruth Riisnaes R, Veronica Gil V, Jian Ning J, Verena Wagner, Irene Casanova-Salas I, Cordoba S, Natalia Castro N, Maria Dolores Fenor de la Maza, George Seed, Khobe Chandran, Ana Ferreira A, Ines Figueiredo I, Claudia Bertan, Diletta Bianchini, Caterina Aversa, Alec Paschalis A, Macarena Gonzalez N, Rafael Morales-Barrera, Cristina Suarez C, Joan Carles J, Amanda Swain A, Adam Sharp A, Jesus Gil, Violeta Serra, Christopher Lord, Suzanne Carreira S, Joaquin Mateo, Johann S. de Bono JS | 2019 | European Urology | Oncology | HALO, HALO AI | |
| Accelerated phosphatidylcholine turnover in macrophages promotes adipose tissue inflammation in obesity | Petkevicius K, Virtue S, Bidault G, Jenkins B, Cubuk C, Morgantini C, Aouadi M, Dopazo J, Serlie M, Koulman A, Vidal-Puig A | 2019 | Elife | Immunology | Classifier, Vacuole | HALO, HALO AI |
| Detection of Lung Cancer from Whole-Slide Histopathologic Images Using Deep Learning Approach | Mishra N, Behera P, Nanda R, Sahoo M | 2019 | International Journal of Research in Engineering and Sciences | Oncology | Classifier | HALO, HALO AI |
| HIF-independent synthetic lethality between CDK4/6 inhibition and VHL loss across species | Nicholson HE, Tariq Z, Housden BE, Jennings RB, Stransky LA, Perrimon N, Signoretti S, Kaelin WG | 2019 | Science Signaling | Oncology | HALO | |
| Impact of TREM2 risk variants on brain region-specific immune activation and plaque microenvironment in Alzheimer’s disease patient brain samples | Prokop S, Miller KR, Labra SR, Pitkin RM, Hoxha K, Narasimhan S, Changolkar L, Rosenbloom A, Lee VM-Y, Trojanowski JQ | 2019 | Acta Neuropathologica | Neuroscience | Classifier, Area Quantification | HALO |
| Mobilization of CD8+ T cells via CXCR4 blockade facilitates PD-1 checkpoint therapy in human pancreatic cancer | Seo YD, Jiang X, Sullivan KM, Jalikis FG, Smythe KS, Abbasi A, Vignali M, Park JO, Daniel SK, Pollack SM, Kim TS, Yeung R, Crispe IN, Pierce RH, Robins H, Pillarisetty VG | 2019 | Clinical Cancer Research | Immuno-oncology | Cytonuclear | HALO |
| Temporal Analysis of Amylase Expression in Control, Autoantibody Positive, and Type 1 Diabetes Pancreatic Tissues | Kusmartseva I, Beery M, Hiller H, Padilla M, Selman S, Posgai A, Nick HS, Campbell-Thompson M, Schatz DA, Haller MJ, Wasserfall CH, Atkinson MA | 2019 | Diabetes | Metabolism | Cytonuclear | HALO |
| Kras and Lkb1 mutations synergistically induce intraductal papillary mucinous neoplasm derived from pancreatic duct cells | Collet L, Ghurburrun E, Meyers N, Assi M, Pirlot B, Leclercq IA, Couvelard A, Komuta M, Cros J, Demetter P, Lemaigre FP, Borbath I, Jacquemin P | 2019 | Gut | Oncology | Area Quantification | HALO |
| Phosphorylation of connexin 43 at MAPK, PKC or CK1 sites each distinctly alter the kinetics of epidermal wound repair | Lastwika JK, Dunn CA, Solan JL, Lampe PD | 2019 | Journal of Cell Science | Dermatology | Cytonuclear | HALO |
| Quantitative digital image analysis of tumor-infiltrating lymphocytes in HER2-positive breast cancer | Abe N, Matsumoto H, Takamatsu R, Tamaki K, Takigami N, Uehara K, Kamada Y, Tamaki N, Motonari T, Unesoko M, Nakada N, Zaha N, Zaha H, Yoshimi N | 2019 | Vichows Archiv | Oncology | Classifier, Cytonuclear | HALO |
| Tumor Platinum Concentrations and Pathological Responses Following Cisplatin-Containing Chemotherapy in Gastric Cancer Patients | Cao Y, Chang Q, Cabanero M, Zhang W, Hafezi-Bakhtiari S, Hedley D, Darling G, Quereshy F, Jang R, Elimova E, Knox J, Ornatsky O, Serra S, Chen E | 2019 | Journal of Gastrointestinal Cancer | Oncology | Area Quantification, Cytonuclear | HALO |
| Using immuno-PET imaging to monitor kinetics of T cell-mediated inflammation and treatment efficiency in a humanized mouse model for GvHD | Pektor S, Schlöder J, Klasen B, Bausbacher N, Wagner D-C, Schreckenberger W, Grabbe S, Jonuleit H, Miederer M | 2019 | European Journal of Nuclear Medicine and Molecular Imaging | Immunology | Cytonuclear | HALO |
| Effects of advanced age upon astrocyte-specific responses to acute traumatic brain injury in mice | Early AN, Gorman AA, Van Eldik LJ, Bachstetter AD, Morganti JM | 2019 | Journal of Neuroinflammation | Neuroscience | Area Quantification | HALO |
| FK506-binding protein 13 expression is upregulated in interstitial lung disease and correlated with clinical severity: a potentially protective role | Tat V, Ayaub EA, Ayoub A, Vierhout M, Naiel S, Padwal MK, Abed S, Mekhael O, Tandon K, Revill SD, Yousof T, Bellaye PS, Kolb PS, Dvorkin-Gheva A, Naqvi A, Cutz JC , Hambly N, Kato J, Vaughan M, Moss J, Kolb MRJ, Ask K | 2019 | American Journal of Respiratory Cell and Molecular Biology | Immunology, Fibrosis | Area Quantification | HALO |
| Microbial regulation of enteric eosinophils and its impact on tissue remodeling and Th2 immunity | Jimenez-Saiz R, Anipindi VC, Galipeau H, Ellenbogen Y, Chaudhary R, Koenig JF, Gordon ME, Walker TD, Mandur TS, Abed S, Humbles A, Chu DK, Ask K, Verdu EF, Jordana M | 2019 | Frontiers in Immunology | Immunology, Infectious Disease | Area Quantification | HALO |
| Distinct fibroblast functional states drive clinical outcomes in ovarian cancer and are regulated by TCF21 | Hussain A, Voisin V, Poon S, Dmytryshyn J ,Richman C, Meens J, Ho VW, Tang KH, Paterson J, Clarke B, Bernardini M, Bader G, Neel B, Ailles L | 2019 | Journal of Experimental Medicine | Oncology | Classifier, Area Quantification | HALO |
| Integrated human pseudoislet system and microfluidic platform demonstrate differences in GPCR signaling in islet cells | Walker JT, Haliyur R, Nelson HA, Ishahak M, Poffenberger G, Aramandla R, Reihsmann C, Luchsinger JR, Saunders DC, Wang P, Garcia-Ocana A, Bottino R, Agarwal A, Powers AC, Brissove M | 2019 | bioRxiv | Gastroenterology | HALO | |
| Cross-Platform Comparison of Computer-assisted Image Analysis Quantification of In Situ mRNA Hybridization in Investigative Pathology | Holzer TR, Hanson JC, Wray EM, Bailey JA, Kennedy KR, Finnegan PR, Nasir A, Credille KM | 2019 | Applied Immunohistochemistry & Molecular Morpholgy | Other | ISH/FISH | HALO |
| Immune evasion before tumour invasion in early lung squamous carcinogenesis | Mascaux C, Angelova M, Vasaturo A, Beane J, Hijazi K, Anthoine G, Rothe F, Willard-Gallo K, Haller A, Ninane V, Burny A, Sculier J-P, Spira A, Galon J | 2019 | Nature | Oncology, Immuno-oncology | Multiplex IHC | HALO |
| IL‐1α cleavage by inflammatory caspases of the noncanonical inflammasome controls the senescence‐associated secretory phenotype | Wiggins KA, Parry AJ, Cassidy LD, Humphry M, Webster SJ, Goodall JC, Narita M, Clarke MCH | 2019 | Aging Cell | Immunology | Cytonuclear | HALO |
| Cognitive and Pathological Influences of Tau Pathology in Lewy Body Disorders | Coughlin DG, Xie SX, Liang M, Williams A, Peterson C, Weintraub D, McMillan CT, Wolk DA, Akhtar RS, Hurtig H, Coslett HB, Hamilton R, Siderowf A, Duda JE, Rascovsky K, Lee EB, Lee VM-Y, Grossman M, Trojanowski JQ, Irwin DJ | 2019 | Annals of Neurology | Neuroscience | Classifier, Area Quantification | HALO |
| A single dose of neoadjuvant PD-1 blockade predicts clinical outcomes in resectable melanoma | Huang AC, Orlowski RJ, Xu X, Mick R, George SM, Yan PK, Manne S, Kraya AA, Wubbenhorst B, Dorfman L, D’Andrea K, Wenz BM, Liu S, Chilukuri L, Kozlov A, Carberry M, Giles L, Kier MW, Quagliarello F, McGettigan S, Kreider K, Annamalai L, Zhao Q, Mogg R, Xu W, Blumenschein WM, Yearley JH, Linette GP, Amaravadi RK, Schuchter LM, Herati RS, Bengsch B, Nathanson KL, Farwell MD, Karakousis GC, Wherry EJ, Mitchell TC | 2019 | Nature Medicine | Oncology, Immuno-oncology | Highplex FL | HALO |
| Active Cushing’s Disease is Characterized by Increased Adipose Tissue Macrophage Presence | Lee IT, Atuahene A, Egritag HE, Buettner C, Wang L, Geer EB, Donovan M | 2019 | The Journal of Clinical Endocrinology & Metabolism | Metabolism | HALO | |
| Alpha-synuclein is a DNA binding protein that modulates DNA repair with implications for Lewy body disorders | Schaser AJ, Osterberg VR, Dent SE, Stackhouse TL, Wakeham CM, Boutros SW, Weston LJ, Owen N, Weissman TA, Luna E, Raber J, Luk KC, McCullough AK, Woltjer RL, Unni VK | 2019 | Scientific Reports | Neuroscience | ISH/FISH | HALO |
| Alterations of the MEK/ERK, BMP, and Wnt/β-catenin pathways detected in the blood of individuals with lymphatic malformations | Kim T, Tafoya E, Chelliah MP, Lekwuttikarn R, Li J, Sarin KY, Teng J | 2019 | PLOS One | Other | Cytonuclear | HALO |
| Assessment of PD-L1 mRNA and protein expression in non-small cell lung cancer, head and neck squamous cell carcinoma and urothelial carcinoma tissue specimens using RNAScope and immunohistochemistry | Duncan DJ, Scott M, Scorer P, Barker C | 2019 | PLOS One | Oncology, Immuno-oncology | ISH/FISH | HALO |
| ATDC is required for the initiation of KRAS-induced pancreatic tumorigenesis | Wang L, Yang H, Zamperone A, Diolaiti D, Palmbos PL, Abel EV, Purohit V, Dolgalev I, Rhim AD, Ljungman M, Hadju CH, Halbrook CJ, Bar-Sagi D, di Magliano MP, Crawford HC, Simeone DM | 2019 | Genes & Development | Oncology | HALO | |
| Automated Computational Detection, Quantitation, and Mapping of Mitosis in Whole‑Slide Images for Clinically Actionable Surgical Pathology Decision Support | Puri M, Hoover S, Hewitt S, Wei B-R, Adissu H, Halsey C, Beck J, Bradley C, Cramer S, Durham A, Esplin D, Frank C, Lyle L, McGill L, Sanchez M, Schaffer P, Traslavina R, Buza E, Yang H, Lee M, Dwyer J, Simpson R | 2019 | Journal of Pathology Informatics | Oncology | Cytonuclear | HALO |
| Calpain 9 as a therapeutic target in TGFβ-induced mesenchymal transition and fibrosis | Kim DH, Beckett JD, Nagpal V, Seman-Senderos MA, Gould Russell A, Creamer TJ, MacFarlane EG, Chen Y, Bedja D, Butcher JT, Mitzner W, Rouf R, Hata S, Warren DS, Dietz HC | 2019 | Science Translational Medicine | Fibrosis | HALO | |
| CCN3/Nephroblastoma Overexpressed Is a Functional Mediator of Prostate Cancer Bone Metastasis That Is Associated with Poor Patient Prognosis | Dankner M, Ouellet V, Communal L, Schmitt E, Perkins D, Annis MG, Barrès V, Caron C, Mes-Masson A-M, Saad F, Siegel PM | 2019 | The American Journal of Pathology | Oncology | Area Quantification | HALO |
| Changes in epidermal morphology associated with dandruff | Pople JE, Bhogal RK, Moore AE, Jenkins G | 2019 | International Journal of Cosmetic Science | Dermatology | Cytonuclear | HALO |
| Characterization of psoriasiform dermatitis induced by systemic injection of interleukin‐23 minicircles in mice | Leys L, Wang Y, Paulsboe S, Edelmayer R, Salte K, Wetter J, Namovic M, Phillips L, Dunstan R, Gauvin D, Donnelly-Roberts D, Su Z, Honore P, McGaraughty S | 2019 | The Journal of Dermatology | Dermatology | Area Quantification | HALO |
| Citrullination of fibronectin alters integrin clustering and focal adhesion stability promoting stromal cell invasion | Stefanelli VL, Choudhury S, Hu P, Liu Y, Schwenzer A, Yeh C-R, Chambers DM, Pesson K, Li W, Segura T, Midwood KS, Torres M, Barker TH | 2019 | Matrix Biology | Oncology, Fibrosis | HALO | |
| Delta-like protein 3 expression and therapeutic targeting in neuroendocrine prostate cancer | Puca L, Gavyert K, Sailer V, Conteduca V, Dardenne E, Sigouros M, Isse K, Kearney M, Vosoughi A, Fernandez L, Pan H, Motanagh S, Hess J, Donoghue AJ, Sboner A, Wang Y, Dittamore R, Rickman D, Nanus DM, Tagawa ST, Elemento O, Mosquera JM, Saunders L, Beltran H | 2019 | Science Translational Medicine | Oncology | HALO | |
| Detection and quantification of Parascaris P-glycoprotein drug transporter expression with a novel mRNA hybridization technique | Chelladurai JJ, Brewer MT | 2019 | Veterinary Parasitology | Infectious Disease | ISH/FISH | HALO |
| Development of resistance to FAK inhibition in pancreatic cancer is linked to stromal depletion | Jiang H, Liu X, Knolhoff BL, Hegde S, Lee KB, Jiang H, Fields RC, Pachter JA, Lim K-H, DeNardo DG | 2019 | Gut | Oncology | Cytonuclear, ISH/FISH | HALO |
| Dynamic changes to lipid mediators support transitions among macrophage subtypes during muscle regeneration | Giannakis N, Sansbury BE, Patsalos A, Hays TT, Riley CO, Han X, Spite M, Nagy L | 2019 | Nature Immunology | Immunology, Myology | Muscle Fiber | HALO |
| Expression of avian β-defensin mRNA in the chicken yolk sac | Zhang H, Wong EA | 2019 | Developmental & Comparative Immunology | Immunology | ISH/FISH | HALO |
| Female-biased embryonic death from inflammation induced by genomic instability | McNairn AJ, Chuang C-H, Bloom JC, Wallace MD, Schimenti JC | 2019 | Nature | Immunology | Cytonuclear | HALO |
| Genetic mutations underlying phenotypic plasticity in basosquamous carcinoma | Chiang A, Tan CZ, Kuonen F, Hodgkinson LM, Chiang F, Cho RJ, South AP, Tang Jean Y, Chang ALS, Rieger KE, Oro AE, Sarin KY | 2019 | Journal of Investigative Dermatology | Oncology | Cytonuclear | HALO |
| Impact of a Pre-Operative Exercise Intervention on Breast Cancer Proliferation and Gene Expression: Results from the Pre-Operative Health and Body (PreHAB) Study | Ligibel JA, Dillon D, Giobbie-Hurder A, McTiernan A, Frank E, Cornwell M, Pun M, Campbell N, Dowling RJO, Chang MC, Tolaney S, Chagpar AB, Yung RL, Freedman RA, Dominici LS, Golshan M, Rhei E, Taneja K, Huang Y, Brown M, Winer EP, Jeselsohn R, Irwin ML | 2019 | Clinical Cancer Research | Oncology | HALO | |
| IL‐36 receptor antagonistic antibodies inhibit inflammatory responses in preclinical models of psoriasiform dermatitis | Su Z, Paulsboe S, Wetter J, Salte K, Kannan A, Mathew S, Horowitz A, Gerstein C, Namovic M, Todorović V, Seagal J, Edelmayer RM, Viner M, Rinaldi L, Zhou L, Leys L, Huang S, Wang L, Sadhukhan R, Honore P, McGaraughty S, Scott VE | 2019 | Experimental Dermatology | Dermatology | Area Quantification, Cytonuclear | HALO |
| IL-7-dependent compositional changes within the γδ T cell pool in lymph nodes during ageing lead to an unbalanced anti-tumour response | Chen H-C, Eling N, Martinez-Jimenez CP, O'Brien LM, Carbonaro V, Marioni JC, Odom DT, de la Roche M | 2019 | EMBO Reports | Oncology, Immuno-oncology | ISH/FISH | HALO |
| Imaging Mass Spectrometry and Proteome Analysis of Marek’s Disease Virus-Induced Tumors | Pauker VI, Bertzbach LD, Hohmann A, Kheimar A, Teifke JP, Mettenleiter TC, Karger A, Kaufe BB | 2019 | mSphere | Oncology | Cytonuclear | HALO |
| PD-L1 Expression and Clinical Outcomes to Cabozantinib, Everolimus, and Sunitinib in Patients with Metastatic Renal Cell Carcinoma: Analysis of the Randomized Clinical Trials METEOR and CABOSUN | Flaifel A, Xie W, Braun DA, Ficial M, Bakouny Z, Nassar AH, Jennings RB, Escudier B, George DJ, Motzer RJ, Morris MJ, Powles, Wang E, Huang Y, Freeman GJ, Choueiri TK, Signoretti S | 2019 | Clinical Cancer Research | Immuno-oncology | Multiplex IHC | HALO |
| In Situ Temporospatial Characterization of the Glial Response to Prion Infection | Michael AV, Greenlee JJ, Harm TA, Moore SJ, Zhang M, Lind MS, Greenlee MHW, Smith JD | 2019 | Veterinary Pathology | Immunology, Neuroscience, Infectious Disease | Area Quantification | HALO |
| Intraintestinal and Parenteral Administration of an Insulin Analogue Leads to Comparable Activation of Signaling Downstream of the Insulin Receptor in the Small Intestine | Hvid H, Kildegaard J, Kristensen K, Porsgaard T, Jørgensen MS, Ballarín-González B, Ahnfelt-Rønne J, Hansen Bo F, Nishimura E | 2019 | Journal of Diabetes Science and Technology | Metabolism | HALO | |
| Intravital imaging reveals systemic ezrin inhibition impedes cancer cell migration and lymph node metastasis in breast cancer | Ghaffari A, Hoskin V, Turashvili G, Varma S, Mewburn J, Mullins G, Greer PA, Kiefer F, Day AG, Madarnas Y, SenGupta S, Elliott BE | 2019 | Breast Cancer Research | Oncology | Classifier, Cytonuclear | HALO |
| Islet amyloidosis in a child with type 1 diabetes | Beery ML, Jacobsen LM, Atkinson MA, Butler AE, Campbell-Thompson M | 2019 | Islets | Metabolism | Classifier | HALO |
| Dysregulated expression but redundant function of the long non-coding RNA HOTAIR in diabetic kidney disease | Majumder S, Hadden MJ, Thieme K, Batchu SN, Niveditha D, Chowdhury S, Yerra VG, Advani SL, Bowskill BB, Liu Y, Vakili H, Alghamdi TA, White KE, Geldenhuys L, Siddiqi FS, Advani A | 2019 | Diabetologia | Metabolism | Area Quantification | HALO |
| Lamin‑B1 is a senescence‑associated biomarker in clear‑cell renal cell carcinoma | Radspieler M, Schindeldecker M, Stenzel P, Försc S, Tagscherer K, Herpel E, Hohenfellner M, Hatiboglu G, Roth W, Macher‑Goeppinger S | 2019 | Oncology Letters | Oncology | Cytonuclear | HALO |
| Lenvatinib induces death of human hepatocellular carcinoma cells harboring an activated FGF signaling pathway through inhibition of FGFR-MAPK cascades | Hoshi T, Miyano SW, Watanabe H, Sonobe RMK, Seki Y, Ohta E, Nomoto K, Matsui J, Funahashi Y | 2019 | Biochemical and Biophysical Research Communications | Oncology | Area Quantification | HALO |
| LRRK2 inhibition does not impart protection from α-synuclein pathology and neuron death in non-transgenic mice | Henderson MX, Sengupta M, McGeary I, Zhang B, Olufemi MF, Brown H, Trojanowski JQ, Lee VMY | 2019 | Acta Neuropathologica Communications | Neuroscience | Area Quantification, Cytonuclear | HALO |
| Machine learning approaches for pathologic diagnosis | Komura D, Ishikawa S | 2019 | Vichows Archiv | Review | Classifier | HALO, HALO AI |
| Monocytes/Macrophages play a pathogenic role in IL-23 mediated psoriasis-like skin inflammation | Wang Y, Edelmayer R, Wetter J, Salte K, Gauvin D, Leys L, Paulsboe S, Su Z, Weinberg I, Namovic M, Gauld SB, Honore P, Scott VE, McGaraughty S | 2019 | Scientific Reports | Immunology, Dermatology | HALO | |
| Quantitative digital pathology reveals association of cell-specific PNPLA3 transcription with NAFLD disease activity | Sandhu B, Perez Matos MC, Tran S, Zhong A, Csizmadia E, Kim M, Herman MA, Nasser I, Lai M, Jiang ZG | 2019 | JHEP Reports | Fibrosis | ISH/FISH | HALO |
| Multiplexed Immunohistochemistry for Molecular and Immune Profiling in Lung Cancer—Just About Ready for Prime-Time? | Hofman P, Badoual C, Henderson F, Berland L, Hamila M, Long-Mira E, Lassalle S, Roussel H, Hofman V, Tartour E, Ilié M | 2019 | Cancers | Oncology, Immuno-oncology, Review | Classifier, Multiplex IHC | HALO |
| MYB-NFIB gene fusions identified in archival adenoid cystic carcinoma tissue employing NanoString analysis: an exploratory study | McIntyre JB, Ko JJ, Siever J, Chan AMY, Simpson RHW, Hao D, Lau HY | 2019 | Diagnostic Pathology | Oncology | Classifier, Highplex FL | HALO |
| Neurexin 3 transmembrane and soluble isoform expression and splicing haplotype are associated with neuron inflammasome and Alzheimer’s disease | Hishimoto A, Pletnikova O, Lang DL, Troncoso JC, Egan JM, Liu Q-R | 2019 | Alzheimer's Research & Therapy | Neuroscience | ISH/FISH | HALO |
| No Evidence of Neurogenesis in Adult Rat Sympathetic Ganglia Following Guanethidine-Induced Neuronal Loss | Walters KM, Boucher M, Boucher GG, Opsahl AC, Mouton PR, Liu C-N, Ritenour CR, Kawabe TT, Pryski HN, Somps CJ | 2019 | Toxicologic Pathology | Toxicology, Neuroscience | HALO | |
| Nrf2 represses the onset of type 1 diabetes in non-obese diabetic mice | Yagishita Y, Uruno A, Chartoumpekis DV, Kensler TW, Yamamoto M | 2019 | The Journal of Endocrinology | Metabolism | HALO | |
| Reliable identification of prostate cancer using mass spectrometry metabolomic imaging in needle core biopsies | Morse N, Jamaspishvili T, Simon D, Patel PG, Ren KYM, Wang J, Oleschuk R, Kaufmann M, Gooding RJ, Berman DM | 2019 | Laboratory Investigations | Oncology | HALO | |
| Physiologic serum 1,25 dihydroxyvitamin D is inversely associated with prostatic Ki67 staining in a diverse sample of radical prostatectomy patients | Rosenberg A, NetteY OS, Gogana P, Sheikh U, Virgilia M, Macias V, Kajdacsy-Balla A, R Sharifi R, Kittles RA, Murphy AB | 2019 | Cancer Causes & Control | Oncology | Multiplex IHC | HALO |
| Predicting breast cancer response to neoadjuvant chemotherapy based on tumor vascular features in needle biopsies | Brocato TA, Brown-Glaberman U, Wang Z, Selwyn RG, Wilson CM, Wyckoff EF, Lomo LC, Saline JL, Hooda-Nehra A, Pasqualini R, Arap W, Brinker CJ, Cristini V | 2019 | JCI Insight | Oncology | Classifier | HALO |
| Pre-exposure prophylaxis differentially alters circulating and mucosal immune cell activation in herpes simplex virus type 2 seropositive women | Richert-Spuhler LE, Pattacini L, Plews M, Irungu E, Muwonge TR, Katabira E, Mugo N, Meyers AFA, Celum C, Baeten JM, Lingappa JR, Lund JM | 2019 | AIDS | Infectious Disease | HALO | |
| Rabbit monoclonal E‐cadherin antibody: A cost‐effective alternative to mouse monoclonal antibody in distinguishing ductal carcinoma in situ from lobular carcinoma in situ | Baum JE, Croyle JA, Brodsky VB, Liu Y, Shin SJ | 2019 | The Breast Journal | Oncology | Cytonuclear | HALO |
| Safety and clinical activity of PD-L1 blockade in patients with aggressive recurrent respiratory papillomatosis | Allen CT, Lee S, Norberg SM, Kovalovsky D, Ye H, Clavijo PE, Hu-Lieskovan S, Schlegel R, Schlom J, Strauss J, Gulley JL, Trepel J, Hinrichs CS | 2019 | Journal for ImmunoTherapy of Cancer | Oncology, Immuno-oncology | Cytonuclear | HALO |
| Cutaneous pharmacologic cAMP induction induces melanization of the skin and improves recovery from ultraviolet injury in melanocortin 1 receptor‐intact or heterozygous skin | Bautista R-M, Carter KM, Jarrett SG, Napier D, Wakamatsu K, Ito S, D'Orazio JA | 2019 | Pigment Cell & Melanoma Research | Dermatology | Area Quantification | HALO |
| A Dual Blocker of Endothelin A/B Receptors Mitigates Hypertension but not Renal Dysfunction in a Rat Model of Chronic Kidney Disease and Sleep Apnea | Morales-Loredo H, Jones DT, Barrera A, Mendiola P, Garcia J, Pace CE, Murphy M, Kanagy NL, Gonzalez Bosc LV | 2019 | American Journal of Physiology-Renal Physiology | Metabolism | Classifier, Cytonuclear, Figure Maker | HALO |
| Imaging CAR T cell therapy with PSMA-targeted positron emission tomography | Minn I, Huss DJ, Ahn H-H, Chinn TM, Park A, Jones J, Brummet M, Rowe SP, Sysa-Shah P, Du Y, Levitsky HI, Pomper MG | 2019 | Science Advances | Oncology | Cytonuclear | HALO |
| Small Molecule IL-36γ Antagonist as a Novel Therapeutic Approach for Plaque Psoriasis | Todorović V, Su Z, Putman CB, Kakavas SJ, Salte KM, McDonald HA, Wetter JB, Paulsboe SE, Sun Q, Gerstein CE, Medina L, Sielaff B, Sadhukhan R, Stockmann H, Richardson PL, Qiu W, Argiriadi MA, Henry RF, Herold JM, Shotwell JB, McGaraughty SP, Honore P, Gopalakrishnan SM, Sun CC, Scott VE | 2019 | Scientific Reports | Immunology, Dermatology | ISH/FISH | HALO |
| Systemic mRNA Therapy for the Treatment of Fabry Disease: Preclinical Studies in Wild-Type Mice, Fabry Mouse Model, and Wild-Type Non-human Primates | Zhu X, Yin L, Theisen M, Zhuo J, Siddiqui S, Levy B, Presnyak V, Frassetto A, Milton J, Salerno T, Benenato KE, Milano J, Lynn A, Sabnis S, Burke K, Besin G, Lukacs CM, Guey LT, Finn PF, Martini PGV | 2019 | The American Journal of Human Genetics | Metabolism | HALO | |
| Targeted drug delivery via caveolae-associated protein PV1 improves lung fibrosis | Marchetti GM, Burwell TJ, Peterson NC, Cann JA, Hanna RN, Li Q, Ongstad EL, Boyd JT, Kennedy MA, Zhao W, Rickert KW, Grimsby JS, Dall’Acqua WF, Wu H, Tsui P, Borrok MJ, Gupta R | 2019 | Communications Biology | Fibrosis | Area Quantification | HALO |
| The crosstalk between aldosterone and calcium metabolism in primary aldosteronism: A possible calcium metabolism-associated aberrant “neoplastic” steroidogenesis in adrenals | Gao X, Yamazaki Y, Tezuka Y, Onodera Y, Ogata H, Omata K, Morimoto R, Nakamura Y, Satoh F, Sasano H | 2019 | The Journal of Steroid Biochemistry and Molecular Biology | Oncology, Metabolism | Cytonuclear | HALO |
| The Fat Mass and Obesity-Associated Protein (FTO) Regulates Locomotor Responses to Novelty via D2R Medium Spiny Neurons | Ruud J, Alber J, Tokarska A, Engström Ruu L, Nolte H, Biglari N, Lippert R, Lautenschlager Ä, Cieślak PE, Szumiec Ł, Hess ME, Brönneke HS, Krüger M, Nissbrandt H, Korotkova T, Silberberg G, Rodriguez Parkitna J, Brüning J | 2019 | Cell Reports | Neuroscience, Metabolism | ISH/FISH | HALO |
| Unmasking of oestrogen‐dependent changes in left ventricular structure and function in aged female rats: a potential model for pre‐heart failure with preserved ejection fraction | Bustamante M, Garate‐Carrillo A, Ito BR, Garcia R, Carson N, Ceballos G, Ramirez‐Sanchez I, Omens J, Villarreal F | 2019 | The Journal of Physiology | Myology | Area Quantification | HALO |
| Upper tract urothelial carcinoma has a luminal-papillary T-cell depleted contexture and activated FGFR3 signaling | Robinson BD, Vlachostergios PJ, Bhinder B, Liu W, Li K, Moss TJ, Bareja R, Park K, Tavassoli P, Cyrta J, Tagawa ST, Nanus DM, Beltran H, Molina AM, Khani F, Miguel Mosquera J, Xylinas E, Shariat SF, Scherr DS, Rubin MA, Lerner SP, Matin SF, Elemento O, Faltas BM | 2019 | Nature Communications | Oncology, Immuno-oncology | Cytonuclear | HALO |
| Neoadjuvant anti-PD-1 immunotherapy promotes a survival benefit with intratumoral and systemic immune responses in recurrent glioblastoma | Cloughesy TF, Mochizuki AY, Orpilla JR, Hugo W, Lee AH, Davidson TB, Wang AC, Ellingson BM, Rytlewski JA, Sanders CM, Kawaguchi ES, Du L, Li G, Yong WH, Gaffey SC, Cohen AL, Mellinghoff IK, Lee EQ, Reardon DA, O’Brien BJ, Butowski NA, Nghiemphu PL, Clarke JL, Arrillaga-Romany IC, Colman H, Kaley TJ, de Groot JF, Liau LM, Wen PY, Prins RM | 2019 | Nature Medicine | Oncology, Immuno-oncology | Spatial Analysis, Highplex FL | HALO |
| PTEN loss in Gleason grade 7 prostate tumors exhibits intratumoral heterogeneity and is associated with unfavorable pathological features | Picanço-Albuquerque CG, Vidotto T, Pereira CS, Saggioro FP, Jamaspishvili T, Koti M, Berman DM, Squire JA, Reis RB | 2019 | Applied Cancer Research | Oncology | HALO | |
| Transmission of tauopathy strains is independent of their isoform composition | He Z, McBride JD, Zu, Changolkar L, Kim S, Zhang B, Narasimhan S, Gibbons GS, Kozak M, Schellenberg GD, Trrojanowski JQ, Lee VM-Y | 2020 | Nature Communications | Neuroscience | Area Quantification | HALO |
| Prognostic and Predictive Value of Tumor-infiltrating Leukocytes and of Immune Checkpoint Molecules PD1 and PDL1 in Clear Cell Renal Cell Carcinoma | Stenzel PJ, Schindeldecker M, Teagscherer KE, Foersch S, Herpel E, Hohenfellner M, Hatiboglu G, Alt J, Thomas C, Haferkamp A, Roth W, Macher-Goeppinger S | 2020 | Translational Oncology | Oncology, Immuno-oncology | Classifier, Cytonuclear, TMA | HALO |
| NPY mediates the rapid feeding and glucose metabolism regulatory functions of AgRP neurons | Ruud LE, Pereira MMA, de Solis AJ, Fenselau H, Bruning JC | 2020 | Nature Communications | Metabolism | ISH/FISH | HALO |
| Imaging breast cancer using hyperpolarized carbon-13 MRI | Gallagher FA, Woitek R, McLean MA, Gill AB, Garcia RM, Provenzano E, Riemer F, Kaggie J, Chhabra A, Ursprung S, Grist JT, Daniels CJ, Zaccagna F, Laurent M-C, Locke M, Hilborne S, Frary A, Torheim T, Boursnell C, Schiller A, Patterson I, Slough R, Carmo B, Kane J, Biggs H, Harrison E, Deen SS, Patterson A, Lanz T, Kingsbury Z, Ross M, Basu B, Baird R, Lomas DJ, Sala E, Wason J, Rueda OM, Chin S-F, Wilkinson IB, Graves MJ, Abraham JE, Gilbert FJ, Caldas C, Brindle KM | 2020 | Proceedings of the National Academy of Sciences | Oncology | Area Quantification | HALO |
| Degradation of the Tumor Suppressor PDCD4 Is Impaired by the Suppression of p62/SQSTM1 and Autophagy | Manirujjaman M, Ozaki I, Murata Y, Guo J, Xia J, Nishioka K, Perveen R, Takashashi H, Anzai K, Matsuhashi S | 2020 | cells | Oncology | HALO | |
| Mechanical regulation of glycolysis via cytoskeleton architecture | Park JS, Burckhardt CJ, Lazcano R, Solis LM, Isogai T, Li L, Chen CS, Gao B, Minna JD, Bachoo R, DeBerardinis RJ, Danuser G | 2020 | Nature | Oncology | Classifier, Cytonuclear, TMA | HALO |
| Analytical Performance of an Immunoprofiling Assay Based on RNA Models | Schillebeeckx I, Armstrong JR, Forys JT, Hiken J, Earls J, Flanagan KC, Cui T, Glasscock JI, Messina DN, Duncavage EJ | 2020 | The Journal of Molecular Diagnostics | Immunology | Cytonuclear | HALO |
| Persistence of adoptively transferred T cells with a kinetically engineered IL-2 receptor agonist | Parisi G, Saco JD, Salazar FB, Tsoi J, Krystofinski P, Puig-Saus C, Zhang R, Zhou J, Cheung-Lau GC, Garcia AJ, Grasso CS, Tavaré R, Hu-Lieskovan S, Mackay S, Zalevsky J, Bernatchez C, Diab A, Wu AM , Comin-Anduix B, Charych D, Ribas A | 2020 | Nature Communications | Oncology, Immunology | Cytonuclear | HALO |
| Early-onset impairment of the ubiquitin-proteasome system in dopaminergic neurons caused by α-synuclein | McKinnon C, De Snoo ML, Gondard E, Neudorfer C, Chau H, Ngana SG, O'Hara DM, Brotchie JM , Koprich JB, Lozano AM, Kalia LV, Kalia SK | 2020 | Acta Neuropathologica Communications | Neuroscience | HALO | |
| GSTO1‐1 is an upstream suppressor of M2 macrophage skewing and HIF‐1α‐induced eosinophilic airway inflammation | Sokulsky LA, Goggins B, Sherwin S, Eyeers F, Kaiko GE, Board PG, Keely S, Yang M, Foster PS | 2020 | Clinical & Experimental Allergy | Immunology | Multiplex IHC | HALO |
| Immune cell landscaping reveals a protective role for regulatory T cells during kidney injury and fibrosis | do Valle Duraes F, Lafont A, Biebel M, Martin K, Darribat K, Cuttat R, Waldt A, Naumann U, Wieczorek G, Gaulis S, Pfister S, Mertz KD, Li J, Roma G, Warncke M | 2020 | JCI Insight | Immunology | Area Quantification, Cytonuclear | HALO |
| Clinicopathological significance of endoplasmic reticulum stress proteins in ovarian carcinoma | Samanta S, Tamura S, Dubeau L, Mhawech-Fauceglia P, Miyagi Y, Kato H, Lieberman R, Buckanovich RJ, Lin YG, Neamati N | 2020 | Scientific Reports | Oncology | Area Quantification | HALO |
| Three-dimensional culture models mimic colon cancer heterogeneity induced by different microenvironments | Kawai S, Yamazaki M, Shibuya K, Yamazaki M, Fujji E, Nakano K, Suzuki M | 2020 | Scientific Reports | Oncology | Cytonuclear | HALO |
| The diagnostic and prognostic value of UBE2T in intrahepatic cholangiocarcinoma | Yu H, Wang H, Dong W, Cao Z-Y, Li R, Yang C, Cong W-M, Dong H, Jin G-Z | 2020 | Peer J | Oncology | Cytonuclear | HALO |
| Prognostic significance of mesothelin expression in colorectal cancer disclosed by area-specific four-point tissue microarrays | Shiraishi T, Shinto E, Nearchou IP, Tsuda H, Kajiwara Y, Einama T, Caie PD, Kishi Y, Ueno H | 2020 | Vichows Archiv | Oncology | Cytonuclear, TMA | HALO, HALO AI |
| A potent peptide-steroid conjugate accumulates in cartilage and reverses arthritis without evidence of systemic corticosteroid exposure | Sanger MLC, Girard EJ, Hopping G, Yin C, Pakiam F, Brusniak M-Y, Nguyen E, Ruff R, Gewe MM, Byrnes-Blake K, Nairn NW, Miller DM, Mehlin C, Strand AD, Mhyre AJ, Correnti CE, Strong RK, Simon JA, Olson JM | 2020 | Science Translational Medicine | Immunology | HALO | |
| Artificial intelligence as the next step towards precision pathology | Acs B, Rantalainen M, Hartman J | 2020 | Journal of Internal Medicine | Review | HALO | |
| Dendritic Cell Paucity Leads to Dysfunctional Immune Surveillance in Pancreatic Cancer | Hedge S, Krisnawan VE, Herzog BH, Zuo C, Breden MA, Knolhoff BL, Hogg GD, Tang JP, Baer JM, Mpoy C, Lee KB, Alexander KA, Rogers BE, Murphy KM, Hawkins WG, Fields RC, DeSelm CJ, Schwarz JK, DeNardo DG | 2020 | Cancer Cell | Oncology, Immuno-oncology | Area Quantification, Cytonuclear, Immune | HALO |
| MCL1 inhibition is effective against a subset of small-cell lung cancer with high MCL1 and low BCL-XL expression | Yasuda Y, Ozasa H, Kim YH, Yamazoe M, Ajimizu H, Funazo TY, Nomizo T, Tsuji T, Yoshida H, Sakamori Y, Najajima N, Menju T, Yoshizawa A, Date H, Hirai T | 2020 | Cell Death & Disease | Oncology, Immuno-oncology | Cytonuclear | HALO |
| The human IL-15 superagonist N-803 promotes migration of virus-specific CD8+ T and NK cells to B cell follicles but does not reverse latency in ART-suppressed, SHIV-infected macaques | Webb GM, Molden J, Bushman-Sahay K, Abdulhaqq S, Wu HL, Weber WC, Bateman KB, Reed JS, Northrup M, Maier N,Tanaka S, Gao L, Davey B, Carpenter BL, Axthelm MK, Stanton JJ, Smedley J, Greene JM, Safrit JT, Estes JD, Skinner PJ, Sacha JB | 2020 | PLOS Pathogens | Infectious Disease | Cytonuclear, ISH/FISH | HALO |
| RUNX1 is a driver of renal cell carcinoma correlating with clinical outcome | Rooney N, Mason SM, McDonald L, Däbritz HM, Campbell KJ, Hedley A, Howard S, Athineos D, Nixon C, Clark W, Leach JDG, Samsom OJ, Edwards J, Cameron ER, Blyth K | 2020 | Cancer Research | Oncology | Cytonuclear | HALO |
| Prevalence of CD8+ cytotoxic lymphocytes in human neoplasms | Blessin NC, Spriestersbach P, Li W, Mandelkow T, Dum D, Simon R, Hube-Magg C, Lutz F, Viehweger F, Lennartz M, Fraune C, Nickelsen V, Fehrle W, Göbel C, Weidemann S, Clauditz T, Lebok P, Möller K, Steurer S, Izbicki JR, Sauter G, Minner S, Jacobsen F, Luebke AM, Büscheck F, Höflmayer D, Wilczak W, Burandt E, Hinsch A | 2020 | Cellular Oncology | Oncology, Immuno-oncology | Membrane, TMA | HALO |
| Neoadjuvant immunotherapy leads to pathological responses in MMR-proficient and MMR-deficient early-stage colon cancers | Chalabi M, Fanchi LF, Dijkstra KK, Van den Berg JG, Aalbers AG, Sikorska K, Lopez-Yurda M, Grootscholten C, Beets GL, Snaebjornsson P, Maas M, Mertz J, Veninga V, Bounova G, Broeks A, Beets-Tan RG, de Wijkerslooth TR, van Lent AU, Marsman HA, Nuijten E, Kok NF, Kuiper M, Verbeek WH, Kok M, Van Leerdam ME, Schumacher TN, Voest EE, Haanen JB | 2020 | Nature Medicine | Immuno-oncology | Multiplex IHC, Serial Section | HALO |
| Computational image analysis of T-cell infiltrates in resectable gastric cancer: association with survival and molecular subtypes | Challoner BR, von Loga K, Woolston A, Griffiths B, Sivamanoharan N, Semiannikova M, Newey A, Barber LJ, Mansfield D, Hewitt LC, Saito Y, Davarzani N, Starling N, Melcher A, Grabsch HI, Gerlinger M | 2020 | JNCI: Journal of the National Cancer Institute | Immuno-oncology | Multiplex IHC | HALO |
| Neoantigen responses, immune correlates, and favorable outcomes after ipilimumab treatment of patients with prostate cancer | Subudhi SK, Vence L, Zhao H, Blando J, Yadav SS, Xiong Q, Reuben A, Aparicio A, Corn PG, Chapin BF, Pisters LL, Troncoso P, Tidwell RS, Thall P, Wu C-J, Zhang J, Logothetis CL, Futreal A, Allison JP, Sharma P | 2020 | Cancer | Immuno-oncology | HALO | |
| Ngly1−/− rats develop neurodegenerative phenotypes and pathological abnormalities in their peripheral and central nervous systems | Asahina M, Fujinawa R, Nakamura S, Yokoyama K, Tozawa R, Suzuki T | 2020 | Human Molecular Genetics | Neuroscience | Axon | HALO |
| Quantification of Viral and Host Biomarkers in the Liver of Rhesus Macaques: a Longitudinal Study of Zaire Ebolavirus strain Kikwit (EBOV/Kik) | Greenberg AR, Huber BR, Liu DX, Logue JP, Hischak AMW, Hart RJ, Abbott M, Isic N, Hisada YM, Mackman N, Bennet RS, Hensley LE, Connor JH, Crossland NA | 2020 | The American Journal of Pathology | Infectious Disease | HALO | |
| Tutorial: guidance for quantitative confocal microscopy | Jonkman J, Brown CM, Wright GD, Anderesion KI, North AJ | 2020 | Nature Protocols | Other | HALO | |
| Environmental contaminant ammonia triggers epithelial-to-mesenchymal transition-mediated jejunal fibrosis with the disassembly of epithelial cell-cell contacts in chicken | Jing H, Wang S, Wang Y, Shen N, Gao X-J | 2020 | Science of the Total Environment | Toxicology | Area Quantification | HALO |
| Formoterol, a β2-adrenoreceptor agonist, induces mitochondrial biogenesis and promotes cognitive recovery after traumatic brain injury | Vekaria HJ, Hubbard WB, Scholpa NE, Spry ML, Gooch JL, Prince SJ, Schnellmann Sullivan PG | 2020 | Neurobiology of Disease | Neuroscience | Area Quantification | HALO |
| Inhibition of myostatin prevents microgravity-induced loss of skeletal muscle mass and strength | Smith RC, Cramer MS, Mitchell PJ, Lucchesi J, Ortega AM, Livingston EW, Ballard D, Zhang L, Hanson J, Barton K, Berens S, Credille KM, Bateman TA, Ferguson VL, Ma YL, Stodieck LS | 2020 | PLOS One | Myology | Muscle Fiber | HALO |
| Overview of multiplex immunohistochemistry/ immunofluorescence techniques in the era of cancer immunotherapy | Tan WCCT, Nerurkar SN, Cai HY, Ng HHM, Wu D, Wee YTF, Lim JCT, Yeong J, Lim TKH | 2020 | Cancer Communications | Review | HALO | |
| PNOCARC Neurons Promote Hyperphagia and Obesity upon High-Fat-Diet Feeding | Jais A, Paeger L, Sotelo-Hitschfeld T, Bremser S, Prinzensteiner M, Klemm P, Mykytiuk V, Widdershooven PJM, Vesting AJ, Grzelka K, Minere M, Cremer AL, Xu J, Korotkova T, Lowell BB, Zeilhofer HU, Backes H, Fenselau H, Wunderlich FT, Kloppenburg P, Bruning JC | 2020 | Neuron | Neuroscience | HALO | |
| Assessment of associations between clinical and immune microenvironmental factors and tumor mutation burden in resected nonsmall cell lung cancer by applying machine learning to whole-slide images | Ono A, Terada Y, Kawata T, Serizawa M, Isaka M, Kawabata T, Imai T, Mori K, Muramatsu K, Hayashi I, Kenmotsu H, Oshima K, Urakami K, Nagashima T, Kusuhara M, Akiyama Y, Sugino T, Ohde Y, Yamaguchi K, Takahashi T T | 2020 | Cancer Medicine | Immuno-oncology | Classifier, Multiplex IHC, Serial Section | HALO |
| Deep Brain Stimulation of the Medial Septal Nucleus Induces Expression of a Virally Delivered Reporter Gene in Dentate Gyrus | Fomenko A, Lee DJ, McKinnon C, Lee EJ, de Snoo ML, Gondard E, Neudorfer C, Hamani C, Lozano AM, Kalia LV, Kalia SK | 2020 | Frontiers in Neuroscience | Neuroscience | HALO | |
| Trajectory and Functional Analysis of PD-1high CD4+CD8+ T Cells in Hepatocellular Carcinoma by Single-Cell Cytometry and Transcriptome Sequencing | Zheng B, Wang D, Qiu X, Luo G, Wu T, Yang S, Li Z, Zhu Y, Wang S, Wu R, Sui C, Gu Z, Shen S, Jeong S, Wu Z, Gu J, Wang H, Chen L | 2020 | Advanced Science | Immuno-oncology | Highplex FL | HALO |
| Distinct fibroblast functional states drive clinical outcomes in ovarian cancer and are regulated by TCF21 | Hussain A, Voisin V, Poon S, Karamboulas C, Bui NHB, Meens J, Dmtryshyn J, Ho VW, Tang KH, Paterson J, Clarke BA, Bernardini MQ, Bader GD, Neel BG,4 Ailles LE | 2020 | Journal of Experimental Medicine | Oncology | Classifier, Area Quantification | HALO |
| Incomplete Freund’s adjuvant reduces arginase and enhances Th1 dominance, TLR signaling and CD40 ligand expression in the vaccine site microenvironment | Pollack KE, Meneveau MO, Melssen MM, Lynch KT, Koeppel AF, Young SJ, Turner S, Kumar P, Sol-Church K, Mauldin IS, Slingfluff CL | 2020 | Journal for ImmunoTherapy of Cancer | Immuno-oncology | HALO | |
| Integrated human pseudoislet system and microfluidic platform demonstrate differences in GPCR signaling in islet cells | Walker JT, Haliyur R, Nelson HA, Ishahak M, Poffenberger G, Aramandla R, Reihsmann C, Luchsinger JR, Saunders DC, Wang P, Garcia-Ocaña A, Bottino R, Agarwal A, Powers AC, Brissova M | 2020 | JCI Insight | Metabolism | HALO | |
| Cholecystokinin-1 receptor agonist induced pathological findings in the exocrine pancreas of non-human primates | Nyborg NCB, Kirk RK, de Boer AS, Andersen DW, Bugge A, Wulff BS, Thorup I, Clausen TR | 2020 | Toxicology & Applied Pharmacology | Metabolism | ISH/FISH | HALO |
| Immunogradient Indicators for Antitumor Response Assessment by Automated Tumor-Stroma Interface Zone Detection | Rasmusson A, Zilenaite D, Nestarenkaite A, Augulis R, Laurinaviciene A, Ostapenko V, Poskus T, Laurinavicius A | 2020 | The American Journal of Pathology | Immuno-oncology | Multiplex IHC | HALO, HALO AI |
| Cholinergic receptors on intestine cells of Ascaris suum and activation of nAChRs by levamisole | McHugh M, Williams P, Verma S, Powell-Coffman JA, Robertson AP, Martin RJ | 2020 | International Journal for Parasitology: Drugs and Drug Resistance | Gastroenterology, Infectious Disease | Area Quantification | HALO |
| Safety, immunogenicity, and clinical efficacy of durvalumab in combination with folate receptor alpha vaccine TPIV200 in patients with advanced ovarian cancer: a phase II trial | Zamarin D, Walderich S, Holland A, Zhou Q, Iasonos AE, Torrisi JM, Merghoub T, Chesebrough LF, Mcdonnell AS, Gallagher JM, Li Y, Hollmann TJ, Grisham RN, Erskine CL, Block MS, Knutson KL, O'Cearbhaill RE, Aghajanian C, Konner JA | 2020 | Journal for ImmunoTherapy of Cancer | Immuno-oncology | Highplex FL | HALO |
| 11β hydroxysteroid dehydrogenase 1: a new marker for predicting response to immune-checkpoint blockade therapy in non-small-cell lung carcinoma | Saito R, Miki Y, Abe T, Miyauchi E, Abe J, Nanamiya R, Inoue C, Sato I, Sasano H | 2020 | British Journal of Cancer | Immuno-oncology | Area Quantification | HALO |
| A first-in-human, phase 1, dose-escalation study of ABBV-176, an antibody-drug conjugate targeting the prolactin receptor, in patients with advanced solid tumors | Lemech C, Woodward N, Chan N, Mortimer J, Naumovski L, Nuthalapati S, Tong B, Jiang F, Ansell P, Ratajczak CK, Sachdev J | 2020 | Investigational New Drugs | Oncology | ISH/FISH | HALO |
| Microglial-associated responses to comorbid amyloid pathology and hyperhomocysteinemia in an aged knock-in mouse model of Alzheimer’s disease | Braun DJ, Dimayuga E, Morganti JM, Van Eldik LJ | 2020 | Journal of Neuroinflammation | Neuroscience | HALO | |
| Temporal and Spatial Heterogeneity of Host Response to SARS-CoV-2 Pulmonary Infection | Desai N, Neyaz A, Szabolcs A, Shih AR, Chen JH, Thapar V, Nieman LT, Solovyov A, Mehta A, Lieb DJ, Kulkarni AS, Jaicks C, Pinto CJ, Juric D, Chebib I, Colvin RB, Kim AY, Monroe R, Warren SE, Danaher P, Reeves JW, Gong J, Rueckert EH, Greenbaum BD, Hacohen N, Lagana SM, Rivera MN, Sholl LM, Stone JR, Ting DT, Deshpande V | 2020 | medRxiv | Infectious Disease | Multiplex IHC | HALO |
| Prognostic value of tumor-infiltrating immune cells in primary colorectal cancer and metastases | Martin SZ, Tagscherer KE, Deckert S, Horst D, Moehler M, Lang H, Roth W | 2020 | Research Square | Immuno-oncology | Classifier, Cytonuclear | HALO |
| Alterations in Intestinal Innate Mucosal Immunity of Weaned Pigs During Porcine Epidemic Diarrhea Virus Infection | Chen Y-M, Helm ET, Gabler N, Hostetter JM, Burrough ER | 2020 | Veterinary Pathology | Infectious Disease | HALO | |
| CXCR4+ cells are increased in lung tissue of patients with idiopathic pulmonary fibrosis | Jaffar J, Griffiths K, Oveissi S, Duan M, Foley M, Glaspole I, Symons K, Organ L, Westfall G | 2020 | Respiratory Research | Fibrosis | Highplex FL | HALO |
| Single-cell analysis of germinal-center B cells informs on lymphoma cell of origin and outcome | Holmes AB, Corinaldesi C, Shen Q, Kumar R, Compagno N, Wang Z, Nitzan M, Grunstein E, Pasqualucci L, Dalla-Favera R, Basso K | 2020 | Journal of Experimental Medicine | Oncology | Registration | HALO |
| A Fas-4-1BB fusion protein converts a death to a pro-survival signal and enhances T cell therapy | Oda SK, Andereson KG, Ravikumar P, Bonson P, Garcia NM, Jenkins CM, Zhuang S, Daman A, Chiu EY, Bates BM, Greenberg PD | 2020 | Journal of Experimental Medicine | Immuno-oncology | HALO | |
| Human ileal organoid model recapitulates clinical incidence of diarrhea associated with small molecule drugs | Belair DG, Visconti RJ, Hong M, Marella M, Peters MF, Scott CW, Kolaja KL | 2020 | Toxicology in Vitro | Toxicology | Highplex FL | HALO |
| Immunohistochemical scoring of CD38 in the tumor microenvironment predicts responsiveness to anti-PD-1/PD-L1 immunotherapy in hepatocellular carcinoma | Ng HHM, Lee RY, Goh S, Tay ISY, Lim X, Lee B, Chew V, Li H, Tan B, Lim S, Lim JCT, Au B, Loh JJH, Saraf S, Connolly JE, Loh T, Leow WQ, Lee JJX, Toh HC, Malavasi F, Lee SY, Chow P, Newell EW, Choo SP, Tai D, Yeong J, Lim TKH | 2020 | Journal for ImmunoTherapy of Cancer | Immuno-oncology | HALO | |
| Insoluble Tau From Human FTDP-17 Cases Exhibit Unique Transmission Properties In Vivo | Weitzman SA, Narasimhan S, He Z, Changolkar L, McBride JD, Zhang B, Schellenberg GD, Trojanowski JQ, Lee VMY | 2020 | Journal of Neuropathology & Experimental Neurology | Neuroscience | HALO | |
| Features of increased malignancy in eosinophilic clear cell renal cell carcinoma | Nilsson H, Lindgren D, Axelson H, Brueffer C, Saal LH, Lundgren J, Johansson ME | 2020 | Journal of Pathology | Immuno-oncology | HALO | |
| Neonatal therapy with PF543, a sphingosine kinase 1 inhibitor, ameliorates hyperoxia-indused airway remodeling in a murine model of bronchopulmonary dysplasia | Ha AW, Sudhadevi T, Ebenezeer DL, Fu P, Berdyshev EV, Ackerman SJ, Natarajan V, Harijith A | 2020 | American Journal of Physiology - Lung Cellular and Molecular Physiology | Other | HALO | |
| Nicotinic Receptor Subunit Distribution in Auditory Cortex: Impact of Aging on Receptor Number and Function | Ghimire M, Cai R, Ling L, Hackett TA, Caspary DM | 2020 | Journal of Neuroscience | Neuroscience | HALO | |
| Periconceptional exposure to lopinavir, but not darunavir, impairs decidualization: a potential mechanism leading to poor birth outcomes in HIV-positive pregnancies | Kala S, Dunk C, Acosta S, Serghides L | 2020 | Human Reproduction | Infectious Disease | Cytonuclear | HALO |
| Photoacoustic imaging biomarkers for monitoring biophysical changes during nanobubble-mediated radiation treatment | Hysi E, Fadhel MN, Wang Y, Sebastian JA, Giles A, Czarnota GJ, Exner AA, Kolios MC | 2020 | Photoacoustics | Other | Classifier, Area Quantification, Object Colocalization | HALO |
| p53 is associated with high-risk and pinpoints TP53 missense mutations in mantle cell lymphoma | Rodrigues JM, Hassan M, Freiburghaus C, Eskelund CW, Geisler C, Raty R, Kolstad A, Sundstrom C, Glimelius I, Gronbaek K, Kwiecinska A, Porwit A, Jerkeman M, Ek S | 2020 | British Journal of Haematology | Oncology | Classifier, Cytonuclear | HALO |
| Two distinct immunopathological profiles in autopsy lungs of COVID-19 | Nienhold R, Ciani Y, Koelzer VH, Tzankov A, Haslbauer JD, Menter T, Schwab N, Henkel M, Frank A, Zsikla V, Willi N, Kempf W, Hoyler T, Barbareschi M, Moch H, Tolnay M, Cathomas G, Demichelis F, Junt T, Mertz KD | 2020 | Nature Communications | Immunology, Infectious Disease | Multiplex IHC | HALO, HALO AI |
| Pulmonary Mycobacterium tuberculosis control associates with CXCR3- and CCR6-expressing antigen-specific Th1 and Th17 cell recruitment | Shanmugasundaram U, Bucsan AN, Ganatra SR, Ibegbu C, Quezada M, Blair RV, Alvarez X, Velu V, Kaushal D, Rengarajan J | 2020 | JCI Insight | Infectious Disease | Highplex FL | HALO, HALO AI |
| Senescence, Necrosis, and Apoptosis Govern Circulating Cell-free DNA Release Kinetics | Rostami A, Lambie M, Yu CW, Stambolic V, Waldron JN, Bratman SV | 2020 | Cell Reports | Toxicology | HALO | |
| The prevalence and prognostic significance of estrogen receptor beta expression in non-small cell lung cancer | Enwere EK, Dean ML, Li H, D'Silva A, Bebb DG | 2020 | Translational Lung Cancer Research | Oncology | Cytonuclear, TMA | HALO |
| Prognostic relevance of programmed cell death protein 1/programmed death-ligand 1 pathway in thymic malignancies with combined immunohistochemical and biomolecular approach | Berardi R, Goteri G, Brunelli A, Pagliaretta S, Paolucci V, Caramanti M, Rinaldi S, Refai M, Pompili C, Morgese F, Torniai, Marcantognini, Ricci G, Mazzanti P, Onofri A, Bianchi F, Sabbatini A, Cascinu S | 2020 | Expert Opinion on Therapeutic Targets | Oncology | HALO | |
| Immune parameters associated with survival in metaplastic breast cancer | Chao X, Liu L, Sun P, Yang X, Li M, Luo R, Huang Y, He J, Yun J | 2020 | Breast Cancer Research | Immuno-oncology | HALO | |
| STAT3 inhibition with galiellalactone efectively targets the prostate cancer stem‑like cell population | Canesin G, Maggio V, Palominos M, Stiehm A, Contreras HR, Castellon EA, Morote J, Paciucci R, Maitland NJ, Bjartell A, Hellsten R | 2020 | Scientific Reports | Oncology | Membrane | HALO |
| Gene expression of prostaglandin EP4 receptor in three canine carcinomas | Musser ML, Viall AK, Phillips RL, Hostetter JM, Johannes CM | 2020 | BMC Veterinary Research | Oncology | ISH/FISH | HALO |
| Implementation of PD-L1 22C3 IHC pharmDxTM in Cell Block Preparations of Lung Cancer: Concordance with Surgical Resections and Technical Validation of CytoLyt® Prefixation | Lou SK, Ko HM, Kinoshita T, MacDonald S, Weiss J, Czarnecka-Kujawa K, Boerner SL, Yasufuku K, Tsao M-S, Schwock J | 2020 | Acta Cytologica | Oncology | Classifier, Membrane | HALO |
| Ad26 vaccine protects against SARS-CoV-2 severe clinical disease in hamsters | Tostanoski LH, Wegmann F, Martinot AJ, Loos C, McMahan K, Mercado NB, Yu J, Chan CN, Bondoc S, Starke CE, Nekorchuk M, Busman-Sahay K, Piedra-Mora C, Wrijil LM, Ducat S, Custers J, Atyeo C, Fischinger S, Burke JS, Feldman J, Hauser BM, Caradonna TM, Bondzie EA, Dagotto G, Gebre MS, Jacob-Dolan C, Lin Z, Mahrokhian SH, Nampanya F, Nityanandam R, Pessaint L, Porto M, ALi V, Benetiene D, Tevi K, Andersen H, Lewis MG, Schmidt AG, Lauffenburger DA, Alter G, Estes JD, Schuitemaker H, Zahn R, Barouch DH | 2020 | Nature Medicine | Infectious Disease | Area Quantification, Multiplex IHC | HALO |
| Ex-vivo delivery of monoclonal antibody (Rituximab) to treat human donor lungs prior to transplantation | Ku TJY, Ribeiero RVP, Ferreira VH, Galasso M, Keshavjee S, Kumar D, Cypel M, Humar A | 2020 | EBioMedicine | Other | Classifier, Cytonuclear | HALO |
| Human cardiac fibroblasts expressing VCAM1 improve heart function in postinfarct heart failure rat models by stimulating lymphangiogenesis | Iwamiya T, Segnard B-D, Matsuoka Y, Imamura T | 2020 | PLOS One | Myology | Area Quantification | HALO |
| Liraglutide treatment improves endothelial function in the Ldlr−/− mouse model of atherosclerosis and affects genes involved in vascular remodelling and inflammation | Bjørnholm KD, Skovsted GF, Mitgaard-Thomsen A, Rakipovski G, Tveden-Nyborg P, Lykkesfeldt J, Povlsen GK | 2020 | Basic & Clinical Pharmacology & Toxicology | Immunology, Toxicology | HALO | |
| Lung Expression of Human ACE2 Sensitizes the Mouse to SARS-CoV-2 Infection | Han K, Blair RV, Iwanaga N, Liu F, Russell-Lodrigue KE, Qin Z, Midkiff CC, Golden NA, Doyle-Meyers LA, Kabir ME, Chandler KE, Cutrera KL, Ren M, Monjure CJ, Lehmicke G, Fischer T, Beddingfield B, Wanek AG, Birnbaum A, Maness NJ, Roy CJ, Datta PK, Rappaport J, Kolls JK, Qin X | 2020 | American Journal of Respiratory Cell and Molecular Biology | Infectious Disease | HALO, HALO AI | |
| Investigating Radiotherapy Response in a Novel Syngeneic Model of Prostate Cancer | Haughey CM, Mukherjee D, Steele RE, Popple A, Dura-Perez L, Pickard A, Patel M, Jain S, Mullan PB, Williams R, Oliveira P, Buckley NE, Honeychurch J, McDade SS, Illidge T, Mills IG, Eddie SL | 2020 | Cancers | Oncology | HALO | |
| Omental macrophages secrete chemokine ligands that promote ovarian cancer colonization of the omentum via CCR1 | Krishnan V, Tallapragada S, Schaar B, Kamat K, Chanana AM, Zhang Y, Patel S, Parkash V, Rinker-Schaeffer C, Folkins AK, Rankin EB, Dorigo O | 2020 | Communications Biology | Oncology | HALO | |
| Intratumoral heterogeneity of the tumor cells based on in situ cortisol excess in cortisol-producing adenomas; An association among morphometry, genotype and cellular senescence | Gao X, Yamazaki Y, Tezuka Y, Pieroni J, Ishii K, Atsumi N, Ono Y, Omata K, Morimoto R, Nakamura Y, Satoh F, Sasano H | 2020 | The Journal of Steroid Biochemistry and Molecular Biology | Oncology | HALO | |
| *A living biobank of matched pairs of patient-derived xenografts and organoids for cancer pharmacology | Xu X, Wang S, Zhou J, Chen J, Huang Y, Kumari R, Mao B, Zheng M, Wang J, Tu X, An X, Chen X, Zhang L, Tian X, Wang H, Dong X, Bao Z, Guo S, Ouyang X, Shan L, Wang F, Yan X, Li Z, Zhang R, Zhang H, Meiler S, Vries R, Clevers H | 2020 | Plos one | Oncology | Highplex FL | HALO |
| Expression of the Autoantigen Topoisomerase-1 is Enriched in the Lung Tissues of Patients With Autoimmune Interstitial Lung Disease: A Case Control Study | Cottrell TR, Askin F, Halushka MK, Casciola-Rosen L, McMahan ZH | 2020 | ACR Open Reumatology | Immunology | HALO | |
| Neuronal activity modulates alpha-synuclein aggregation and spreading in organotypic brain slice cultures and in vivo | Wu Q, Shaikh MA, Meymand ES, Zhang B, Luk KC, Trojanowski JO, Lee VM-Y | 2020 | Acta Neuropathologica | Neuroscience | HALO | |
| A drug-induced hypotensive challenge to verify catheter-based radiofrequency renal denervation in an obese hypertensive swine model | Lauder L, Moon LB, Pipenhagen CA, Ewen S, Fish JM, Virmani R, Jensen JA, Böhm M, Mahfoud F | 2020 | Clinical Research in Cardiology | Myology | HALO | |
| Acute Respiratory Distress in Aged, SARS-CoV-2 Infected African Green Monkeys but not Rhesus Macaques | Blair RV, Vaccari M, Doyle-Meyers LA, Roy CJ, Russell-Lodrigue K, Fahlberg M, Monjure CJ, Beddingfield B, Plante KS, Plante JA, Weaver SC, Qin X, Midkiff CC, Lehmicke G, Golden N, Threeton B, Penney T, Allers C, Barnes MB, Pattison M, Datta PK, Maness NJ, Birnbaum A, Fischer T, Bohm RP, Rappaport J | 2020 | The American Journal of Pathology | Infectious Disease | Classifier | HALO |
| Association of COVID-19 inflammation with activation of the C5a–C5aR1 axis | Carvelli J, Demaria O, Vely F, Batista L, Benmansour NC, Fares J, Carpentier S, Thibult M-L, Morel A, Andre P, Represa A, Piperoglou C, Cordier PY, Le Dault E, Guervilly C, Simone P, Gainnier M, Morel Y, Ebbo M, Schleinitz N, Vivier E | 2020 | Nature | Immunology | Cytonuclear | HALO |
| Conformation-selective tau monoclonal antibodies inhibit tau pathology in primary neurons and a mouse model of Alzheimer’s disease | Gibbons GS, Kim S-J, Wu Q, Riddle DM, Leight SN, Changolkar L, Xu H, Meymand ES, O'Reilly M, Zhang B, Brunden KR, Trojanowski JQ, Lee VMY | 2020 | Molecular Neurodegeneration | Neuroscience | Area Quantification | HALO |
| Age-determined expression of priming protease TMPRSS2 and localization of SARS-CoV-2 infection in the lung epithelium | Schuler BA, Habermann AC, Plosa EJ, Taylor CJ, Jetter C, Kapp ME, Benjamin JT, Gullerman P, Nichols DS, Braunstein LZ, Hackett A, Koval M, Guttentag SH, Blackwell TS, Webber SA, Banovich NE, Kropski JA, Sucre JMS | 2020 | The Journal of Clinical Investigation | Infectious Disease | ISH/FISH | HALO |
| Epithelial-mesenchymal transition of absorptive enterocytes and depletion of Peyer's patch M cells after PEDV infection | Chen Y-M, Helm ET, Groeltz-Thrush, Gabler NK, Burrough ER | 2020 | Virology | Immunology | Area Quantification | HALO |
| Multiomic analysis and immunoprofiling reveal distinct subtypes of human angiosarcoma | Chan JY, Lim JQ, Yeong J, Ravi V, Guan P, Boot A, Tay TKY, Selvarajan S, Nasir NDM, Loh JH, Ong CK, Huang D, Tan J, Li Z, Ng CC-Y, Tan TT, Masuzawa M, Sung KW-K, Farid M, Quek RHH, Tan NC, Teo MCC, Rozen SG, Tan P, Fotreal A, The BT, Soo KC | 2020 | The Journal of Clinical Investigation | Immuno-oncology | Highplex FL | HALO |
| Natural killer cells in the human lung tumor microenvironment display immune inhibitory functions | Russick J, Joubert P-E, Gillard-Bocquet M, Torset C, Meylan M, Petitprez F, Dragon-Durey M-A, Marmier S, Varthaman A, Josseaume N, Germain C, Jérémy Goc J, Dieu-Nosjean M-C, Validire P, Fournel L, Zitvogel L, Bindea G, Lupo A, Damotte D, Alifano M, Cremer I | 2020 | Journal for ImmunoTherapy of Cancer | Immuno-oncology | HALO | |
| The identification and functional analysis of CD8+PD-1+CD161+ T cells in hepatocellular carcinoma | Li Z, Zheng B, Qiu X, Wu R, Wu T, Yang S, Zhu Y, Wu X, Wang S, Gu Z, Shen S, Wu M, Wang H, Chen L | 2020 | Precision Oncology | Immuno-oncology | HALO | |
| Linking epigenetic signature and metabolic phenotype in IDH mutant and IDH wildtype diffuse glioma | Buran Y, Filipski K, Bernatz S, Baumgarten P, Roller B, Zinke J, Zeiner PS, Ilina E, Senft C, Ronellenfitsch MW, Plate KH, Bähr O, Hattingen E, Steinbach JP, Mittelbron M, Harter PN | 2020 | Neuropathology and Applied Neurobiology | Neuroscience | Multiplex IHC, TMA | HALO |
| Neoadjuvant PD-L1 plus CTLA-4 blockade in patients with cisplatin-ineligible operable high-risk urothelial carcinoma | Gao J, Navai N, Alhalabi O, Siefker-Radtke A, Campbell MT, Tidwell RS, Guo CC, Kamat AM, Matin SF, Araujo CJ, Shah AY, Msaouel P, Corn P, Wang J, Papadopoulos JN, Yadav SS, Blando JM, Duan F, Basu S, Liu W, Shen Y, Macaluso MD, Wang Y, Chen J, Zhang J, Futreal A, Dinney C, Allison JP, Goswami S, Sharma P | 2020 | Nature Medicine | Toxicology | HALO | |
| Growth Factor Receptor Expression in Oropharyngeal Squamous Cell Cancer: Her1–4 and c-Met in Conjunction with the Clinical Features and Human Papillomavirus (p16) Status | Deuss E, Gößwein D, Gül D, Zimmer S, Foersch S, Eger CS, Limburg I, Stauber RH, Künzel J | 2020 | Cancers | Oncology | HALO | |
| Immuno-Interface Score to Predict Outcome in Colorectal Cancer Independent of Microsatellite Instability Status | Nestarenkaite A, Fadhil W, Ramusson A, Susanti S, Hadjimichael E, Laurinaviciene A, Ilyas M, Laurinavicius A | 2020 | Cancers | Immuno-oncology | Classifier, Multiplex IHC | HALO |
| The Arp2/3 complex is crucial for colonisation of the mouse skin by melanoblasts | Papalazarou V, Swaminathan K, Jaber-Hijaz Fi, Spence H, Lahmann I, Nixon C, Salmeron-Sanchez M, Arnold H-H, Rottner K, Machesky LM | 2020 | Development | Review | HALO | |
| Rova-T enhances the anti-tumor activity of anti-PD1 in a murine model of small cell lung cancer with endogenous Dll3 expression | Vitorino P, Chuang C-H, Iannello Z, Zhao X, Anderson W, Ferrando R, Zhang Z, Madhavan S, Karsunky H, Saunders LR | 2020 | Translational Oncology | Immuno-oncology | Highplex FL | HALO |
| Intratumoral Combinatorial Administration of CD1c (BDCA-1) + Myeloid Dendritic Cells Plus Ipilimumab and Avelumab in Combination with Intravenous Low-Dose Nivolumab in Patients with Advanced Solid Tumors: A Phase IB Clinical Trial | Schwarze JK, Awada G, Cras L, Tijtgat J, Forsyth R, Dufait I, Tuyaerts S, Riet VI, Neyns B | 2020 | Vaccines | Immuno-oncology | HALO | |
| Adult onset pan-neuronal human tau tubulin kinase 1 expression causes severe cerebellar neurodegeneration in mice | McMillan P, Wheeler J, Gatlin RE, Taylor L, Strovas T, Baum M, Bird TD, Latimer C, Keene CD, Kraemer BC, Liachko NF | 2020 | Acta Neuropathologica Communications | Neuroscience | Area Quantification | HALO |
| Impact of Preanalytical Factors During Histology Processing on Section Suitability for Digital Image Analysis | Chlipala EA, Butters M, Brous M, Fortin JS, Archuletta R, Copeland K, Bolon B | 2020 | Toxicologic Pathology | Toxicology | Area Quantification, Cytonuclear | HALO |
| Consumptive coagulopathy of severe yellow fever occurs independently of hepatocellular tropism and massive hepatic injury | Baileya AL, Kanga L-I, Zanellab LGFdABD, Silveirab CGT, Hod Y-H, Foquete L, Biale G, McCunef BT, Duarte-Netog AN, Thomash A, Rauéh H-P, Byrnesa K, Kallasd EG, Slifkah MK, Diamond MS | 2020 | Proceedings of the National Academy of Sciences | Infectious Disease | HALO | |
| Intratumoral interleukin-12 mRNA therapy promotes TH1 transformation of the tumor microenvironment | Hewitt SL, Bailey D, Zielinski J, Apte A, Musenge F, Karp R, Burke S, Garcon F, Mishra A, Gurumurthy S, Watkins A, Arnold K, Moynihan J, Clancy-Thompson E, Mulgrew K, Adjei G, Deschler K, Potz D, Moody G, Leinster DA, Novick S, Sulikowski M, Bagnall CJ, Martin P, Lapointe J-M, Si H, Morehouse CA, Sedic M, Wilkinson RW, Herbst R, Frederick JP, Luheshi N | 2020 | Clinical Cancer Research | Immuno-oncology | HALO | |
| CD137 agonist-based combination immunotherapy enhances activated, effector memory T cells and prolongs survival in pancreatic adenocarcinoma | Muth ST, Saung MT, Blair AB, Henderson MG, Thomass DL II, Xheng L | 2020 | Cancer Letters | Immuno-oncology | HALO | |
| Genetic alterations and expression characteristics of ARID1A impact tumor immune contexture and survival in early-onset gastric cancer | Zou J, Qin W, Wang L, Wang Y, Shen J, Xiong W, Yu S, Song S, Ajani JA, Lin S-Y, Mills GB, Yuan X, Chen J, Peng G | 2020 | American Journal of Cancer Research | Immuno-oncology | Spatial Analysis, Highplex FL | HALO |
| Antitumor Activity of Eribulin After Fulvestrant Plus CDK4/6 Inhibitor in Breast Cancer Patient-derived Xenograft Models | Niwa Y, Asano M, Nakagawa T, France D, Semba T, Funahashi Y | 2020 | Anticancer Research | Oncology | HALO | |
| TGFβ-blockade uncovers stromal plasticity in tumors by revealing the existence of a subset of interferon-licensed fibroblasts | Grauel AL, Nguyen B, Ruddy D, Laszewski T, Schwartz S, Chang J, Chen J, Piquet M, Pelletier M, Yan Z, Kirkpatrick ND, Wu J, deWeck A, Riester M, Hims M, Geyer FC, Wagner J, MacIsaac K, Deeds J, Diwanji R, Jayaraman P, Yu Y, Simmons Q, Weng S, Raza A, Minie B, Dostalek M, Chikkegowda P, Ruda V, Iartchouk O, Chen N, Thierry R, Zhou J, Pruteanu-Malinici I, Fabre C, Engelman JA, Dranoff G, Cremasco V | 2020 | Nature Communications | Oncology | Area Quantification | HALO |
| An Antibody Targeting ICOS Increases Intratumoral Cytotoxic to Regulatory T-cell Ratio and Induces Tumor Regression | Sainson RCA, Thotakura AK, Kosmac M, Borhis G, Parveen N, Kimber R, Carvalho J, Henderson SJ, Pryke KL, Okell T, O'Leary S, Ball S, Van Krinks C, Gamand L, Taggart E, Pring EJ, Ali H, Craig H, Wong VWY, Liang Q, Rowlands RJ, Lecointre M, Campbell J, Kirby I, Melvin D, Germaschewski V, Oelmann E, Quaratino S, McCourt M | 2020 | Cancer Immunology Research | Immuno-oncology | Multiplex IHC | HALO |
| SLFN11 informs on standard of care and novel treatments in a wide range of cancer models | Winkler C, Armenia J, Jones GN, Tobalina L, Sale MJ, Petreus T, Baird T, Serra V, Wang AT, Lau A, Garnett MJ, Jaaks P, Coker EA, Pierce AJ, O'Connor MJ, Leo E | 2020 | British Journal of Cancer | Oncology | Classifier, Cytonuclear | HALO |
| Tumoral PD-1hiCD8+ 1 T cells are partially exhausted and 2 predict favorable outcome in triple-negative breast cancer | Guo L, Cao C, Goswami S, Huang X, Ma L, Guo Y, Yang B, Li T, Chi Y, Zhang X, Wu J | 2020 | Clinical Science | Immuno-oncology | Highplex FL | HALO, HALO AI |
| O 6-Methylguanine DNA Methyltransferase and Glucose Transporter 2 in Foregut and Hindgut Gastrointestinal Neuroendocrine Neoplasms | Watanbe H, Yamazaki Y, Fujishima F, Izxumi K, Imamura M, Hijioka S, Toriyama K, Yatabe Y, Kudo A, Motoi F, Unno M, Sasano H | 2020 | BMC Cancer | Oncology | Cytonuclear | HALO |
| Naproxen chemoprevention promotes immune activation in Lynch syndrome colorectal mucosa | Reyes-Uribe L, Wu Wenhui, Gelincik O, Bommi P, Francisco-Cruz A, Solis L, Lynch P, Lim R, Stoffel E, Kanth P, Samadder N, Mork M, Taggart M, Milne G, Marnett L, Vornik L, Liu D, Revuelta M, Chang K, You Y, Kipelovich L, Wistuba I, Lee J, Sei S, Shoemaker R, Szabo E, Richmond E, Umar A, Perloff M, Brown P, Lipkin S, Vilar E | 2020 | The BMJ | Oncology, Gastroenterology | Classifier, Cytonuclear | HALO |
| A preclinical trial and molecularly-annotated patient cohort identify predictive biomarkers in homologous recombination deficient pancreatic cancer | Wang Y, Park J, Pacis A, Denroche R, Jang G, Zhang A, Cuggia A, Domecq C, Monlong J, Raitses-Gurevich M, Grant R, Borgida A, Holter S, Stossel C, Bu S, Masoomian M, Lungu I, Bartlett J, Wilson J, Gao Z, Riazalhosseini Y, Asselah J, Bouganim N, Cabrera T, Boucher L, Valenti D, Biagi J, Greenwood C, Polak P, Foulkes W, Golan T, O'Kane G, Fischer S, Knox J, Gallinger S, Zogopoulos G | 2020 | Clinical Cancer Research | Oncology | Classifier, Cytonuclear, Multiplex IHC | HALO |
| The InSituPlex® Staining Method for Multiplexed Immunofluorescence Cell Phenotyping and Spatial Profiling of Tumor FFPE Samples | Manesse M, Patel KK, Bobrow M, Downing SR | 2020 | Biomarkers for Immunotherapy of Cancer | Oncology, Immuno-oncology | Highplex FL | HALO |
| Robust and persistent reactivation of SIV and HIV by N-803 and depletion of CD8+ cells | McBrien JB, Mavigner M, Li LF, Smith SA, White E, Tharp GK, Walum H, Busman-Suhay K, Aguilera-Sandoval CR, Thayer WO, Spagnuolo RA, Kovarova M, Wahl A, Cervasi B, Margolis DM, Vanderford TH, Carnathan DG, Paiardini M, Lifson JD, Lee JH, Safrit JT, Bosinger SE, Estes JD, Derdeyn CA, Garcia JV, Kulpa DA, Chahroudi A, Silvestri G | 2020 | Nature | Other | ISH/FISH | HALO |
| Acute brain inflammation, white matter oxidative stress, and myelin deficiency in a model of neonatal intraventricular hemorrhage | Goulding DS, Vogel RC, Gensel JC, Morganti JM, Stromberg AJ, Miller BA | 2020 | Journal of Neuroscience | Immunology, Neuroscience | Area Quantification, Object Colocalization | HALO |
| CTLA-4 and PD-1 dual blockade induces SIV reactivation without control of rebound after antiretroviral therapy interruption | Harper J, Gordon S, Chan CN, Wang H, Lindemuth E, Galardi C, Falcinelli SD, Raines SLM, Read JL, Nguyen K, McGary CS, Nekorchuk M, Busman-Sahay K, Schawalder J, King C, Pino M, Micci L, Cervasi B, Jean S, Sanderson A, Johns B, Koblansky AA, Amrine-Madsen H, Lifson J, Margolis DM, Silvestri G, Bar KJ, Favre D, Estes JD, Paiardini | 2020 | Nature Medicine | Immunology, Infectious Disease | Cytonuclear, ISH/FISH | HALO |
| Olaparib and durvalumab in patients with germline BRCA-mutated metastatic breast cancer (MEDIOLA): an open-label, multicentre, phase 1/2, basket study | Domchek SM, Postel-Vinay S, Im S-A, Park YH, Delord J-P, Italiano A, Alexandre J, You B, Bastian S, Krebs MG, Wang D, Waqar SN, Lanasa M, Rhee J, Gao H, Rocher-Ros V, Jones EV, Gulati S, Coenen-Stass A, Kozarewa I, Lai Z, Angell HK, Opincar L, Herbolsheimer P, Kaufman B | 2020 | The Lancet Oncology | Oncology | Multiplex IHC | HALO |
| Artificial Intelligence-Based Quantification of Epithelial Proliferation in Mammary Glands of Rats and Oviducts of Göttingen Minipigs | Hvid H, Skydsgaard M, Jensen NK, Vluff BM, Jensen HE, Oleksiewicz MB, Kvist PH | 2020 | Toxicologic Pathology | Toxicology | Area Quantification | HALO, HALO AI |
| Interplay of somatic alterations and immune infiltration modulates response to PD-1 blockade in advanced clear cell renal cell carcinoma | Braun DA, Hou Y, Bakouny Z, Ficial M, Sant' Angelo M, Forman J, Ross-Macdonald P, Berger AC, Jegede OA, Elagina L, Steinharter J, Sun M, Wind=Rotolo M, Pignon J-C, Cherniack AD, Lichtenstein L, Neuberg D, Catalano P, Freeman GJ, Sharpe AH, McDermott DF, Van Allen EM, Signoretti S, Wu CJ, Shukla SA, Choueiri TK | 2020 | Nature Medicine | Immuno-oncology | Highplex FL | HALO |
| ARID1A influences HDAC1/BRD4 activity, intrinsic proliferative capacity and breast cancer treatment response | Nagarajan S, Rao SV, Sutton J, Cheeseman D, Dunn S, Papachristou EK, Prada J-EG, Couturier D-L, Kumar S, Kishore K, Chilamakuri CSR, Glont E, Goode EA, Brodie C, Guppy N, Natrajan R, Bruna A, Caldas C, Russel A, Siersbaek R, Yusa K, Chernukhin I, Carroll JS | 2020 | Nature Genetics | Oncology | Multiplex IHC | HALO |
| Preoperative ipilimumab plus nivolumab in locoregionally advanced urothelial cancer: the NABUCCO trial | van Dijk N, Gil-Jimenez A, Silina K, Hendricksen K, Smit LA, de Feijter JM, van Montfoort ML, van Rooijen C, Peters D, Broeks A, van der Poel HG, Bruining A, Lubeck Y, Sikorska K, Boellaard TN, Kvistborg P, Vis DJ, Hooijberg E, Schumacher TN, van den Broek M, Wessels LFA, Blank CU, van Rhijn BW, van der Heijden MS | 2020 | Nature Medicine | Immuno-oncology | Classifier, Highplex FL | HALO |
| Immunogenic Chemotherapy Enhances Recruitment of CAR-T Cells to Lung Tumors and Improves Antitumor Efficacy when Combined with Checkpoint Blockade | Srivastava S, Furlan SN, Jaeger-Ruckstuhl CA, Sarvothama M, Berger C, Smythe KS, Garrison SM, Specht JM, Lee SM, Amezquita RA, Voillet V, Muhunthan V, Yechan-Gunja S, Pillai SPS, Rader C, Houghton AM, Pierce RH, Gottardo R, Maloney DG, Riddell SR | 2020 | Cancer Cell | Immuno-oncology | Multiplex IHC, Highplex FL | HALO |
| HIV-1-induced cytokines deplete homeostatic innate lymphoid cells and expand TCF7-dependent memory NK cells | Wang Y, Lifschitz L, Gellatly K, Vinton CL, Busman-Sahay K, McCauley S, Vangala P, Kim K, Derr, Jaiswall S, Kucukural A, McDonel P, Hunt PW, Greenough T, Houghton J, Somsouk M, Estes JD, Brenchley JM, Garber M, Deeks SG, Luban J | 2020 | Nature Immunology | Immunology, Infectious Disease | Area Quantification, Cytonuclear, ISH/FISH | HALO |
| IL6/STAT3 Signaling Hijacks Estrogen Receptor α Enhancers to Drive Breast Cancer Metastasis | Siersbæk R, Scabia V, Nagarajan S, Chernukhin I, Papachristou EK, Broome R, Johnston SJ, Joosten SEP, Green AR, Kumar S, Jones J, Omarjee S, Alvarez-Fernandez R, Glont S, Aitken SJ, Kishore K, Cheeseman D, Rakha EA, D'Santos C, Zwart W, Ruseel A, Brisken C, Carroll JS | 2020 | Cancer Cell | Oncology | Area Quantification, Multiplex IHC | HALO |
| The Unfolded Protein Response Mediator PERK Governs Myeloid Cell-Driven Immunosuppression in Tumors through Inhibition of STING Signaling | Mohamed E, Sierra RA, Trillo-Tinoco J, Cao Y, Innamarato P, Payne KK, Pulido M, Mandula J, Zhang S, Thevenot P, Biswas S, Abdalla SK, Costich TL, Hanggi K, Anadon CM, Flores ER, Haura EB, Mehrotra, Pilon-Thomas S, Ruffel B, Munn DH, Cubillos-Ruiz JR, Conejo-Garcia JR, Rodriguez PC | 2020 | Immunity | Immuno-oncology | Highplex FL | HALO |
| Genomic analysis of Vascular Invasion in Hepatocellular Carcinoma (HCC) Reveals Molecular Drivers and Predictive Biomarkers | Krishnan MS, Rajan KD A, Park J, Arjunan V, Marques FJG, Bermudez A, Girvan OA, Hoang NS, Yin J, Nguyen MH, Kothary N, Pitteri S, Felsher DW, Dhanasekaran R | 2020 | Hepatology | Oncology | Multiplex IHC, TMA | HALO |
| Efficacy and safety of a 3‐in‐1 antiaging night facial serum containing melatonin, bakuchiol, and ascorbyl tetraisopalmitate through clinical and histological analysis | Goldberg DJ, Mraz-Robinson D, Granger C | 2020 | Journal of Cosmetic Dermatology | Dermatology | Area Quantification | HALO |
| ILC2-driven innate immune checkpoint mechanism antagonizes NK cell antimetastatic function in the lung | Schuijs MJ, Png S, Richard AC, Tsyben A, Hamm G, Stockis J, Garcia C, Panaud S, Nicholls A, Ros XR, Su J, Eldridge MD, Riedel A, Serrao EM, Rodewald H-R, Mack M, Shields JD, Cohen ES, McKenzie ANJ, Goodwin RJA, Brindle KM, Marioni JC, Halim TYF | 2020 | Nature Immunology | Immuno-oncology | Multiplex IHC | HALO |
| Engineering functional microvessels in synthetic polyurethane random-pore scaffolds by harnessing perfusion flow | Wright MEE, Yu JK, Jain D, Maeda A, Yeh S-CA, DaCosta RS, Lin CP, Santerre JP | 2020 | Biomaterials | Biomaterials | Area Quantification | HALO |
| Expansion of Immature, Nucleated Red Blood Cells by Transient Low‐Dose Methotrexate Immune Tolerance Induction in Mice | Tran JQ, Grover D, Zhang M, Stapels M, Brennan R, Bangari DS, Piepenhagen PA, Roberts E, Olivia P, Zubair F, Vela JL, Richards SM, Joseph AM | 2020 | Clinical & Experimental Immunology | Immunology | Area Quantification | HALO |
| Highly efficient genome editing in primary human bronchial epithelial cells differentiated at air-liquid interface | Rapiteanu R, Karagyozova T, Zimmerman N, Singh K, Wayne G, Martufi M, Belyaev NN, Hessel EM, Michalovich D, Macarron R, Rowan WC, Cairns WJ, Roger J, Betts J, Beinke S, Maratou K | 2020 | European Respiratory Journal | Other | Highplex FL | HALO |
| IBI112, a selective anti-IL23p19 monoclonal antibody, displays high efficacy in IL-23-induced psoriasiform dermatitis | Li L, Wu Z, Qiu X, Wu Y, Kuang Z, Wang L, Sun T, Liu Y, Yi S, Jing H, Zhou S, Chen B, Wu, D, Wu W, Liu J | 2020 | International Immunopharmacology | Immunology, Dermatology | Classifier | HALO |
| A four-chemokine signature is associated with a T cell-inflamed phenotype in primary and metastatic pancreatic cancer | Romero JM, Grünwald BT, Jang G-H, Bavi PP, Jhaveri A, Masoomian M, Fischer SE, Zhang A, Denroche RE, Lungu IM, De Luca A, Bartlett JMS, Xu J, Li N, Dhaliwal S, Liang S-B, Chadwick D, Vyas F, Bronsert P, Khokha R, McGaha TL, Notta F, Ohashi PS, Done SJ, O'Kane GM, Wilson JM, Knox JJ, Connor A, Wang Y, Zogopoulos G, Gallinger S | 2020 | Clincial Cancer Research | Oncology | Immune | HALO |
| A Dedicated Evolutionarily Conserved Molecular Network Licenses Differentiated Cells to Return to the Cell Cycle | Miao Z-F, Lewis MA, Cho CJ, Adkins-Threats M, Park D, Brown JW, Sun J-X, Burclaff JR, Kennedy S, Lu J, Mahar M, Vietor I, Huber LA, Davidson NO, Cavalli V, Rubin DC, Wang Z-N, Mills JC | 2020 | Developmental Cell | Oncology | Highplex FL | HALO |
| STAT3 antisense oligonucleotide remodels the suppressive tumor microenvironment to enhance immune activation in combination with anti-PD-L1 | Proia T, Singh M, Woessner R, Carnevalli LS, Bommakanti G, Magiera L, Srinivasan SS, Grosskurth SE, Collins M, Womack C, Griffin M, Ye M, Cantin S, Russell DL, Xie M, Hughes AM, Deng N, Mele DA, Fawell SE, Barry ST, Reimer C, Barrett JC, McCoon P | 2020 | Clinical Cancer Research | Immuno-oncology | Multiplex IHC, Highplex FL | HALO |
| Mammalian Retinal Cell Quantification | Muthuswamy A, Chen H, Hu Y, Turner OC, Aina OH | 2020 | Toxicologic Pathology | Other | Cytonuclear | HALO |
| MAOA-mediated reprogramming of stromal fibroblasts promotes prostate tumorigenesis and cancer stemness | Li J, Pu T, Yin L, Li Q, Liao C-P, Wu BJ | 2020 | Oncogene | Oncology | Multiplex IHC | HALO |
| Multimodal In Vivo and Post-mortem Assessments of Tau in Lewy Body Disorders | Coughlin DG, Phillips JS, Roll E, Peterson C, Lobrovich R, Rascovsky K, Ungrady M, Wolk DA, Das S, Weintraub D, Lee EB, Trojanowski JQ, Shaw LM, Vaishnavi S, Siderowf A, Nasrallah IM, Irwin DJ, McMillan CT | 2020 | Neurobiology of Aging | Neuroscience | Area Quantification | HALO |
| B7-H3 immune checkpoint expression is a poor prognostic factor in colorectal carcinoma | Lu Z, Zhao Z-X, Cheng P, Huang F, Guan X, Zhang M-G, Chen H-P, Liu Z, Jiang Z, Zheng Z-X, Zou S-M, Wang X-S | 2020 | Modern Pathology | Immuno-oncology | Multiplex IHC, TMA | HALO |
| Chemoradiotherapy efficacy is predicted by intra-tumour CD8+/FoxP3+ double positive T cell density in locally advanced N2 non–small-cell lung carcinoma | Boulle G, Velut Y, Mansuet-Lupo A, Gibault L, Blons H, Fournel L, Boni A, Cremer I, Wislez M, Duchatelle V, Tredaniel J, Hammond SA, Herbst R, Alifano M, Giraud P, Damotte D | 2020 | European Journal of Cancer | Oncology | Highplex FL | HALO |
| Neonatal hydrocephalus leads to white matter neuroinflammation and injury in the corpus callosum of Ccdc39 hydrocephalic mice | Goulding DS, Vogel RC, Pandya CD, Shula C, Gensel JC, Mangano FT, Goto J, Miller BA | 2020 | Journal of Neurosurgery | Immunology, Neuroscience | Multiplex IHC, Highplex FL | HALO |
| The RAC1 target NCKAP1 plays a crucial role in progression of BRAF/PTEN -driven melanoma in mice | Swaminathan K, Campbell A, Papalazarou V, Jaber-Hijazi F, Nixon C, McGhee E, Strathdee D, Sansom OJ, Machesky LM | 2020 | Journal of Investigative Dermatology | Oncology, Dermatology | Area Quantification, Multiplex IHC | HALO |
| Intraductal pancreatic cancer is less responsive than cancer in the stroma to neoadjuvant chemotherapy | Fujikura K, Hutchings D, Braxton AM, Zhu Q, Laheru DA, Hruban RH, Thompson ED, Wood LD | 2020 | Modern Pathology | Oncology | Multiplex IHC | HALO |
| RNA isoform screens uncover the essentiality and tumor-suppressor activity of ultraconserved poison exons | Thomas JD, Polaski JT, Feng Q, De Neef EJ, Hoppe ER, McSharry MV, Pangallo J, Gabel AM, Belleville AE, Watson J, Nkinsi NT, Berger AH, Bradley RK | 2020 | Nature Genetics | Other | Highplex FL | HALO |
| Glucagon Receptor Inhibition Reduces Hyperammonemia and Lethality in Male Mice with Urea Cycle Disorder | Cavino K, Sung B, Su Q, Na E, Kim J, Cheng X, Gromada J, Okamoto H | 2020 | Endocrinology | Metabolism | ISH/FISH, Multiplex IHC | HALO |
| Characterization of the tumor immune microenvironment in human papillomavirus-positive and -negative head and neck squamous cell carcinomas | Succaria F, Kvistborg P, Stein JE, Engle EL, McMiller TL, Rooper LM, Thompson E, Berger AE, van den Brekel M, Zuur CL, Haanen J, Topalian SL, Taube JM | 2020 | Cancer Immunology, Immunotherapy | Immuno-oncology | Immune | HALO |
| Temporospatial Development of Neuropathologic Findings in a Canine Model of Mucopolysaccharidosis IIIB | Harm TA, Hostetter SJ, Nenninger AS, Valentine BN, Ellinwood NM, Smith JD | 2020 | Veterinary Pathology | Immunology, Neuroscience | Area Quantification, Cytonuclear | HALO |
| Development of a clinically relevant ovarian cancer model incorporating surgical cytoreduction to evaluate treatment of micro-metastatic disease | Morse CB, Voillet V, Bates BM, Chiu EY, Garcia NM, Gottardo R, Greenberg PD, Anderson KG | 2020 | Gynecologic Oncology | Oncology | Multiplex IHC | HALO |
| PIK3CA mutation and CNV status and post-chemoradiotherapy survival in patients with cervical cancer | Martell K, McIntyre JB, Kornaga EN, Chan AMY, Phan T, Kobel M, Enwere EK, Dean ML, Ghatage P, Lees-Miller SP, Doll CM | 2020 | Gynecologic Oncology | Oncology | Classifier, Highplex FL, TMA | HALO |
| PLX3397 treatment inhibits constitutive CSF1R-induced oncogenic ERK signaling, reduces tumor growth, and metastatic burden in osteosarcoma | Smeester BA, Slipek NJ, Pomeroy EJ, Laoharawee K, Osum SH, Larsson AT, Williams KB, Stratton N, Yamamoto K, Peterson JJ, Rathe SK, Mills LJ, Hudson WA, Crosby MR, Wang M, Rahramann EP, Moriarity SB, Largaespada DA | 2020 | Bone | Oncology | Cytonuclear, TMA | HALO |
| IFN-III is selectively produced by cDC1 and predicts good clinical outcome in breast cancer | Hubert M, Gobbini E, Couillault C, Manh T-PV, Doffin A-C, Berthet J, Rodriguez C, Ollion V, Kielbassa J, Sajous C, Treilleux I, Tredan O, Dubois B, Dalod M, Bendriss-Vermare N, Caux C, Valladeau-Guilemond J | 2020 | Immunology | Oncology | Highplex FL | HALO |
| Association between CD8 and PD‐L1 expression and outcomes after radical prostatectomy for localized prostate cancer | Vicier C, Ravi P, Kwak L, Werner L, Huang Y, Evan C, Loda M, Hamid AA, Sweeney CJ | 2020 | The Prostate | Immuno-oncology | Classifier, Highplex FL | HALO |
| α-Synuclein modulates tau spreading in mouse brains | Bassil F, Meymand ES, Brown HJ, Xu H, Cox TO, Pattabhiraman S, Maghames CM, Wu Q, Zhang B, Trojanowski JQ, Lee VM-Y | 2020 | Journal of Experimental Medicine | Neuroscience | Area Quantification | HALO |
| Clinicopathological significance of nerves in esophageal cancer | Griffin N, Rowe CW, Gao F, Jobling P, Wills V, Walker MM, Faulkner S, Hondermarck H | 2020 | The American Journal of Pathology | Oncology | Area Quantification | HALO |
| Discoidin Domain Receptor 1 (DDR1) is Necessary for Tissue Homeostasis in Pancreatic Injury and Pathogenesis of Pancreatic Ductal Adenocarcinoma | Ruggeri JM, Franco-Barraza J, Sohail A, Zhang Y, Long D, di Magliano MP, Cukierman E, Fridman R, Crawford HC | 2020 | The American Journal of Pathology | Oncology, Immunology | Cytonuclear, Multiplex IHC, Highplex FL | HALO |
| Expression of SARS-CoV-2 Entry Factors in the Pancreas of Normal Organ Donors and Individuals with COVID-19 | Kusmartseva I, Wu W, Syed F, Van Der Heide V, Jorgensen M, Joseph P, Tang X, Candelario-Jalil E, Yang C, Nick H, Harbert J, Posgai A, Paulsen J, Lloyd R, Cechin S, Pugliese A, Campbell-Thomson M, Vander Heide R, Evans-Molina C, Homann D, Atkinson M | 2020 | Cell Metabolism | Infectious Disease | Area Quantification | HALO |
| A single cell atlas reveals distinct immune landscapes in transplant and primary tumors that determine response or resistance to immunotherapy | Wisdom AJ, Mowery YM, Hong CS, Qin X, Zhang D, Himes JE, Chen L, Fradin H, Muise ES, Xu ES, Carpenter DJ, Kent CL, Smythe KS, Williams N, Luo L, Ma Y, Owzar K, Bradley T, Kirsch DG | 2020 | Nature Communications | Oncology, Immuno-oncology | Cytonuclear | HALO |
| A Deep Learning Approach for Tissue Spatial Quantification and Genomic Correlations of Histopathological Images | Lu Z, Zhan X, Wu Y, Chng J, Shao W, Ni D, Han Z, Zhang J, Feng Q, Huang K | 2020 | Genomics, Proteomics & Bioinformatics | Review | HALO | |
| CD117/c-kit Defines a Prostate CSC-Like Subpopulation Driving Progression and TKI Resistance | Koran S. Harris, Shi L, Foster BM, Mobley ME, Elliott PL, Song CJ, Watabe K, Langefeld CD, Kerr BA | 2020 | Scientific Reports | Oncology | HALO | |
| ABCF1 regulates dsDNA-induced immune responses in human airway epithelial cells | Cao QT, Aguiar JA, Tremblay BJ-M, Abbas N, Tiessen N, Revill S, Makhdami N, Ayoub A, Cox G, Ask K, Doxey AC, Hirota JA | 2020 | Frontiers in Cellular and Infection Microbiology | Immunology | HALO | |
| Detection of engineered T cells in FFPE tissue by multiplex in situ hybridization and immunohistochemistry | Wright JH, Huang L-Y, Weaver S, Archila LD, McAfee MS, Hirayama AV, Chapuis AG, Bleakley M, Rongvaux A, Turtle CJ, Chanthaphavong S, Campbell JS, Pierce RH | 2020 | Journal of Immunological Methods | Immunology | ISH/FISH, ISH-IHC/FISH-IF | HALO |
| Transcriptomic analysis links diverse hypothalamic cell types to fibroblast growth factor 1-induced sustained diabetes remission | Bentsen MA, Rausch DM, Mirzadeh Z, Muta K, Scarlett JM, Brown JM, Herranz-Perez V, Baquero AF, Thompson J, Alonge KM, Faber CL, Kaiyala KJ, Bennett C, Pyke C, Ratner C, Egerod KL, Holst B, Meek TH, Kutlu B, Zhang Y, Sparso T, Grove KL, Morton GJ, Kornum BR, Garcia-Verdugo J-M, Secher A, Jorgensen R, Schwartz MW, Pers TH | 2020 | Nature Communications | Metabolism | ISH/FISH | HALO |
| Mesenchyme-derived IGF2 is a major paracrine regulator of pancreatic growth and function | Hammerle CM, Sandovici I, Brierley GV, Smith NM, Zimmer WE, Zvetkova I, Prosser HM, Sekita Y, Lam BYH, Ma M, Cooper WN, Vidal-Puig A, Ozanne SE, Medina-Gomez G, Constancia M | 2020 | PLOS Genetics | Toxicology | HALO, HALO AI | |
| Prognostic Integrated Image-Based Immune and Molecular Profiling in Early-Stage Endometrial Cancer | Horeweg N, de Bruyn M, Nout R, Stelloo E, Kedzierska K, Leon-Castillo A, Plat A, Mertz K, Osse M, Jurgenliemk-Schulz I, Lutgens L, Jobsen J, van der Steen-Banasik E, Smit V, Creutzberg C, Bosse T, Nijman H, Koelzer V, Church D | 2020 | Cancer Immunology Research | Oncology | TMA | HALO, HALO AI |
| Comparing Deep Learning and Immunohistochemistry in Determining the Site of Origin for Well-Differentiated Neuroendocrine Tumors | Redemann J, Schultz F, Martinez C, Harrell M, Clark D, Martin D, Hanson J | 2020 | Journal of Pathology Informatics | Oncology | Cytonuclear | HALO, HALO AI |
| Independent Prognostic Value of Intratumoral Heterogeneity and Immune Response Features by Automated Digital Immunohistochemistry Analysis in Early Hormone Receptor-Positive Breast Carcinoma | Zilenaite D, Rasmusson A, Augulis R, Besuparis J, Laurinaviciene A, Plancoulaine B, Ostpenko V, Laurinavicius | 2020 | Frontiers in Oncology | Oncology | Multiplex IHC | HALO, HALO AI |
| Naproxen chemoprevention promotes immune activation in Lynch syndrome colorectal mucosa | Reyes-Uribe L, Wu W, Gelincik O, Bommi PV, Francisco-Cruz A, Solis LM, Lynch PM, Lim R, Stoffel EM, Kanth P, Samadder NJ, Mork ME, Taggart MW, Milne GL, Marnett LJ, Vornik L, Liu DD, Revuelta M, Chang K, You YN, Kopelovich L, Wistuba II, Lee JJ, Sei S, Shoemaker RH, Szabo E, Richmond E, Umar A, Perloff M, Brown PH, Lipkin SM, Vilar E | 2020 | Gut | Oncology | Classifier, Cytonuclear | HALO |
| Tumor vessel normalization, immuno-stimulatory reprogramming, and improved survival in glioblastoma with combined inhibition of PD-1, angiopoietin-2, and VEGF | Di Tacchio M, Macas J, Weissenberger J, Sommer K, Bähr O, Steinbach JP, Senft C, Seifert V, Glas M, Herrlinger U, Krex D, Meinhardt M, Weyerbrock A, Timmer M, Goldbrunner R, Deckert M, Scheel AH, Büttner R, Grauer OM, Schittenhelm J, Tabatabai G, Harter PN, Guenther S, Devraj K, Plate KH, Reiss Y | 2020 | Cancer Immunology Research | Oncology, Immuno-oncology | Classifier, Cytonuclear | HALO |
| The membrane protein sortilin can be targeted to inhibit pancreatic cancer cell invasion | Gao F, Griffin N, Faulkner S, Li X, King SJ, Jobling P, Denham JW, Jiang CC, Hondermarck H | 2020 | The American Journal of Pathology | Oncology | HALO | |
| Spatial immune profiling of the colorectal tumor microenvironment predicts good outcome in stage II patients | Nearchou IP, Gwyther BM, Georgiakakis ECT, Gavriel CG, Kajiwara Y, Ueno H, Harrison DJ, Caie PD | 2020 | Digital Medicine | Immuno-oncology | Classifier, Area Quantification, Spatial Analysis | HALO |
| Multiparametric Analyses of Hepatocellular Carcinoma Somatic Mouse Models and Their Associated Tumor Microenvironment | Taranto D, Ramirez C, Vegna S, et al. | 2021 | Current Protocols | Oncology | Multiplex IHC | HALO |
| Fasting reverses drug-resistance in hepatocellular carcinoma through p53-dependent metabolic synergism | Krstic J, Reinisch I, Schindlmaier K, Galhuber M, Berger N, Kupper N, Moyschewitz E, Auer M, Michenthaler H, Nössing C, Depaoli MR, Ramadani-Muja J, Stryeck S, Pichler M, Rinner B, Deutsch AJA, Reinisch A, Madl T, Chiozzi RZ, Heck AJR, Huch M, Malli R, Prokesch A | 2021 | bioRxiv | Oncology | Classifier, Cytonuclear | HALO |
| IL-1-driven stromal-neutrophil interaction in deep ulcers defines a pathotype of therapy non-responsive inflammatory bowel disease | Friedrich M, Pohin M, Jackson MA, Korsunsky I, Bullers S, Rue-Albrecht K, Christoforidou Z, Sathananthan D, Ravindran R, Peres RS, Sharpe H, Wei K, Watts GFM, Mann EH, Geremia A, Thomas T, Attar M, Oxford IBD Cohort Investigators, Roche Fibroblast Network Consortium, McCuaig S, Thomas L, Collantes E, Uhlig HH, Sansom S, Easton A, Raychaudhuri S, Travis SP, Powrie FM | 2021 | bioRxiv | Immunology | Cytonuclear | HALO |
| Atypical chemokine receptor 3 (ACKR3) induces the perturbation of rRNA biogenesis in colonic cells: a novel mechanism of colorectal tumorigenesis | Yang J, Li Y, Pan T, Miao R, Zhang Y, Wu S, Qu X, Cui S | 2021 | Research Square | Oncology | Area Quantification | HALO |
| A faithful in vivo model of human macrophages in metastatic melanoma | Voillet V, Berger T, McKenna K, Paulson K, Smythe K, Hunter D, Valente W, Weaver S, Campbell J, Kim T, Byrd D, Bielas J, Pierce R, Chapuis A, Gottardo R, Rongvaux | 2021 | bioRxiv | Oncology, Immuno-oncology | HALO | |
| Absolute copy number fitting from shallow whole genome sequencing data | Sauer C, Eldridge M, Vias M, Hall J, Boyle S, Macintyre G, Bradley T, Markowetz F, Brenton J | 2021 | bioRxiv | Oncology | Classifier | HALO |
| Tissue-resident FOLR2+ macrophages associate with tumor-infiltrating CD8+ T cells and with increased survival of breast cancer patients | Ramos, R, Missolo-Koussou Y, Gerber-Ferder Y, Bromley C, Bugatti M, Nunez N, Tosello J, Richer W, Denizeau J, Sedlik C, Caudana P, Kotsias F, Niborski L, Viel S, Bohec M, Lameiras S, Baulande S, Lesage L, Nicolas A, Mesure D, Vincent-Salomon A, Reyal F, Dutertre C, Ginhoux F, Vimeux L, Donnadieu E, Buttard B, Galon J, Zelenay S, Vermi W, Guermonprez P, Piaggio E, Helft J | 2021 | bioRxiv | Immuno-oncology | HALO | |
| Localization of KRAS downstream target ARL4C to invasive pseudopods accelerates pancreatic cancer cell invasion | Harada A, Matsumoto S, Yasumizu Y, Akama T, Eguchi H, Kikuchi A | 2021 | bioRxiv | Oncology | Area Quantification | HALO |
| Investigation of Breast Cancer Microstructure and Microvasculature from Time-Dependent DWI and CEST in Correlation with Histological Biomarkers | Someya Y, Iima M, Imai H, Yoshizawa A, Kataoka M, Isoda H, Le Bihan D, Nakamoto Y | 2021 | Research Square | Oncology | Classifier, Multiplex IHC | HALO |
| Study on Molecular Mechanism of Benzo (ɑ) pyrene on CMA by HSP90ɑ and HIF-1ɑ | Zhang S, Liu T, Chen Q, Bai T, Zhang M, Hu Y, Li J, Chang F | 2021 | Research Square | Oncology | HALO | |
| Tumor Heterogeneity in VHL Drives Metastasis in Clear Cell Renal Cell Carcinoma | Hu J, Tan P, Ishihara M, Bayley N, Schokrpur S, Reynoso J, Jat P, Van Snick J, Knudsen B, Chin A, Prins R, Graeber T, Xu H, Wu L | 2021 | Research Square | Oncology | Multiplex IHC, Spatial Analysis, Highplex FL | HALO |
| Multiplex Immunohistochemical Phenotyping of T Cells in Primary Prostate Cancer | Ozbek B, Ertunc O, Erickson A, Vidal I, Alexandre C, Guner G, Hicks J, Jones T, Taube J, Sfanos K, Yegnasubramanian S, DeMarzo A | 2021 | medRxiv | Immuno-oncology | Classifier, Cytonuclear, Highplex FL, Serial Section, Registration | HALO |
| Integrated functional and spatial profiling of tumor immune responses induced by immunotherapy: the iPROFILER platform | Koelzer V, Herzig P, Zlobec I, Heinzelmann V, Lardinois D, Walseng E, Rader C, Mertz K, Zippelius A, Thommen D | 2021 | Immuno-Oncology and Technology | Immuno-oncology | Cytonuclear, Multiplex IHC | HALO, HALO AI |
| IgA transcytosis and antigen recognition govern ovarian cancer immunity | Biswas S, Mandal G, Payne KK, Anadon CM, Gatenbee CD, Chaurio RA, Costich TL, Moran C, Harro CM, Rigolizzo KE, Mine JA, Trillo-Tinoco J, Sasamoto N, Terry KL, Marchion D, Buras A, Wenham RM, Yu X, Townsend MK, Tworoger SS, Rodriguez CR, Anderson AR, Conejo-Garcia JR | 2021 | Nature | Immuno-oncology | Highplex FL | HALO |
| Hepatic stellate cells suppress NK cell-sustained breast cancer dormancy | Correia A Guimaraes J, Auf der Maur P, et al. | 2021 | Nature | Immuno-oncology | Classifier | HALO |
| A clinically applicable integrative molecular classification of meningiomas | Nassiri F, Liu J, Patil V, Mamatjan Y, Wang J, Hugh-White R, Macklin A, Khan S, Singh O, Karimi S, Corona R, Liu L, Chen C, Chakravarthy A, Wei Q, Mehani B, Suppiah S, Gao A, Workewych A, Tabatabai G, Boutros P, Bader G, de Carvalho D, Kislinger T, Aldape K, Zadeh G | 2021 | Nature | Oncology | Multiplex IHC | HALO |
| Analysis of multispectral imaging with the AstroPath platform informs efficacy of PD-1 blockade | Berry S, Giraldo N, Green B, et al | 2021 | Science | Immuno-oncology | HALO | |
| Spatially organized multicellular immune hubs in human colorectal cancer | Pelka K, Hofree M, Chen J, Sarkizova S, Pirl J, Jorgji V, Bejnood A, Dionne D, Ge W, Xu K, Chao S, Zollinger D, Lieb D, Reeves J, Fuhrman C, Hoang M, Delorey T, Nguyen L, Waldman J, Klapholz M, Wakiro I, Cohen O, Albers, J, Smillie C, Cuoco M, Wu J, Su M, Yeung J, Vijaykumar B, Magnuson A, Asinovski N, Moll T, Goder-Reise M, Applebaum A, Brais L, DelloStritto L, Denning S, Phillips S, Hill E, Meehan J, Frederick D, Sharova T, Kanodia A, Todres E, Jane-Valbuena J, Biton M, Izar B, Lambden C, Clancy T, Bleday R, Melnitchouk N, Irani J, Kunitake H, Berger D, Srivastava A, Hornick J, Ogino S, Rotem A, Vigneau S, Johnson B, Corcoran R, Sharpe A, Kuchroo V, Ng K, Giannakis M, Nieman L, Boland G, Arguirre A, Anderson A, Rosenblatt-Rosen O, Regev A, Hachohen N | 2021 | Cell | Oncology | Spatial Analysis, ISH-IHC/FISH-IF | HALO |
| Pharmacologic modulation of RNA splicing enhances anti-tumor immunity | Lu S, De Neef E, Thomas J, Sabio E, Rousseau B, Gigoux M, Knorr D, Greenbaum B, Elhanti Y, Hogg S, Chow A, Ghosh A, Xie A, Zamarin D, Cui D, Erickson C, Singer M, Cho H, Wang E, Lu B, Durham B, Shah H, Chowell D, Gabel A, Shen Y, Liu J, Jin J, Rhodes M, Taylor R, Molina H, Wolchok J, Merghoub T, Diaz Jr. L, Abdel-Wahab O, Bradley B | 2021 | Cell | Oncology | Multiplex IHC | HALO |
| Cabozantinib for neurofibromatosis type 1–related plexiform neurofibromas: a phase 2 trial | Fisher MJ, Shih C-S, Rhodes SD, Armstrong AE, Wolters PL, Dombi E, Zhang C, Angus SP, Johnson GL, Packer RJ, Allen JC, Ullrich NJ, Goldman S, Gutmann DH, Plotkin SR, Rosser T, Robertson KA, Widemann BC, Smith AE, Bessler WK, He Y, Park S-J, Mund JA, Jiang L, Bijangi-Vishehsaraei K, Robinson CT, Cutter GR, Korf BR, Neurofibromatosis Clinical Trials Consortium, Blakeley JO, Clapp DW | 2021 | Nature Medicine | Oncology | Area Quantification | HALO |
| An ex vivo tumor fragment platform to dissect response to PD-1 blockade in cancer | Voabil P, de Bruijn M, Roelofsen L, Hendriks S, Brokamp S, van den Braber M, Broeks A, Sanders J, Herzig P, Zippelius A, Blank C, Hartemink K, Monkhorst K, Haanen J, Schumacher T, Thommen D | 2021 | Nature Medicine | Immuno-oncology | Classifier, Multiplex IHC | HALO |
| MNK inhibition sensitizes KRAS-mutant colorectal cancer to mTORC1 inhibition by reducing eIF4E phosphorylation and c-MYC expression | Knight J, Alexandrou C, Skalka G, Vlahov N, Pennel K, Officer L, Teodosio A, Kanellos G, Gay D, May-Wilson S, Smith E, Najumudeen A, Gilroy K, Ridgway R, Flanagan D, Smith R, McDonald L, MacKay C, Cheasty A, McArthur K, Stanway E, Leach J, Jackstadt R, Waldron J, Campbell A, Vlachogiannis G, Valeri N, Haigis K, Sonenberg N, Proud C, Jones N, Swarbrick M, McKinnon H, Faller W, LeQuense J, Edwards J, Willis A, Bushell M, Sansom O | 2021 | Cancer Discovery | Oncology | HALO | |
| The amino acid transporter SLC7A5 is required for efficient growth of KRAS-mutant colorectal cancer | Najumudeen AK, Ceteci F, Fey SK, Hamm G, Steven RT, Hall H, Nikula CJ, Dexter A, Murta T, Race AM, Sumpton D, Vlahov N, Gay DM, Knight JRP, Jackstadt R, Leach JDG, Ridgway RA, Johnson ER, Nixon C, Hedley A, Gilroy K, Clark W, Malla SB, Dunne PD, Rodriguez-Blanco G, Critchlow SE, Mrowinska A, Malviya G, Solovyev D, Brown G, Lewis DY, Mackay GM, Strathdee D, Tardito S, Gottlieb E, CRUK Rosetta Grand Challenge Consortium, Takats Z, Barry ST, Goodwin RJA, Bunch J, Bushell M, Campbell AD, Sansom OJ | 2021 | Nature Genetics | Oncology | ISH/FISH | HALO |
| A comparability study of natural and deglycosylated PD-L1 levels in lung cancer: evidence from immunohistochemical analysis | Mei J, Xu J, Yang X, Gu D, Zhou W, Wang H, Liu C | 2021 | Molecular Cancer | Oncology | HALO | |
| Single-cell dissection of cellular components and interactions shaping the tumor immune phenotypes in ovarian cancer | Hornburg M, Desbois M, Lu S, Guan Y, Lo AA, Kaufman S, Elrod A, Lotstein A, DesRochers TM, Munoz-Rodriguez JL, Wang X, Giltnane J, Mayba O, Turley SJ, Bourgon R, Daemen A, Wang Y | 2021 | Cancer Cell | Immuno-oncology | ISH/FISH | HALO |
| Simultaneous targeting of TGF-b/PD-L1 synergizes with radiotherapy by reprogramming the tumor microenvironment to overcome immune evasion | Lan Y, Moustaga M, Knoll M, Xu C, Furkel J, Lazorchak A, Yeung T, Hasheminasab S, Jenkins M, Meister S, Yu H, Schlegel J, Marelli B, Tang Z, Qin G, Klein C, Qi J, Zhou C, Locke G, Krunic D, Derner M, Schwager C, Fontana R, Kriegsmann K, Jiang F, Rein K, Kriegsmann M, Debus J, Lo K, Abdollahi A | 2021 | Cancer Cell | Oncology | Cytonuclear | HALO |
| Three subtypes of lung cancer fibroblasts definedistinct therapeutic paradigms | Hu H, Peotrowska Z, Hare P, Chen H, Mulvey H, Mayfield A, Noeen S, Kattermann K, Greenberg M, Williams A, Riley A, Wilson J, Mao Y, Huang R, Banwait M, Ho J, Crowther G, Hariri L, Sequist L, Benes C, Niederst M, Engelman J | 2021 | Cancer Cell | Oncology | Cytonuclear, ISH/FISH | HALO |
| Neoadjuvant cabozantinib and nivolumab convert locally advanced hepatocellular carcinoma into resectable disease with enhanced antitumor immunity | Ho W, Zhu Q, Durham J, Popovic A, Xavier S, Leatherman J, Mohan A, Mo G, Zhang S, Gross N, Charmsaz S, Lin D, Quong D, Wilt B, Kamel I, Weiss M, Philosophe B, Burkhart R, Burns W, Schubert C, Ejaz A, He J, Deshpande A, Danilova L, Stein-O'Brien G, Sugar E, Laheru D, Anders R, Fertig E, Jaffee, E, Yarchoan M | 2021 | Nature Cancer | Oncology | HALO | |
| Cytotoxic lymphocytes target characteristic biophysical vulnerabilities in cancer | Bhanot U, MOrris L, Boire A, Hsu KC, Massague J, Huse M, Er EE | 2021 | Immunity | Immuno-oncology | HALO | |
| Selective loss of resident macrophage-derived insulin-like growth factor-1 abolishes adaptive cardiac growth to stress | Zaman R, Hamidzada H, Kantores C, Wong A, Dick S, Wang Y, Momen A, Aronoff L, Lin J, Razani B, Mital S, Billia F, Lavine K, Nejat S, Epelman S | 2021 | Immunity | Immunology | Highplex FL | HALO |
| Follicular lymphoma triggers phenotypic and functional remodeling of the human lymphoid stromal cell landscape | Mourcin F, Verdiere L, Roulois D, Amin R, Lamaison C, Sibut V, Thamphya B, Pangault C, Monvoisin C, Huet S, Seffals M, Saulande S, Mechta-Grigoriou F, Legoix P, Rossille D, Guirriec M, Leonard S, Cartron G, Salles G, Fest T, Tarte K | 2021 | Immunity | Immuno-oncology | HALO, HALO AI | |
| Blockade of the co-inhibitory molecule PD-1 unleashes ILC2-dependent antitumor immunity in melanoma | Jacquelot N, Seillet C, Wang M et al. | 2021 | Nature Immunology | Immuno-oncology | Classifier, Highplex FL | HALO |
| CD38 in Advanced Prostate Cancers | Guo C, Crespo M, Gurel B, Dolling D, Rekowski J, Sharp A, Petremolo A, Sumanasuriya S, Rodrigues DN, Ferreira A, Pereira R, Figueiredo I, Mehra N, Lambros MBK, Neeb A, Gil V, Seed G, Terstappen L, Alimonti A, Drake CG, Yuan W, de Bono JS | 2021 | European Urology | Oncology | Classifier, Highplex FL | HALO |
| Deleting DNMT3A in CAR T cells prevents exhaustion and enhances antitumor activity | Prinzing B, Zebley C, Petersen C, Fan Y, Anido A, Yi Z, Nguyen P, Houke H, Bell M, Haydar D, Brown C, Boi S, Alli S, Crawford J, Riberdy J, Park J, Zhou S, Velasquez M, DeRenzo C, Lazzarotto C, Tsai S, Vogel P, Pruett-Miller S, Langfitt D, Gottschalk S, Youngblood B, Krenciute G | 2021 | Science Translational Medicine | Immuno-oncology | Cytonuclear | HALO |
| The MK2/Hsp27 axis is a major survival mechanism for pancreatic ductal adenocarcinoma under genotoxic stress | Grierson P, Dodhiawala P, Cheng Y, Chen T, Khawar I, Wei Q, Zhang D, Li L, Herndon J, Monahan J, Ruzinova M, Lim K | 2021 | Science Translational Medicine | Oncology | Area Quantification, TMA | HALO |
| Immune-regulated IDO1-dependent tryptophan metabolism is source of one-carbon units for pancreatic cancer and stellate cells | Newman AC, Falcone M, Uribe AH, Zhang T, Athineos D, Pietzke M, Vazquez A, Blyth K, Maddocks ODK | 2021 | Molecular Cell | Immuno-oncology | Classifier, ISH/FISH | HALO |
| NR4A1 regulates expression of immediate early genes, suppressing replication stress in cancer | Guo H, Golczer G, Wittner B, Langenbucher A, Zachariah M, Dubash T, Hong X, Comaills V, Burr R, Ebright R, Horwitz E, Vuille J, Hajizadeh S, Wiley D, Reeves B, Zhang J, Niederhoffer K, Lu C, Wesley B, Ho U, Nieman L, Toner M, Vasudevan S, Zou L, Mostoslavsky R, Maheswaran S, Lawrence M, Haber D | 2021 | Molecular Cell | Oncology | Highplex FL | HALO |
| Prognostic Impact of CXCR7 and CXCL12 Expression in Patients with Esophageal Adenocarcinoma | Goto M, Shibahara Y, Baciu C, Allison F, Yeung JC, Darling GE, Liu M | 2021 | Thoracic Oncology | Oncology | HALO | |
| Rejection of benign melanocytic nevi by nevus-resident CD4+ T cells | Schiferle E, Cheon S, Ham S, Son H, Messerschmidt J, Lawrence D, Cohen J, Flaherty K, Moon J, Lian C, Sullivan R, Demehri S | 2021 | Science Advances | Oncology | Multiplex IHC | HALO |
| IgA-dominated humoral immune responses govern patients' outcome in endometrial cancer | Mandal G, Biswas S, Anadon C, Yu X, Gatenbee C, Prabhakaran S, Payne K, Chaurio R, Martin A, Innamarato P, Moran C, Powers J, Harro C, Mine J, Sprenger K, Rigolizzo K, Wang X, Curiel T, Rodriguez P, Anderson A, Saglam O, Conejo-Garcia J | 2021 | Cancer Research | Immuno-oncology | HALO | |
| Supraphysiologic Testosterone Induces Ferroptosis and Activates Immune Pathways through Nucleophagy in Prostate Cancer | Kumar R, Mendonca J, Owoyemi O, Boyapati K, Thomas N, Kanacharoen S, Coffey M, Topiwala D, Homes C, Ozbek B, Jones T, Rosen M, Dong L, Wiens S, Brennen W, Isaacs J, Marzo A, Markowski M, Antonarakis E, Qian D, Pienta K, Pardoll D, Carducci M, Denmeade S, Kachhap S | 2021 | Cancer Research | Oncology | Cytonuclear | HALO |
| Integrative molecular characterization of sarcomatoid and rhabdoid renal cell carcinoma | Bakouny Z, Braun DA, Shukla SA, Pan W, Gao X, Hou Y, Flaifel A, Tang S, Bosma-Moody A, He MX, Vokes N, Nyman J, Xie W, Nassar AH, Alaiwi SA, Flippot R, Bouchard G, Steinharter JA, Nuzzo PV, Ficial M, Sant’Angelo M, Forman J, Berchuck JE, Dudani S, Bi K, Park J, Camp S, Sticco-Ivins M, Hirsch L, Baca SC, Wind-Rotolo M, Ross-Macdonald P, Sun M, Mary Lee G-SM, Chang SL, Wei XX, McGregor BA, Harshman LC, Genovese G, Ellis L, Pomerantz M, Hirsch MS, Freedman ML, Atkins MB, Wu CJ, Ho TH, Linehan WM, McDermott DF, Heng DYC, Viswanathan SR, Signoretti S, Van Allen EM, Choueiri TK | 2021 | Nature Communications | Oncology | Highplex FL | HALO |
| Engineered red blood cells as an off-the-shelf allogeneic anti-tumor therapeutic | Zhang X, Lou M, Dastagir SR, Nixon M, Khamhoung A, Schmidt A, Lee A, Subbiah N, McLaughlin DC, Moore CL, Gribble M, Bayhi N, Amin V, Pepi R, Pawar S, Lyford TJ, Soman V, Mellen J, Carpenter CL, Turka LA, Wickham Tj, Chen TF | 2021 | Nature Communications | Oncology | Object Colocalization, Highplex FL | HALO |
| Oncogenic BRAF, unrestrained by TGFβ-receptor signalling, drives right-sided colonic tumorigenesis | Leach J, Vlahov N, Tsantoulis P, et al | 2021 | Nature Communications | Oncology | ISH/FISH, Highplex FL | HALO |
| Dissecting spatial heterogeneity and the immuneevasion mechanism of CTCs by single-cell RNA-seq in hepatocellular carcinoma | Sun Y, Wu L, Liu S, Jiang M, Hu B, Zhou K, Guo W, Xu Y, Zhong Y, Zhou X, Zhang Z, Liu G, Liu S, Shi Y, Ji Y, Du M, Li N, Li G, Zhao Z, Huang X, Xu L, Yu Q, Peng D, Qiu S, Sun H, Dean M, Wang X, Chung W, Dennison A, Zhou J, Hou Y, Fan J, Yang X | 2021 | Nature Communications | Oncology, Immuno-oncology | Highplex FL | HALO |
| GOT1 inhibition promotes pancreatic cancer cell death by ferroptosis | Kremer D, Nelson B, Lin L, Yarosz E Halbrook C, Kerk S, Sajjakulnukit P, Myers A, Thurston G, Hou S, Carpenter E, Andren A, Nwosu Z, Cusmano N, Wisner S, Mbah N, Shan M, Das N, Magnuson B, Little A, Savani M, Ramos J, Gao T, Sastra S, Palermo C, Badgley M, Zhang L, Asara J, McBrayer S, Pasca di Magliano M, Crawford H, Shah Y, Olive K, Lyssiotis C | 2021 | Nature Communications | Oncology | HALO | |
| Androgen Receptor Signalling in Macrophages Promotes TREM-1-mediated Cancer Cell Line Migration and Invasion | Cioni B, Zaalberg A, van Beihnum J, Melis M, van Brugsteden J, Muraro M, Hooijberg E, Peters D, Hofland I, Lubeck Y, de Jong J, Sanders J, Vivie J, van der Poel J, Griffioen A, Zwart W, Bergman A | 2021 | Nature Communications | Oncology | Highplex FL | HALO |
| Pilot study of Tremelimumab with and without cryoablation in patients with metastatic renal cell carcinoma | Campbell M, Matin S, Tam A, Sheth R, Ahrar K, Tidwell R, Rao P, Karam J, Wood C, Tannir N, Jonasch E, Gao J, Zurita A, Shah A, Jindal S, Duan F, Basu S, Chen H, Espejo A, Allison J, Yadav S, Sharma P | 2021 | Nature Communications | Oncology | Cytonuclear | HALO |
| Cancer immune therapy with PD-1-dependent CD137 co-stimulation provides localized tumour killing without systemic toxicity | Qiao Y, Qiu Y, Ding J, Luo N, Wang H, Ling X, Sun J, Wu Z, Wang Y, Liu Y, Guo F, Sun T, Shen W, Zhang M, Wu D, Chen B, Xu W, Wang X | 2021 | Nature Communications | Immuno-oncology | HALO | |
| Soluble guanylate cyclase signalling mediates etoposide resistance in progressing small cell lung cancer | Schenk M, Humprey S, Hossain A, Revill M, Pearsall S, Lallo A, Brown S, Bratt S, Galvin M, Descamps T, Zhou C, Pearce S, Priest L, Greenhalgh M, Chaturvedi A, Kerr A, Blackhall F, Dive C, Frese K | 2021 | Nature Communications | Oncology | Classifier, Area Quantification | HALO |
| Nuclear pore protein NUP210 depletion suppresses metastasis through heterochromatin-mediated disruption of tumor cell mechanical response | Amin R, Shukla A, Zhu J, Kim S, Wang P, Tian S, Tran A, Paul D, Cappell S, Burkett S, Liu H, Lee M, Kruhlak M, Dwyer J, Simpson R, Hager G, Ruan Y, Hunter K | 2021 | Nature Communications | Oncology | Area Quantification | HALO, HALO AI |
| *Immune cell topography predicts response to PD-1 blockade in cutaneous T cell lymphoma | Phillips D, Matusiak M, Gutierrez BR, Bhate SS, Barlow GL, Jiang S, Demeter J, Smythe KS, Pierce RH, Fling SP, Ramchurren N, Cheever MA, Goltsev Y, West RB, Khodadoust MS, Kim YH, Schürch CM, Nolan GP | 2021 | Nature Communications | Immuno-oncology | HALO | |
| Heterocellular OSM-OSMR signalling reprograms fibroblasts to promote pancreatic cancer growth and metastasis | Lee B, Hogg E, Below C, Kononov A, Blanco-Gomez A, Heider F, Xu J, Hutton C, Zhang X, Scheidt T, Beattie K, Lamarca A, McNamara M, Valle J, Jorgensen C | 2021 | Nature Communications | Oncology | Classifier | HALO |
| Neoadjuvant immunotherapy with nivolumab and ipilimumab induces major pathological responses in patients with head and neck squamous cell carcinoma | Vos J, Elbers J, Krijgsman O, Traets J, Qiao X, van der Leun A, Lubeck Y, Seignette I, Smit L, Willems S, van den Brekel M, Dirven R, Karakullukcu B, Karssemakers L, Klop W, Lohuis P, Schreuder W, Smeele L, van der Velden L, Tan I, Onderwater S, Jasperse B, Vogel W, Al-Mamgani A, Keijser A, van der Noort V, Broeks A, Hooijberg E, Peeper D, Schumacher T, Blank C, de Boer J, Haanen J, Zuur C | 2021 | Nature Communications | Oncology | Classifier, Highplex FL | HALO |
| Neoadjuvant PD-1 blockade induces T cell and cDC1 activation but fails to overcome the immunosuppressive tumor associated macrophages in recurrent glioblastoma | Lee A, Mochizuki A, Reynoso J, Orpilla J, Chow F, Kienzler J, Everson R, Nathanson D, Bensinger S, Liau L, Cloughesy T, Hugo W, Prins R | 2021 | Nature Communications | Immuno-oncology | HALO | |
| A growth factor–expressing macrophage subpopulation orchestrates regenerative inflammation via GDF-15 | Patsalos A, Halasz L, Medina-Serpas M, Berger W, Daniel B, Tzerpos P, Kiss M, Nagy G, Fischer C, Simandi Z, Varga T, Nagy L | 2021 | Journal of Experimental Medicine | Immunology | Muscle Fiber | HALO |
| CD98-induced CD147 signaling stabilizes the Foxp3 protein to maintain tissue homeostasis | Geng J, Chen R, Yang F, Lin P, Zhu Y, Fu X, Wang K, Feng Z, Wu J, Zhang H, Li Q, Chen Z, Zhu P | 2021 | Cellular and Molecular Immunology | Immuno-oncology | HALO | |
| Developing T cells form an immunological synapse for passage through the β-selection checkpoint | Allam A, Charnley M, Pham K, Russel S | 2021 | Journal of Cell Biology | Immunology | Highplex FL | HALO |
| The immune suppressive microenvironment affects efficacy of radio-immunotherapy in brain metastasis | Niesel K, Schulz M, Anthes J, Alekseeva T, Macas J, Salamero-Boix A, Mockl A, Oberwahrenbrock T, Lolies M, Stein S, Plate KH, Reiss Y, Rodel F, Sevenich L | 2021 | EMBO Molecular Medicine | Immuno-oncology | Spatial Analysis, Highplex FL | HALO |
| Pathways of immune exclusion in metastatic osteosarcoma are associated with inferior patient outcomes | Ligon JA, Choi W, Cojocaru G, Fu W, Hsiue EH-C, Oke TF, Siegel N, Fong MH, Ladle B, Pratilas CA, Morris CD, Levin A, Rhee DS, Meyer CF, Tam AJ, Blosser R, Thompson ED, Suru A, McConkey D, Housseau F, Anders R, Pardoll DM, Llosa N | 2021 | Journal for ImmunoTherapy of Cancer | Immuno-oncology | Multiplex IHC | HALO |
| Attenuating CD3 affinity in a PSMAxCD3 bispecific antibody enables killing of prostate tumor cells with reduced cytokine release | Dang K, Castello G, Clarke S, et al. | 2021 | Journal for Immunotherapy of Cancer | Immuno-oncology | Multiplex IHC | HALO |
| Heterogeneity in tertiary lymphoid structure B-cells correlates with patient survival in metastatic melanoma | Lynch K, Young S, Menaveau M, et al. | 2021 | Journal for Immunotherapy of Cancer | Immuno-oncology | Highplex FL | HALO |
| Combined CTLA-4 and PD-L1 blockade in patients with chemotherapy-naïve metastatic castration-resistant prostate cancer is associated with increased myeloid and neutrophil immune subsets in the bone microenvironment | Subudhi S, Siddiqui B, Aparicio A, Yadav S, Basu S, Chen H, Jindal S, Tidwell R, Varma A, Logothetis C, Allison J, Corn P, Sharma P | 2021 | Journal for ImmunoTherapy of Cancer | Immuno-oncology | HALO | |
| Inhibition of Hedgehog signaling alters fibroblast composition in pancreatic cancer | Steele NG, Biffi G, Kemp SB, Zhang Y, Drouillard D, Syu L-J, Hao Y, Oni TE, Brosnan E, Elyada E, Doshi A, Hansma C, Espinoza C, Abbas A, The S, Irizarry-Negron VM, Halbrook CJ, Franks N, Hoffman M, Brown KL, Carpenter ES, Nwosu ZC, Johnson C, Lima F, Anderson MA, Park Y, Crawford HC, Lyssiotis CA, Frankel TF, Rao A, Bednar F, Dlugosz AA, Preall J, Tuveson DA, Allen B, di Magliano MP | 2021 | Clinical Cancer Research | Oncology | Area Quantification | HALO |
| Imaging Tumor-Infiltrating Lymphocytes in Brain Tumors with [64Cu]Cu-NOTA-anti-CD8-Positron Emission Tomography | Nagle V, Henry K, Hertz C, et al. | 2021 | Clinical Cancer Research | Immuno-oncology | Multiplex IHC | HALO |
| Upregulation of C/EBPa Inhibits Suppressive Activity of Myeloid Cells and Potentiates Antitumor Response in Mice and Patients with Cancer | Hashimoto A, Sarker D, Reebye V, Jarvis S, Sodergren M, Kossenkov A, Raulf N, Vasara J, Andrikakou P, Meyer T, Huang K, Plummer R, Chee C, Spalding D, Pai M, Khan S, Pinato D, Sharma R, Basu B, Palmer D, Ma Y, Evans J, Habib R, Martirosyan A, Elasri N Reynaud A, Rossi J, Cobbold M, Habib N, Gabrilovich D | 2021 | Clinical Cancer Research | Oncology, Immuno-oncology | Multiplex IHC | HALO |
| ATP-binding cassette transporters restrict drug delivery and efficacy against brain tumors even when blood-brain barrier integrity is lost | de Gooijer MC, Kemper EM, Buil LCM, Citirikkaya CH, Buckle T, Beijnen JH, van Tellingen O | 2021 | Cell Reports Medicine | Oncology | HALO | |
| Cooperative targeting of immunotherapy-resistant melanoma and lung cancer by an AXL-targeting antibody-drug conjugate and immune checkpoint blockade | Boshuizen J, Pencheva N, Krijgsman O, Altimari DD, Castro PG, de Bruijn B, Ligtenberg MA, den Heuvel EG, Vredevoogd DW, Song J-Y, Visser N, Apriamashvili G, Janmaat ML, Plantinga TS, Franken P, Houtkamp M, Lingnau A, Jure-Kunkel M, Peeper DS | 2021 | Cancer Research | Immuno-oncology | Multiplex IHC | HALO |
| Repeated porphyrin lipoprotein-based photodynamic therapy controls distant disease in mouse mesothelioma via the abscopal effect | Lou J, Aragaki M, Bernards N, Kinoshita T, Mo J Motooka Y, Ishiwata T, Gregor A, Chee T, Chen Z, Chen J, Kaga K, Wakasa S, Zheng G, Yasufuku K | 2021 | Nanophotonics | Oncology | Cytonuclear | HALO |
| SLFN11 captures cancer-immunity interactions associated with platinum sensitivity in high-grade serous ovarian cancer | Winkler C, King M, Berthe J, Ferraioli D, Garuti A, Grillo F, Rodriguez-Canales J, Ferrando L, Chopin N, Ray-Coquard I, Delpuech O, Bedognetti D, Ballestrero A, Leo E, Zoppoli G | 2021 | JCI Insight | Oncology | Classifier, Cytonuclear | HALO |
| Over-expression of Th2-related molecules in the skin of patients with eosinophilic dermatosis of hematologic malignancy | Maglie R, Ugolini F, De Logu F, Nassini R, Simi S, Nardiello P, Pasqualaini E, Baroini G, Del Bianco E, Massi D, Antiga E | 2021 | Journal of the American Academy of Dermatology | Oncology, Immuno-oncology | Area Quantification, Multiplex IHC | HALO, HALO Link |
| RIPK1 activation mediates neuroinflammation and disease progression in multiple sclerosis | Zelic M, Pontarelli F, Woodworth L, Zhu C, Mahan A, Ren Y, LaMorte M, Gruber R, Keane A, Loring P, Guo L, Xia T, Zhang B, Orning P, Lien E, Degterev A, Hammond T, Ofengeim D | 2021 | Cell Reports | Immunology | HALO | |
| SMAD4 represses FOSL1 expression and pancreatic cancer metastatic colonization | Dai C, Rennhack J, Arnoff T, Thaker M, Younger S, Doench J, Huang A, Yang A, Aguirre A, Wang B, Mun E, O'Connel J, Huang Y, Labella K, Talamas J, Li J, Ilic N, Hwang J, Hong A, Giacomelli A, Gjoerup O, Root D, Hahn W | 2021 | Cell Reports | Oncology | Area Quantification | HALO |
| Immuno-transcriptomic profiling of extracranial pediatric solid malignancies | Brohl A, Sindiri S, Wei J, Milewski D, Chou H, Song Y, Wen X, Kumar J, Reardon H, Mudunuri U, Collins J, Nagaraj S, Gangalapudi V, Tyagi M, Zhu Y, Masih K, Yohe M, Shern J, Qi Y, Turpin B, Leino D, Iwata S, Andrulis I, Wunder J, Toledo S, Meltzer P, Lau C, Teicher B, Magnan H, Ladanyi M, Khan J | 2021 | Cell Reports | Oncology | HALO | |
| Quantification of Human Epidermal Growth Factor Receptor 2 by Immunopeptide Enrichment and Targeted Mass Spectrometry in Formalin-Fixed Paraffin-Embedded and Frozen Breast Cancer Tissues | Kennedy J, Whiteaker J, Kennedy L, Bosch D, Lerch M, Schoenherr R, Zhao L, Lin C, Chowdhury S, Kilgore M, Allison K, Wang P, Hoofnagle A, Baird G, Paulovich A | 2021 | Clinical Chemistry | Oncology | Classifier | HALO |
| High estrogen receptor alpha activation confers resistance to estrogen deprivation and is required for therapeutic response to estrogen in breast cancer | Traphagen NA, Hosford SR, Jiang A, Marotti JD, Brauer BL, Demidenko E, Miller TW | 2021 | Oncogene | Oncology | HALO | |
| Cx43 phosphorylation sites regulate pancreatic cancer metastasis | Solan JL, Hingorani SR, Lampe PD | 2021 | Oncogene | Oncology | Classifier, Area Quantification | HALO |
| E3 ligase-inactivation rewires CBL interactome to elicit oncogenesis by hijacking RTK–CBL–CIN85 axis | Ahmed S, Buetow L, Gabrielsen M, Lilla S, Sibbet G, Sumpton D, Zanivan S, Hedley A, Clark W, Huang D | 2021 | Oncogene | Oncology | HALO | |
| PPAR-gamma induced AKT3 expression increases levels of mitochondrial biogenesis driving prostate cancer | Galbraith L, Mui E, Nixon C, Hedley A, Strachan D, MacKay G, Sumpton D, Sansom O, Leung H, Ahmad I | 2021 | Oncogene | Oncology | ISH/FISH | HALO |
| Selective targeting of MYC mRNA by stabilized antisense oligonucleotides | Gill T, Wang H, Bandaru R, Lawlor M, Lu C, Nieman L, Tao J, Zhang Y, Anderson D, Ting D, Chen X, Bradner J, Ott C | 2021 | Oncogene | Oncology | Multiplex IHC | HALO |
| MAOA promotes prostate cancer cell perineural invasion through SEMA3C/PlexinA2/NRP1–cMET signaling | Yin L, Li J, Wang J, Pu T, Wei J, Li Q, Wu B | 2021 | Oncogene | Oncology | Multiplex IHC | HALO |
| Distinct immune signatures in peripheral blood predict chemosensitivity in intrahepatic cholangiocarcinoma patients | Wu T, Yang Y, Zheng B, Shi X, Li W, Ma W, Wang S, Li Z, Zhu Y, Wu J, Wang K, Zhao Y, Wu R, Sui C, Shen S, Wu X, Chen L, Yuan Z, Wang H | 2021 | Engineering | Oncology, Immunology | Highplex FL | HALO |
| Anti-CAIX BBζ CAR4/8 T Cells Exhibit Superior Efficacy in a Clear Cell Renal Cell Carcinoma (ccRCC) Mouse Model | Wang Y, Buck A, Grimaud M, Culhane A, Kodangattil S, Razimbaud C, Bonal D, Nguyen Q, Zhu Z, Wei K, O'Donnell M, Huang Y, Signoretti S, Choueiri T, Freeman G, Zhu Q, Marasco | 2021 | Molecular Therapy: Oncolytics | Oncology | HALO | |
| ACT1 is required for murine IL-23-induced psoriasiform inflammation potentially independent of E3 ligase activity | Lipovsky A, Slivka PF, Su Z, Wang Y, Paulsboe S, Wetter J, Namovic MT, Gauvin D, Perron D, Gauld S, McGaragughty S, Goedken ER | 2021 | Journal of Investigative Dermatology | Immunology | Multiplex IHC | HALO |
| Radiation Therapy Enhanced by NBTXR3 Nanoparticles Overcomes Anti-PD1 Resistance and Evokes Abscopal Effects | Hu Y, Paris S, Barsoumian H, Abana C, He K, Wasley M, Younes A, Masrorpour F, Chen D, Yang L, Dunn J, Zhang J, Gandhi S, Nguyen Q, Cortez M, Welsh J | 2021 | International Journal of Oncology*Biology*Physics | Immuno-oncology | Multiplex IHC | HALO |
| Deep Learning-Based Annotation Transfer between Molecular Imaging Modalities: An Automated Workflow for Multimodal Data Integration | Race AM, Sutton D, Hamm G, Maglennon G, Morton JP, Strittmatter N, Campbell A, Sansom OJ, Wang Y, Barry ST, Takáts Z, Goodwin RJA, Bunch J | 2021 | Analytical Chemistry | Oncology | HALO, HALO AI | |
| Antibody-drug conjugate MORAb-202 exhibits long-lasting antitumor efficacy in TNBC PDx models | Furuuchi K, Rybinski K, Fulmer J, Moriyama T, Drozdowski B, Soto A, Fernando S, Wilson K, Milinichik A, Dula M, Tanaka K, Cheng X, Albone E, Uenaka T | 2021 | Cancer Science | Oncology | HALO | |
| The Tumor Immune Landscape and Architecture of Tertiary Lymphoid Structures in Urothelial Cancer | van Dijk N, Gil-Himenez A, Silina K, van Montfoort M, Einerhand S, Jonkman L, Voskuilen C, Peters D, Sanders J, Lubeck Y, Broeks A, Hooijberg E, Vis D, van den Broek M, Wessels L, van Rhijn B, van der Heijden M | 2021 | Frontiers in Immunology | Immuno-oncology | Spatial Analysis | HALO, HALO AI |
| Spatial Distribution and Predictive Significance of Dendritic Cells and Macrophages in Esophageal Cancer Treated With Combined Chemoradiotherapy and PD-1 Blockade | Ma X, Guo Z, Wie X, Zhao G, Han D, Zhang T, Chen X Cao F, Dong J, Zhao L, Yuan Z, Wang P, Pang Q, Yan C, Zhang W | 2021 | Frontiers in immunology | Oncology | Spatial Analysis, Highplex FL | HALO |
| Heterogeneity of programmed death-ligand 1 expression and infiltrating lymphocytes in paired resected primary and metastatic non-small cell lung cancer | Wu J, Sun W, Yang X, Wang H, Liu X, Chi K, Zhou L, Huang X, Mao L, Zhao S, Ding T, Meng B, Lin D | 2021 | Modern Pathology | Immuno-oncology | Spatial Analysis, Highplex FL | HALO |
| NP-ALT, a Liposomal:Peptide Drug, Blocks p27Kip1 Phosphorylation to Induce Oxidative Stress, Necroptosis, and Regression in Therapy-Resistant Breast Cancer Cells | Jilishitz I, Quinones J, Patel P, Chen G, Pasetsky J, VanInwegen A, Schoninger S, Jogalekar M, Tsiperson V, Yan L, Wu Y, Gottesman S, Somma J, Blain S | 2021 | Molecular Cancer Research | Oncology | Multiplex IHC | HALO |
| T cell-mediated anti-tumor immunity cooperatively induced by TGFβR1 antagonism and gemcitabine counteracts reformation of the stromal barrier in pancreatic cancer | Li D, Schaub N, Guerin T, Bapiro T, Richards F, Chen V, Talsania K, Kumar P, Gilbert D, Scholmer J, Kim S, Sorber R, Teper Y, Bautista W, Palena C, Ock C, Jodrell D, Pate N, Mehta M, Zhao Y, Kozlov S, Rudloff U | 2021 | Molecular Cancer Therapy | Immuno-oncology | Highplex FL | HALO |
| T Cell–Mediated Antitumor Immunity Cooperatively Induced By TGFbR1 Antagonism and Gemcitabine Counteracts Reformation of the Stromal Barrier in Pancreatic Cancer | Li D, Schaub N, Guerin T, Bapiro T, Richards F, Chen V, Talsania K, Kumar P, Gilbert D, Schlomer J, Kim S, Sorber R, Teper Y, Bautista W, Palena C, Ock C, Jodrell D, Pate N, Mahta M, Zhao Y, Kozlov S, Ridloff U | 2021 | Molecular Cancer Therapeutics | Immuno-oncology | Highplex FL | HALO |
| Tumor-immune landscape patterns before and after chemoradiation in resectable esophageal adenocarcinomas | Soeratram T, Creemers A, Meijer S, deBoer O, Vos W, Hooijer G, van Berge Henegouwen M, Hulshof M, Bergman J, Lei M, Bijlsma M, Ylstra B, van Grieken N, van Laarhoven H | 2021 | The Journal of Pathology | Immuno-oncology | Cytonuclear | HALO |
| mRNA translation is a therapeutic vulnerability necessary for bladder epithelial transformation | Jana S, Deo R, Hough R, et al. | 2021 | JCI Insight | Oncology | Multiplex IHC, Highplex FL | HALO |
| Epigenetic modifications precede molecular alterations and drive human hepatocarcinogenesis | Czauderna C, Poplawski A, O'Roourke C, Castven D, Pérez-Aguilar B, Becker D, Heilmann-Heimbach S, Odenthal M, Amer W, Schmiel M, Drebber U, Binder H, Ridder D, Schindeldecker M, Straub B, Galle P, Andersen J, Thorgeirsson S, Park Y, Marquardt J | 2021 | JCI Insight | Oncology | Cytonuclear, TMA | HALO |
| Aristolochic acid I promoted clonal expansion but did not induce hepatocellular carcinoma in adult rats | Liu Y, Lu H, Qi X, Xing G, Wang X, Yu P, Liu L, Yang F, Ding X, Deng Z, Gong L, Ren J | 2021 | Acta Pharmacologica Sinica | Oncology | Object Colocalization | HALO |
| Characterization of Macrophages and Osteoclasts in the Osteosarcoma Tumor Microenvironment at Diagnosis: New Perspective for Osteosarcoma Treatment? | Gomez-Brouchet A, Gilhodes J, Van Acker N, Brion R, Bouvier C, Assemat P, Gaspar N, Aubert S, Guinebretiere J-M, Marie B, Larousserie F, Entz-Werlé N, de Pinieux G, Mascard E, Gouin F, Brousset P, Tabone M-D, Jimenez M, Le Deley M-C, Blay J-Y, Brugieres L , Piperno-Neumann S, Rédini F | 2021 | Cancers | Immuno-oncology | Highplex FL | HALO |
| Activated Regulatory T-Cells, Dysfunctional and SenescentT-Cells Hinder the Immunity in Pancreatic Cancer | Sivakumar S, Abu-Shah E, Ahern DJ, Arbe-Barnes EH, Jainarayanan AK, Mangal N, Reddy S, Rendek A, Easton A, Kurz E, Silva M, Soonawalla Z, Heij LR, Bashford-Rogers R, Middleton MR, DUstin ML | 2021 | cancers | Immuno-oncology | Classifier, Multiplex IHC, Spatial Analysis, Highplex FL | HALO |
| Automated Detection and Classification of Desmoplastic Reaction at the Colorectal Tumour Front Using Deep Learning | Nearchou I, Ueno H, Kajiwara Y, Lillard K, Mochizuki S, Takeuchi K, Harrison D, Caie P | 2021 | Cancers | Oncology | HALO, HALO AI | |
| Influence of tumor-infiltrating immune cells on local control rate, distant metastasis, and survival in patients with soft tissue sarcoma | Smolle MA, Herbsthofer L, Goda M, Granegger B, Brcic I, Bergovec M, Scheipl S, Prietl B, El-Heliebi A, Pichler M, Gerger A, Posch F, Tomberger M, López-García P, Feichtinger J, Baumgartner C, Leithner A, Liegl-Atzwanger B, Szkandera J | 2021 | OncoImmunology | Immuno-oncology | Highplex FL | HALO |
| Prognostic image-based quantification of CD8CD103 T cell subsets in high-grade serous ovarian cancer patients | Paijens S, Vledder A, Loiero D, Duiker E, Bart J, Hendriks A, Jalving M, Workel H, Hollema H, Werner N, Plat A, Wisman G, Yigit R, Arts H, Kruse A, de Lange N, Koelzer V, Bruyn M, Nijman H | 2021 | OncoImmunology | Immuno-oncology | TMA | HALO, HALO AI |
| Addition of camrelizumab to docetaxel, cisplatin, and radiation therapy in patients with locally advanced esophageal squamous cell carcinoma: a phase 1b study | Zhang W, Yan C, Zhang T, Chen X, Dong J, Zhao J, Han D, Wang J, Zhao G, Cao F, Zhou D, Jiang H, Tang P, Zhao L, Yuan Z, Wang Q, Wang P, Pang Q | 2021 | Oncoimmunology | Oncology | Highplex FL | HALO |
| Breast adipocyte size associates with ipsilateral invasive breast cancer risk after ductal carcinoma in situ | Almekinders MMM, Schaapveld M, Thijssen B, Visser LL, Bismeijer T, Sanders J, Isnaldi E, Hofland I, Mertz M, Wessels LFA, Broeks A, Hooijberg E, Zwart W, Lips EH, Grand Challenge PRECISION Consortium, Desmedt C, Wesseling J | 2021 | npj Breast Cancer | Oncology | Vacuole | HALO |
| Exploring transcriptional regulators Ref-1 and STAT3 as therapeutic targets in malignant peripheral nerve sheath tumours | Gampala S, Shah F, Zhang C, Rhodes SD, Babb O, Grimard M, Wireman RS, Rad E, Calver B, Bai R-Y, Staedtke V, Hulsey EL, Saadatzadeh MR, Pollok KE, Tong Y, Smith AE, Clapp DW, Tee AR, Kelley MR, Fishel ML | 2021 | British Journal of Cancer | Oncology | Area Quantification, Cytonuclear | HALO |
| T-regulatory cells predict clinical outcome in soft tissue sarcoma patients: a clinico-pathological study | Smolle M, Herbsthofer L, Granegger B, Goda M, Brcic I, Bergovec M, Scheipl S, Prietl B, Pichler M, Gerger A, Rossmann C, Riedl J, Tomberger M, López-García P, El-Heliebi A, Leithner A, Liegl-Atzwanger B, Szkandera J | 2021 | British Journal of Cancer | Oncology | Highplex FL | HALO |
| Establishing standardized immune phenotyping of metastatic melanoma by digital pathology | Sobottka B, Nowak M, Frei A, Haberecker M, Merki S, Tumor Profiler consortium, Levesque M, Dummer R, Moch H, Koelzer V | 2021 | Laboratory Investigation | Immuno-oncology | Multiplex IHC, Spatial Analysis | HALO, HALO AI |
| Intratumoral Heterogeneity and Immune Response Indicators to Predict Overall Survival in a Retrospective Study of HER2-Borderline (IHC 2+) Breast Cancer Patients | Radziuviene G, Rasmusson A, Augulis R, Grineviciute R, Zilenaite D, Laurinaviciene A, Ostapenko V, Laurinavicius A | 2021 | Frontiers in Oncology | Immuno-oncology | Membrane, Multiplex IHC | HALO, HALO AI |
| EHF is essential for epidermal and colonic epithelial homeostasis and suppresses Apc-initiated colonic tumorigenesis | Reehorst C, Nightingale R, Luk I, Jenkins L, Koentgen F, Williams D, Darido C, Tan F, Anderton H, Chopin M, Schoffer K, Eissmann M, Buchert M, Mouradov D, Sieber O, Ernst M, Dhillon A, Maridason J | 2021 | Development | Oncology | HALO | |
| Stem cell–derived CAR T cells traffic to HIV reservoirs in macaques | Barber-Axthelm IM, Barber-Axthelm V, Sze KY, Zhen A, Suryawanshi GW, Chen ISY, Zack JA, Kitchen SG, Kiem H-P, Peterson CW | 2021 | JCI Insight | Immunology, Infectious Disease | Area Quantification | HALO |
| Dystrophic microglia are associated with neurodegenerative disease and not healthy aging in the human brain | Shahidehpour RK, Higdon RE, Crawford NG, Neltner JH, Ighodaro ET, Patel E, Price D, Nelson PT, Bachstetter AD | 2021 | Neurobiology of Aging | Neuroscience | Area Quantification | HALO |
| Locally confined IFNɣ production by CD4+ T cells provides niches for murine cytomegalovirus 4 replication in the salivary gland | Oderbolz J, Zangger N, Zimmerman L, Sandu I, Starruß J, Graw F, Oxenius A | 2021 | bioRxiv | Infectious Disease | Classifier, Spatial Analysis, Highplex FL | HALO |
| CD30+OX40+ Treg is associated with improved overall survival in colorectal cancer | Lam JH, Hong M, Koo S-L, Chua CWL, Lim KL, Wee F, Wan WK, Leow WQ, Yeo JG, Tan IBH, Yeong J, Lim TKH, Lim TS | 2021 | Cancer Immunology, Immunotherapy | Immuno-oncology | Highplex FL | HALO |
| COM902, a novel therapeutic antibody targeting TIGIT augments anti-tumor T cell function in combination with PVRIG or PD-1 pathway blockade | Kyle Hansen K, Sandeep Kumar, Kathryn Logronio, Sarah Whelan, Samir Qurashi, Hsin-Yuan Cheng, Andrew Drake, Margaret Tang, Patrick Wall, David Bernados, Ling Leung, Eran Ophir, Zoya Alteber Z, Gady Cojocaru G, Moran Galperin M, Masha Frenkel M, Mark White M, John Hunter J, Spencer C. Liang & Maya F. Kotturi | 2021 | Cancer Immunology, Immunotherapy | Immuno-oncology | HALO | |
| Highly Fermentable Fiber Alters Fecal Microbiota and Mitigates Swine Dysentery Induced by Brachyspira hyodysenteriae | Helm ET, Gabler NK, Burrough ER | 2021 | Animals | Infectious Disease | Cytonuclear | HALO |
| Inhibition of STAT3 augments antitumor efficacy of anti-CTLA-4 treatment against prostate cancer | Witt K, Evans-Axelsson S, Lundqvist A, Johansson M, Bjartell A, Hellsten R | 2021 | Cancer Immunology, Immunotherapy | Immuno-oncology | Area Quantification, Multiplex IHC | HALO |
| Tumor morphology and location associate with immune cell composition in pleomorphic sarcoma | Wustrack RL, Shao E, Sheridan J, Zimel M, Cho S-J, Horvai AE, Luong D, Kwek SS, Fong L, Okimoto RA | 2021 | Cancer Immunology, Immunotherapy | Immuno-oncology | Cytonuclear | HALO |
| Amylin deposition activates HIF1α and 6-phosphofructo-2-kinase/fructose-2, 6-biphosphatase 3 (PFKFB3) signaling in failing hearts of non-human primates | Liu M, Li N, Qu C, Gao Y, Wu L, Hu LG | 2021 | Communications Biology | Metabolism | Area Quantification, Cytonuclear | HALO |
| The effect of cyfluthrin on testis inhibin B in rats and the intervention of Lycium barbarum polysaccharide | Guo X, Xie Y-X, Guo C, Wei J-L, Yang H-F | 2021 | Molecular & Cellular Toxicology | Toxicology | Multiplex IHC | HALO |
| Single-cell analysis shows that adipose tissue of persons with both HIV and diabetes is enriched for clonal, cytotoxic, and CMV-specific CD4+ T cells | Wanjalla CN, McDonnell WY, Ram R, Chopra A, Gangula R, Leary S, Mashayekhi M, Simmons JD, Warren CM, Bailin S, Gabriel CL, Cuo L, Furch BD, Lima MC, Woodward BO, Hannah L, Pilkinton MA, Fuller DT, Kawai K, Virmani R, Finn AV, Hasty AH, Mallal SA, Kalams SA, Koethe JR | 2021 | Cell Reports Medicine | Immunology, Metabolism | Multiplex IHC | HALO |
| Frontotemporal lobar degeneration proteinopathies have disparate microscopic patterns of white and grey matter pathology | Giannini LAA, Peterson C, Ohm D, Xie SX, McMillan CT, Raskovsky K, Massimo L, Suh E, Van Deerlin VM, Wolk DA, Trojanowski JQ, Lee EB, Grossman M, Irwin DJ | 2021 | Acta Neuropathologica Communications | Neuroscience | Area Quantification | HALO |
| Anti-tumor effects of RTX-240: an engineered red blood cell expressing 4-1BB ligand and interleukin-15 | McArdel S, Dugast A, Hoover M, Bollampalli A, Hong E, Castano Z Leonard S, Pawar S, Mellen J, Muriuki K, McLaughlin D, Bayhi N, Carpenter C, Turka L, Wickham T, Elloul S | 2021 | Cancer Immunology, Immunotherapy | Immuno-oncology | Highplex FL | HALO |
| CRISPR-Cas9 gene editing of hepatitis B virusin chronically infected humanized mice | Stone D, Long KR, Loprieno MA, De Silva Feelixge HS, Kenkel EJ, Liley, RM, Rapp S, Roychoudhury P, Nguyen T, Stensland L, Cólon-Thillet R, Klouser LM, Weber ND, Le C, Wagoner J, Goecker EA, Li AZ, Eichholz K, Corey L, Tyrrell DL, Greninger AL, Huang ML, Polyak SJ, Aubert M, Sagartz JE, Jerome KR | 2021 | Molecular Therapy Methods & Clinical Development | Infectious Disease | HALO Link | |
| Monomeric/dimeric forms of Fgf15/FGF19 show differential activity in hepatocyte proliferation and metabolic function | Williams CM, Calderon JH, Hock E, Jimenez Y, Barringer K, Carbonaro M, Molina-Portela MP, Thurston G, Li Z, Daly C | 2021 | The FASEB Journal | Metabolism, Gastroenterology | Cytonuclear | HALO, HALO Link |
| Phenotypic characterization of Adig null mice suggests roles for adipogenin in the regulation of fat mass accrual and leptin secretion | Alvarez-Guaita A, Patel S, Lim K, Haider A, Dong L, Conway OJ, Ma MKL, Chiarugi D, Saudek V, O'Rahilly S, Savage DB | 2021 | Cell Reports | Metabolism | Vacuole | HALO |
| Prognostic role of proliferating CD8+ cytotoxic Tcells in human cancers | Blessin NC, Li W, Mandelkow T, Jansen HL, Yang C, Raedler JB, Simon R, Büscheck F, Dum D, Luebke AM, Hinsch A, Möller K, Menz A, Bernreuther C, Lebok P, Clauditz T, Sauter G, Marx A, Uhlig R, Wilczak W, Minner S, Krech T, Fraune C, Höflmayer D, Burandt E, Steurer S | 2021 | Cellular Oncology | Immuno-oncology | Highplex FL, TMA | HALO |
| An extended release GLP-1 analogue increases α-synuclein accumulation in a mouse model of prodromal Parkinson's disease | Bergkvist L, Johnson ME, Mercado G, Steiner JA, Meyerdick L, Schulz E, Madaj Z, Ma J, Becker K, Li Y, Brudin P | 2021 | Experimental Neurology | Neuroscience | Area Quantification | HALO |
| Activation of the renal GLP‐1R leads to expression of Ren1 in the renal vascular tree | Bjørnholm KD, Ougaard ME, Skovsted GF, Knudsen LB, Pyke C | 2021 | Endocrinology, Diabetes, & Metabolism | Metabolism | ISH/FISH | HALO |
| Comprehensive clinicopathologic study of alpha fetoprotein-expression in a large cohort of patients with hepatocellular carcinoma | Ridder D, Weinmann A, Schindeldecker M, Urbansky L, Berndt K, Gerber T, Lang H, Lotz J, Lackner K, Roth W, Straub B | 2021 | International Journal of Cancer | Oncology | Cytonuclear, TMA | HALO |
| Crotonaldehyde exposure induces liver dysfunction and mitochondrial energy metabolism disorder in rats | Zhang S, Zhang B, Zhang Q, Zhang Z | 2021 | Toxicology Mechanisms and Methods | Metabolism | HALO | |
| Empagliflozin Disrupts a Tnfrsf12a-Mediated Feed Forward Loop That Promotes Left Ventricular Hypertrophy | Yerra VG, Batchu SN, Kabir G, Advani SL, Liu Y, Siddiqi FS, Connelly KA, Advani A | 2021 | Cardiovascular Drugs and Therapy | Myology | HALO | |
| VGLUT2 is a determinant of dopamine neuron resilience in a rotenone model of dopamine neurodegeneration | Buck SA, De Miranda BR, Logan RW, Fish KN, Greenamyre JT, Freyberg Z | 2021 | The Journal of Neuroscience | Neuroscience | ISH/FISH | HALO |
| A Method to Pre-Screen Rat Mammary Gland Whole-Mounts Prior To RNAscope | Duderstadt EL, Sanders MA, Samuelson DJ | 2021 | Journal of Mammary Gland Biology and Neoplasia | Other | ISH/FISH | HALO |
| Conventional and semi-automatic histopathological analysis of tumor cell content for multigene sequencing of lung adenocarcinoma | Kazdal D, Rempel E, Oliveira C, Allgäuer M, Harms A, Singer K, Kohlwes E, Ormanns S, Fink L, Kriegsmann J, Leichsenring M, Kriegsmann K, Stögbauer F, Tavernar L, Leichsenring J, Volckmar A-L, Longuespée R, Winter H, Eichhorn M, Heußel CP, Herth F, Christopoulos P, Reck M, Muley T, Weichert W, Budczies J, Thomas M, Peters S, Warth A, Schirmacher P, Stenzinger A, Kriegsmann M | 2021 | Translational Lung Cancer Research | Oncology | Classifier, Cytonuclear | HALO |
| A feasibility study of combined epigenetic and vaccine therapy in advanced colorectal cancer with pharmacodynamic endpoint | Bever KM, Thomas DL, Zhang J, Rivera EAD, Rosner GL, Zhu Q, Nauroth JM, Christmas B, Thompson ED, Anders RA, Judkins C, Liu M, Jaffee EM, Ahuja N, Zheng L, Azad NS | 2021 | Clinical Epigenetics | Oncology | Immune, Membrane | HALO |
| Global Neurotoxicity: Quantitative Analysis of Rat Brain Toxicity Following Exposure to Trimethyltin | Srivastava A, Liachenko S, Sarkar S, Paule M, Sadovova N, Hanig JP | 2021 | International Journal of Toxicology | Toxicology | HALO | |
| First in class dual MDM2/MDMX inhibitor ALRN-6924 enhances antitumor efficacy of chemotherapy in TP53 wild-type hormone receptor-positive breast cancer models | Pairawan S, Zhao M, Yuca E, Annis A, Evans K, Sutton D, Carvajal L, Ren J-G, Santiago S, Guerlavais, Akcakanat A, Tapia C, Yang F, Bose PSC, Zheng X, Dumbrava EI, Aivado M, Meric-Bernstam F | 2021 | Breast Cancer Research | Oncology | Cytonuclear | HALO |
| In vivo endothelialization and neointimal hyperplasia assessment after rabbit carotid endarterectomy with bovine pericardium | Chen Y, Feng Y, Wang T, Zhang X, Zhang M, Bai X, Li L, Yang K, Ma Y, Zhang Z, Jiao L | 2021 | Annals of Translational Medicine | Myology | Cytonuclear | HALO |
| TNFα secreted by glioma associated macrophages promotes endothelial activation and resistance against anti-angiogenic therapy | Wei Z, Singh O, Ekinci C, Gill J, Li M, Mamatjan Y, Karimi S, Bunda S, Mansouri S, Aldape K, Zadeh G | 2021 | Acta Neuropathologica Communications | Immunology, Neuroscience | Classifier, Multiplex IHC | HALO |
| Analysis of genomic and non-genomic signaling of estrogen receptor in PDX models of breast cancer treated with a combination of the PI3K inhibitor alpelisib (BYL719) and fulvestrant | Jacquemetton J, Kassem L, Poulard C, Dahmani A, De Plater L, Montaudon E, Sourd L, Morisset L, El Botty R, Chateau-Joubert S, Vacher S, Bièche I, Treilleux I, Trédan O, Marangoni E, Le Romancer M | 2021 | Breast Cancer Research | Oncology | Multiplex IHC | HALO |
| Intraoperative fluorescence imaging with aminolevulinic acid detects grossly occult breast cancer: a phase II randomized controlled trial | Ottolino-Perry K, Shahid A, DeLuca S, Son V, Sukhram M, Meng F, Liu Z, Rapic S, Anantha N, Wang S, Chamma E, Gibson C, Medeiros P, Majeed S, Chu A, Wignall O, Pizzolato A, Rosen C, Teene L, Starr-Dunham D, Kulbatski I, Panzarella T, Done S, Easson A, Leong W, DaCosta R | 2021 | Breast Cancer Research | Oncology | Classifier, Area Quantification | HALO |
| Large-Section Histopathology Can Better Indicate the Immune Microenvironment and Predict the Prognosis of Pancreatic Ductal Adenocarcinoma Than Small-Section Histopathology | Ding G, Guo M, Yang Y, Sun C, Wu S, Liu X, Wang J, Jiang H, Liu Y, Zheng J | 2021 | Frontiers in Oncology | Oncology | Multiplex IHC | HALO |
| Mechanism of Nucleic Acid Sensing in Retinal Pigment Epithelium (RPE): RIG-I Mediates Type I Interferon Response in Human RPE | Schustak J, Twarog M, Wu X, Huang Q, Bao Y | 2021 | Journal of Immunology Research | Immunology | Area Quantification, ISH/FISH | HALO |
| Mitigation of endemic GI-tract pathogen-mediated inflammation through development of multimodal treatment regimen and its impact on SIV acquisition in rhesus macaques | Bochart RM, Busman-Sahay K, Bondoc S, Morrow DW, Ortiz AM, Fennessey CM, Fischer MB, Shiel O, Swanson T, Shriver-Munsch CM, Crang HB, Armantrout KM, Barber-Axthelm AM, Langner C, Moats CR, Labriola CS, MacAllister R, Axthelm MK, Brenchley JM, Keele BF, Estes JD, Hansen SG, Smedley JV | 2021 | PLOS Pathogens | Infectious Disease | ISH/FISH, Multiplex IHC | HALO |
| Next-Generation Digital Histopathology of the Tumor Microenvironment | Mungenast F, Fernando A, Nica R, Boghiu B, Lungu B, Batra J, Ecker RC | 2021 | genes | Review | ||
| Functionally distinct POMC-expressing neuron subpopulations in hypothalamus revealed by intersectional targeting | Biglari N, Gaziano I, Schumacher J, Radermacher J, Paeger L, Klemm P, Chen W, Corneliussen S, Wunderlich CM, Sue M, Vollmar S, Klöckener T, Sotelo-Hitschfeld T, Abbasloo A, Edenhofer F, Reimann F, Gribble FM, Fenselau H, Kloppenburg P, Wunderlich FT, Brüning JC | 2021 | Nature Neuroscience | Neuroscience | ISH/FISH | HALO |
| Conditional deletion of mTOR discloses its essential role in early B-cell development | Zhang S, Dubois W, Feng X, Nguyen J, Young N, Mock B | 2021 | Molecular Carcinogenesis | Oncology, Immunology | HALO, HALO Link | |
| Acute inflammatory profiles differ with sex and age after spinal cord injury | Stewart AN, Lowe JL, Glaser EP, Mott CA, Shahidehpour RK, McFarlane KE, Bailey WM, Zhang B, Gensel JC | 2021 | Journal of Neuroinflammation | Immunology, Neuroscience | HALO | |
| AP-3–dependent targeting of flippase ATP8A1 to lamellar bodies suppresses activation of YAP in alveolar epithelial type 2 cells | Kook S, Wang P, Meng S, Jetter CS, Sucre JMS, Benjamin JT, Gokey JJ, Hanby HA, Jaume A, Goetzl L, Marks MS, Guttentag SH | 2021 | Proceedings of the National Academy of Sciences | Fibrosis | HALO | |
| Cellular Senescence in Human Aldosterone-Producing Adrenocortical Cells and Related Disorders | Pieroni J, Yamazaki Y, Gao X, Tezuka Y, Ogata H, Omata K, Ono Y, Morimoto R, Nakamura Y, Satoh F, Sasano H | 2021 | Biomedicines | Metabolism | Cytonuclear | HALO |
| SeqStain is an efficient method for multiplexed, spatialomic profiling of human and murine tissues | Rajagopalan A, Venkatesh I, Aslam R, Kirchenbuechler D, Khanna S, Cimbaluk D, Kordower JH, Gupta V | 2021 | Cell Reports Methods | Other | Spatial Analysis, Highplex FL, Registration | HALO |
| Novel insulin sensitizer MSDC-0602K improves insulinemia and fatty liver disease in mice, alone and in combination with liraglutide | Kamm DR, Pyles KD, Sharpe MC, Healy LN, Colca JR, McCommis KS | 2021 | Journal of Biological Chemistry | Metabolism | HALO | |
| Pancreatic β cell–selective zinc transporter 8 insufficiency accelerates diabetes associated with islet amyloidosis | Xu J, Wijesekara N, Regeenes R, Al Rijjal D, Piro AL, Song Y, Anne Wu A, Bhattacharjee A, Liu Y, Marzban L, Rocheleau JV, Fraser PE, Dai FF, Hu C, Wheeler MB | 2021 | JCI Insight | Metabolism | HALO | |
| Approaches for Handling Immunopathological and Clinical Data Using Deep Learning Methodology: Multiplex IHC/IF Data as a Paradigm | Goh S, Chua Y, Lee J, Yeong J, Cai Y | 2021 | Histopathology and Liquid Biopsy | Review | HALO | |
| Human Type II Taste Cells Express ACE2 and are Infected by SARS-CoV-2 | Doyle M, Ashley Appleton A, Q Liu, Yao Q, Mazucanti C, Egan J | 2021 | American Journal of Pathology | Infectious Disease | Cytonuclear | HALO |
| Dysregulation of Innate Lymphoid Cells in Patients with Active Rheumatoid Arthritis and Mice with Collagen-Induced Arthritis | Yang F, Luo X, Zhu W, Li J, Zheng Z, Zhu P | 2021 | Mediators of Inflammation | Immunology | Spatial Analysis, Highplex FL | HALO |
| Pathological Change and Whole Transcriptome Alternation Caused by ePTFE Implantation in Myocardium | Shan Y, Zhang W, Chen G, Shi Q, Mi Y, Zhang H, Jia B | 2021 | BioMed Research International | Fibrosis | Area Quantification | HALO |
| Q134R: Small chemical compound with NFAT inhibitory properties improves behavioral performance and synapse function in mouse models of amyloid pathology | Sompol P, Gollihue J, Kraner S, Artiushin I, Cloyd R, Chishti E, Koren S, Nation G, Abisambra J, Huzian O, Nagy L, Santha M, Hackler L, Puskas L, Norris C | 2021 | Aging Cell | Neuroscience | Area Quantification | HALO |
| Methods to Determine and Analyze the Cellular Spatial Distribution Extracted From Multiplex Immunofluorescence Data to Understand the Tumor Microenvironment | Parra E | 2021 | Frontiers in Molecular Biosciences | Review | HALO | |
| Lawsonia intracellularis infected enterocytes lack sucrase-isomaltase which contributes to reduced pig digestive capacity | Helm E, Burrough E, Leite, F, Gabler, N | 2021 | Veterinary Research | Other | ISH/FISH | HALO |
| Wound healing with topical BRAF inhibitor therapy in a diabetic model suggests tissue regenerative effects | Escuin-Ordinas H, Liu Y, Hufo W, Dimatteo R, Huang R, Krystofinski P, Azhdam A, Lee J, Comin-Anduix B, Cochran A, Lo R, Segura T, Scumpia P, Ribas A | 2021 | PLOS One | Dermatology | Object Colocalization, Multiplex IHC | HALO |
| The Goto Kakizaki rat: Impact of age upon changes in cardiac and renal structure, function | Meagher P, Civitarese R, Lee X, Gordon M, Bugyei-Twum A, Desjardins J, Kabir G, Zhang Y, Kosanam H, Visram A, Leong-Poi H, Advani A, Connelly K | 2021 | PLOS One | Myology | Muscle Fiber | HALO |
| Extensive Three-Dimensional Intratumor Proteomic Heterogeneity Revealed by Multiregion Sampling in High-Grade Serous Ovarian Tumor Specimens | Hunt A, Bateman N, Barakat W, Makohon-Moore S, Hood B, Conrads K, Zhou M, Calvert V, Pierobon M, Loffredo J, Litzi T, Oliver J, Mitchell D, Gist G, Rojas C, Blanton B, Robinson E, Odunsi K, Sood A, Casablanca Y, Darcy K, Schriver C, Petricoin E, Rao U, Maxwell G, Conrads T | 2021 | iScience | Oncology | Multiplex IHC | HALO |
| Tracing Lung Cancer Risk Factors Through Mutational Signatures in Never-Smokers | Landi MT, Synnott NC, Rosenbaum J, Zhang T, Zhu B, Shi J, Zhao W, Kebede M, Sang J, Choi J, Mendoza L, Pacheco M, Hicks B, Caporaso NE, Abubakar M, Gordenin DA, Wedge, Alexandrov LB, Rothman N, Lan Q, Garcia-Closas M, Chanock SJ | 2021 | American Journal of Epidemiology | Oncology | HALO | |
| Genetic Inactivation of Peroxiredoxin-I Impairs the Growth of Human Pancreatic Cancer Cells | Dahou H, Minati M-A, Jacquemin P, Assi M | 2021 | antioxidants | Oncology | Cytonuclear | HALO |
| Spatial mapping of protein composition and tissue organization: a primer for multiplexed antibody-based imaging | Hickey J, Neumann E, Radtke A, Camarillo J, Beuschel R, Albanese A, McDonough E, Hatler J, Wiblin A, Fisher J, Croteau J, Small E, Sood A, Caprioli R, Angelo R Nolan G, Chung K, Hewitt S, Germain R, Spraggins J, Lundberg E, Snyder M, Kelleher N, Saka S | 2021 | arxiv | Review | HALO | |
| Chemokine-Capturing Wound Contact Layer Rescues Dermal Healing | Schirmer L, Atallah P, Freudenberg U, Werner C | 2021 | Advanced Science | Dermatology | Highplex FL | HALO |
| White adipose tissue autophagy and adipose-liver crosstalk exacerbate nonalcoholic fatty liver disease in mice | Sakane S, Hikita H, Shirai K, Myojin Y, Sasaki Y, Kudo S, Fukumoto K, Mizutani N, Tahata Y, Makino Y, Yamada R, Kodama T, Sakamori R, Tatsumi T, Takehara T | 2021 | Cellular and Molecular Gasteroenterology and Hepatology | Metabolism | Area Quantification | HALO |
| A single-dose mRNA vaccine provides a long-term protection for hACE2 transgenic mice from SARS CoV-2 | Huang Q, Ji K, Tian S, Wang F, Huang B, Tong Z, Tan S, Hao J, Wang Q, Tan W, Gao G, Yan J | 2021 | Nature Communications | Infectious Disease | Multiplex IHC | HALO |
| Histological Studies of the Ventricular–Subventricular Zone as Neural Stem Cell and Glioma Stem Cell Niche | Brockman A, Mobley B, Rebecca I | 2021 | Journal of Histochemistry & Cytochemistry | Review | HALO | |
| The deletion of yeaJ gene facilitates Escherichia coli escape from immune recognition | Wang X, Lin X, Wan Z, Wang S, Zuo J, Wang Z, Xu Y, Han X, Miao J | 2021 | Journal of Bacteriology | Infectious Disease | Area Quantification | HALO |
| Advanced glycation end-products (AGEs) are lower in prostate tumor tissue and inversely related to proportion of West African ancestry | Zenner M, Helou Y, Deaton R, Sverdlov M, Wang H, Kajdacsy-Balla A, Macias V, Voisine C, Murray M, Abdulkardir S, Murphy A, Nonn L | 2021 | The Prostate | Oncology | Classifier, Area Quantification | HALO |
| Digital pathology in academia: Implementation and impact | Jones-Hall Y | 2021 | Lab Animal | Review | HALO | |
| Allostatic hypermetabolic response in PGC1α/β heterozygote mouse despite mitochondrial defects | Rodriguez-Cuenca S, Lelliot C, Campbell M, Peddinti G, Martinuez-Uña M, Ingvorsen C, Dias A, Relat J, Mora S, Hyötyläinen T, Zorzano A, Orešič M, Bjursell M, Bohlooly-Y M, Lindén D, Vidal-Puid A | 2021 | The FASEB Journal | Metabolism | Vacuole | HALO |
| Digital Immunophenotyping Predicts Disease Free and Overall Survival in Early Stage Melanoma Patients | De Logu F, Galli F, Nassini R, Ugolini F, Simi S, Cossa M, Miracco C, Gianatti A, De Giorgi V, Rulli E, Cossu A, Massi D, Mandalà M | 2021 | Cells | Oncology, Immuno-oncology | Multiplex IHC | HALO, HALO Link |
| Constrictive and Hypertrophic Strictures in Ileal Crohn’s Disease | Liu Q, Zhang X, Ko H, Stocker D, Ellman J, Chen J, Hao Y, Bhardwaj S, Liang Y, Cho J, Colombel J, Taouli B, Harpaz N | 2021 | Clinical Gastroenterology and Hepatology | Gastroenterology | HALO | |
| The TRPA1 Channel Amplifies the Oxidative Stress Signal in Melanoma | De Logu F, Monteiro de Araujo D, Ugolini F, Iannone L, Vannucchi M, Portelli F, Landini L, Titiz M, De Giorgi V, Geppetti P, Massi D, Nassini R | 2021 | Cells | Oncology | Area Quantification, Multiplex IHC | HALO, HALO AI, HALO Link |
| Lipid Source and Peroxidation Status Alter Immune Cell Recruitment in Broiler Chicken Ileum | Fries-Craft KA, Meyer MM, Lindblom SC, Kerr BJ, Bobeck EA | 2021 | The Journal of Nutrition | Immunology | ISH/FISH | HALO |
| Multimodal treatment combining cold atmospheric plasma and acidic fibroblast growth factor for multi‐tissue regeneration | Tan F, Rui X, Xiang X, Yu Z, Al-Rubeai M | 2021 | The FASEB Journal | Other | Multiplex IHC | HALO |
| Promyelocytic leukemia protein promotes the phenotypic switch of smooth muscle cells in atherosclerotic plaques of human coronary arteries | Karle W, Becker S, Stenzel P, Knosalla C, Siegel G, Baum O, Zakrzewicz A, Berkholz J | 2021 | Clinical Science | Myology | Area Quantification, Object Colocalization | HALO |
| Dynamic Hydrogels for Prevention of Post‐Operative Peritoneal Adhesions | Stapleton LM, Lucian HJ, Grosskopf AK, Smith AAA, Totherow KP, Woo YJ, Appel EA | 2021 | Advanced Therapeutics | Biomaterials | Area Quantification | HALO |
| Prognostic features of the tumour microenvironment in oesophageal adenocarcinoma | McShane R, Arya S, Stewart A, Caie P, Bates M | 2021 | Biochimica et Biophysica Acta (BBA) - Reviews on Cancer | Immuno-oncology, Review | Cytonuclear | HALO |
| Kaiso (ZBTB33) subcellular partitioning functionally links LC3A/B, the tumor microenvironment, and breast cancer survival | Singhal SK, Byun JS, Park S, Yan T, Yancey R, Caban A, Hernandez SG, Hewitt SM, Boisvert H, Hennek S, Bobrow M, Ahmed SU, White J, Yates C, Aukerman A, Vanguri R, Bareja R, Lenci R, Farré PL, De Siervi A, Nápoles AM, Vohra N, Gardner K | 2021 | Communications Biology | Oncology | Cytonuclear, TMA | HALO |
| Immune checkpoint blockade in triple negative breast cancer influenced by B cells through myeloid-derived suppressor cells | Vito A, Salem O, El-Sayes N, MacFawn I, Portillo A, Milne K, Harrington D, Ashkar A, Wan Y, Workenhe S, Nelson B, Bruno T, Mossman K | 2021 | Communications Biology | Immuno-oncology | Cytonuclear | HALO |
| A locus coeruleus to dentate gyrus noradrenergic circuit modulates aversive contextual processing | Seo D, Zhang E, Piantadosi S, et al | 2021 | Neuron | Neuroscience | HALO | |
| AST-120 Treatment Alters the Gut Microbiota Composition and Suppresses Hepatic Triglyceride Levels in Obese Mice | Hiraga Y, Kubota T, Katoh, M, et al. | 2021 | Endocrine Research | Metabolism | Vacuole | HALO |
| Isoform specific anti-TGFβ therapy enhances antitumor efficacy in mouse models of cancer | Gupta A, Budhu S, Fitzgerald K, Giese R, Michel A, Holland A, Campesato L, vanSnick J, Uyttenhove C, Ritter G, Wolchok J, Merghoub T | 2021 | Communications Biology | Oncology | Area Quantification | HALO |
| Chronic stress differentially alters mRNA expression of opioid peptides and receptors in the dorsal hippocampus of female and male rats | Johnson MA, Contoreggi NH, Kogan JF, Bryson M, Rubin BR, Gray JD, Kreek MJ, McEwen BS, Milner TA | 2021 | The Journal of Comparative Neurology | Neuroscience | ISH/FISH | HALO |
| Monocyte and macrophage derived myofibroblasts: Is it fate? A review of the current evidence | Vierhout M, Ayoub A, Naiel S, Yazdanshenas P, Revill S, Reihani A, Dvorkin-Gheva A, Shi W, Ask K | 2021 | Wound Repair and Regeneration | Review | ISH/FISH | HALO |
| Necroptosis in biliary atresia of the liver | Hashimoto M, Fujishima F, Lomphithak T, Jitkaew S, Nio M, Sasano H | 2021 | Medical Molecular Morphology | Metabolism | Multiplex IHC | HALO |
| Intracranial administration of alpha-synuclein fibrils in A30P-synuclein transgenic mice causes robust synucleinopathy and microglial induction | Gentzel R, Toolan D, Jinn S, Schachter J, Ma L, Kahle P, Smith S, Marcus J | 2021 | Neurobiology of Aging | Neuroscience | Area Quantification | HALO |
| A comparative study of cirrhosis sub-staging using the Laennec system, Beijing classification, and morphometry | Zhang X, Schiano T, Doyle E, Branch A, Florman S, Fiel M. | 2021 | Modern Pathology | Metabolism | Classifier, Area Quantification | HALO |
| Potential role of M2 TAMs around lymphatic vessels during lymphatic invasion in papillary thyroid carcinoma | Kabasawa T, Ohe R, Aung NY, Urano Y, Kitaoka T, Tamazawa N, Utsunomiya A, Yamakawa M | 2021 | Scientific Reports | Oncology | Area Quantification | HALO |
| Mucosal IFNγ production and potential role in protection in Escherichia coli O157:H7 vaccinated and challenged cattle | Schaut RG, Palmer MV, Boggiatto PM, Kudva IT, Loving CL, Sharma VK | 2021 | Scientific Reports | Immunology | ISH/FISH | HALO |
| Orexin receptors 1 and 2 in serotonergic neurons differentially regulate peripheral glucose metabolism in obesity | Xiao X Yeghiazaryan G, Hess S, Klemm P, Sieben A, Kleinridders A, Morgan D, Wunderlich F. Rahmouni K. Kong D, Scammell T, Lowell B, Kloppenburg P, Brüning J, Hausen A. | 2021 | Nature Communications | Metabolism | ISH/FISH | HALO |
| Tumor necroptosis is correlated with a favorable immune cell signature and programmed death-ligand 1 expression in cholangiocarcinoma | Lomphithak T, Akara-amornthum P, Murakami K, et al. | 2021 | Scientific Reports | Immuno-oncology | Highplex FL | HALO |
| Development of a novel humanized mouse model for improved evaluation of in vivo anti-cancer effects of anti-PD-1 antibody | Katano I, Hanazawa A, Otsuka I, Yamaguchi T, Mochizuki M, Kawai K, Ito R, Goto M, Kagawa T, Takahashi T | 2021 | Scientific Reports | Oncology | HALO | |
| AG-205 Upregulates Enzymes Involved in Cholesterol Biosynthesis and Steroidogenesis in Human Endometrial Cells Independently of PGRMC1 and Related MAPR Proteins | Thieffry C, Van Wynendaele M, Aynaci A, Maja M, Dupuis C, Loriot A, Marbaix E, Henriet P | 2021 | Biomolecules | Other | HALO | |
| p53-mediated redox control promotes liver regeneration and maintains liver function in response to CCl4 | Humpton T, Hall H, Kiourtis C, Nixon C, Clark W, Hedley A, Shaw R, Bird T, Blyth K, Vousden K | 2021 | Cell Death & Differentiation | Metabolism | HALO | |
| Single-cell RNA transcriptome landscape of hepatocytes and non-parenchymal cells in healthy and NAFLD mouse liver | Su Q, Kim S, Adewale F, Zhou Y, Alder C, Ni M, Wei Y, Burcznski M, Atwal G, Sleeman M, Murphy A, Xin Y, Cheng X | 2021 | iScience | Metabolism | Area Quantification | HALO |
| Single-cell profiling of tumor-infiltrating TCF1/TCF7+ T cells reveals a T lymphocyte subset associated with tertiary lymphoid structures/organs and a superior prognosis in oral cancer | Peng Y, Xiao L, Rong H, Ou Z, Cai T, Liu N, Li B, Zhang L, Wu F, Lan T, Lin X, Li Q, Ren S, Fan S, Li J | 2021 | Oral Oncology | Oncology | Spatial Analysis, Highplex FL | HALO |
| Functional heterogeneity of POMC neurons relies on mTORC1 signaling | Saucisse N, Mazier W, Simon V, Binder E, Catania C, Bellocchio L, Romanov R, Leon S, Matias I, Zizzari P, Quarta C, Cannich A, Meece K, Gonzales D, Clark S, Becker J, Yeo G, Fioramonti X, Merkle F, Wardlaw S, Harkany T, Massa F, Marsicano G, Cota D | 2021 | Cell Reports | Neuroscience | ISH/FISH | HALO |
| IL-1-driven stromal–neutrophil interactions define a subset of patients with inflammatory bowel disease that does not respond to therapies | Friedrich M, Pohin M, Jackson M, Korsunsky I, Bullers S, Rue-Albrecht K, Christoforidou Z, Sathananthan D, Thomas T, Ravindran R, Tandon R, Peres R, Sharpe H, Wei K, Watts G, Mann E, Geremia A, Attar M, Oxford IBD Cohort Investigators, Roche Fibroblast Network Consortium, McCuaig S, Thomas L, Collantes E, Uhlig H, Sansom S, Easton A, Raychaudhuri S, Travis S, Powrie F | 2021 | Nature Medicine | Gastroenterology | Cytonuclear | HALO |
| Increased IL-6 expression precedes reliable viral detection in the rhesus macaque brain during acute SIV infection | Gopalakrishnan R, Aid M, Mercado N, Davis C, Malik S, Geiger E, Varner V, Jones R, Bosinger S, Piedra-Mora C, Martinot A, Barouch D, Reeves R, Tan C | 2021 | JCI Insight | Infectious Disease | Area Quantification | HALO |
| Baricitinib Treatment Resolves Lower-Airway Macrophage Inflammation and Neutrophil Recruitment in Sars-Cov-2-Infected Rhesus Macaques | Hoang T, Pino M, Boddapati A, Viox E, Starke C, Upadhyay A, Gumber S, Nekorchuk M, Busman-Sahay K, Strongin Z, Harper J, Tharp G, Pellegrini K, Kirejczyk S, Zandi K, Tao S, Horton T, Beagle E, Mahar E, Lee M, Cohen J, Jean S, Wood J, Connor-Stroud F, Stammen R, Delmas O, Wang S, Cooney K, Sayegh M, Wang L, Filev P, Weiskopf D, Silvestri G, Waggoner J, Piantadosi A, Kasturi S, Al-Shakhshir H, Ribeiro S, Sekaly R, Levit R, Estes J, Vanderfold T, Schinazi R, Bosinger S, Paiardine M | 2021 | Cell | Infectious Disease | Area Quantification, Multiplex IHC | HALO |
| Interleukin-33 activates group 2 innate lymphoid cell expansion and modulates endometriosis | Miller J, Lingegowda H, Symons L, Bougie O, Young S, Lessey B, Koti M, Tayade C | 2021 | JCI Insight | Other | Area Quantification, Cytonuclear | HALO |
| An endogenous opioid circuit determines state-dependent appetitive behavior | Castro D, Oswell C, Zhang E, Pedersen C, Piantadosi S, Rossi M, Hunker A, Guglin A, Moron J, Zweifel L, Stuber G, Bruchas M | 2021 | bioRxiv | Neuroscience | HALO | |
| CCNE1 amplification is synthetic-lethal with PKMYT1 kinase inhibition | Gallo D, Young J, Fourtounis J, Martino G, Alvarez-Quilon A, Bernier C, Duffy N, Papp R, Roulston A, Stocco R, Szychowski J, Veloso A, Alam H, Baruah P, Fortin A, Bowlan J, Chaudhary N, Desjardins J, Dietrich E, Fournier S, Fugere-Desjardins C, de Rugy T, Leclaire M, Liu B, Melo H, Nicolas O, Singhania A, Szilard R, Tkac J, Yin S, Morris S, Zinda M, Marshall C, Duocher D | 2021 | bioRxiv | Other | HALO | |
| Glucocorticoid receptor antagonism promotes apoptosis in solid tumor cells | Greenstein A, Hunt H | 2021 | Oncotarget | Oncology | Multiplex IHC | HALO |
| Mitochondria exert age-divergent effects on recovery from spinal cord injury | Stewart A, McFarlane K, Vekaria H, Bailey W, Slone S, Tranthem L, Zhang B, Patel S, Sullivan P, Gensel J | 2021 | Experimental Neurology | Neuroscience | Object Colocalization | HALO |
| High CD8+ tumour infiltrating lymphocyte density associates with unfavourable prognosis in oesophageal adenocarcinoma following poor response to neo‐adjuvant chemoradiotherapy | Koemans WJ, van Dieren JM, van den Berg J, Meijer G, Snaebjornsson P, Chalabi M, Lecot F, Riedl R, Krijgsman O, Hofland I, Broeks A, Voncken FEM, Peppelenbosch MP, Sosef MN, van Sandick JW, Kodach LL | 2021 | Histopathology | Immuno-oncology | Cytonuclear | HALO |
| CD147 antibody specifically and effectively inhibits infection and cytokine storm of SARS-CoV-2 and its variants delta, alpha, beta, and gamma | Geng J, Chen L, Yuan Y, Wang K, Wang Y, Qin C, Wu G, Chen R, Zhang Z, Wei D, Du P, Zhang J, Lin P, Zhang K, Deng Y, Xu K, Liu J, Sun X, Guo T, Yang X, Wu J, Jiang J, Li L, Zhang K, Wang Z, Zhang J, Yan Q, Zhu H, Zheng Z, Miao J, Fu X, Yang F, Chen X, Tang H, Zhang Y, Shi Y, Zhu Y, Pei Z, Huo F, Liang X, Wang Y, Wang Q, Xie W, Li Y, Shi M, Bian H, Zhu P, Chen Z | 2021 | Signal Transduction and Targeted Therapy | Infectious Disease | HALO | |
| Suppression of insulin-induced gene 1 (INSIG1) function promotes hepatic lipid remodelling and restrains NASH progression | Azzu V, Vacca M, Kamzolas I, Hall Z, Leslie J, Carobbio S, Virtue S, Davies S, Lukasik A, Dale M, Bohlooly-Y M, Acharjee A, Linden D, Bidault G, Petsalaki E, Griffin J, Oakley F, Allison M, Vidal-Puig | 2021 | Molecular Metabolism | Metabolism | Area Quantification | HALO |
| Maternal platelets pass interstices of trophoblast columns and are not activated by HLA-G in early human pregnancy | Guettler J, Forstner D, Cvirn G, Maninger S, Brugger B Nonn O, Kupper N, Pritz E, Wernitznig S, Dohr G, Hutter H, Juch H, Isermann B, Kohli S, Gauster M | 2021 | Journal of Reproductive Immunology | Other | HALO | |
| Detection of Epstein–Barr Virus in Periodontitis: A Review of Methodological Approaches | Tonoyan L, Chevalier M, Vincent-Bungnas S, Marsault R, Doglio A | 2021 | Mircroorganisms | Review | ISH/FISH, ISH-IHC/FISH-IF | HALO |
| CYRI-A limits invasive migration through macropinosome formation and integrin uptake regulation | Le A, Yelland T, Paul N, Fort L, Nikolaou S, Ismail S, Machesky L | 2021 | Journal of Cell Biology | Other | HALO | |
| B7-1 and programmed cell death-ligand 1 in primary and lymph node metastasis lesions of non-small cell lung carcinoma | Yamada T, Miki Y, Suzuki M, Kondoh O, Saito-Koyama R, Ono K, Okada Y, Sasano H | 2021 | Cancer Medicine | Oncology | HALO | |
| In vitro amplification of pathogenic tau conserves disease-specific bioactive characteristics | Xu H, O'Reilly M, Gibbons G, Changolkar L, McBride J, Riddle D, Zhang B, Stieber A, Nirschl J, Kim S, Hoxha K, Brunden K, Schellenberg G, Trojanowski J, Lee V | 2021 | Acta Neuropathologica | Neuroscience | HALO | |
| A distinct repertoire of cancer-associated fibroblasts is enriched in cribriform prostate cancer | Hesterberg AB, Rios BL, Wolf EM, Tubbs C, Wong HY, Schaffer KR, Lotan TL, Giannico GA, Gordetsky JB, Hurley PJ | 2021 | Journal of Pathology:Clinical Research | Oncology | Classifier, ISH/FISH | HALO |
| Diagnostic and prognostic implications of a three-antibody molecular subtyping algorithm for non-muscle invasive bladder cancer | Jackson C, Chen L, Hardy C, Ren K, Visram K, Bratti V, Johnstone J, Sjödahl G, Siemens D, Gooding R, Berman D | 2021 | The Journal of Pathology: Clinical Research | Oncology | Cytonuclear | HALO |
| Computational modeling of tau pathology spread reveals patterns of regional vulnerability and the impact of a genetic risk factor | Cornblath E, Li H, Changolkar C, Zhang B, Brown H, Gathagan R, Olufemi M, Trojanowski J, Bassett D, Lee V, Henderson M | 2021 | Science Advances | Neuroscience | Area Quantification | HALO |
| Tau-tubulin kinase 1 phosphorylates TDP-43 at disease-relevant sites and exacerbates TDP-43 pathology | Tian Y, Wang Y, Jablonski A, Hu Y, Sugam J, Koglin M, Stachel S, Zhou H, Uslaner J, Parmentier-Batteur S | 2021 | Neurobiology of Disease | Neuroscience | Area Quantification | HALO |
| Randomized Controlled Trial of the Gastrin/CCK2 Receptor Antagonist Netazepide in Patients with Barrett's Esophagus | Abrams J, Del Portillo A, Hills C, Compres G, Friedman R, Cheng B, Poneros J, Lightdale C, Del La Rue R, di Pietro M, Fitzgerald R, Sepulveda A, Wang T | 2021 | Cancer Prevention Research | Oncology | HALO, HALO AI | |
| TMEM229A suppresses non‑small cell lung cancer progression via inactivating the ERK pathway | Zhang X, He Y, Jiang Y, Bao Y, Chen Q, Xie D, Yu H, Wang X | 2021 | Oncology Reports | Oncology | Multiplex IHC | HALO |
| Small molecule inhibitors of α-synuclein oligomers identified by targeting early dopamine-mediated motor impairment in C. elegans | Chen K, Menezes K, Rodgers J, )'Hara D, Tran N, Fujisawa K, Ishikura S, Khodaei S, Chau H, Cranston A, Kapadia M, Pawar G, Ping S, Krizus A, Lacoste A, Spangler S, Visanji N, Marras C, Majbour N, El-Agnaf O, Lozano A, Culotti, Suo S, Ryu W, Kalia S, Kalia L | 2021 | Molecular Neurodegeneration | Neuroscience | Cytonuclear | HALO |
| Immune Response in Myocardial Injury: In Situ Hybridization and Immunohistochemistry Techniques for SARS-CoV-2 Detection in COVID-19 Autopsies | Chong P, Iqbal J, Yeong J, Aw T, Chan K, Chui P | 2021 | Frontiers in Molecular Biosciences | Infectious Disease | HALO | |
| STING regulates peripheral nerve regeneration and colony stimulating factor 1 receptor (CSF1R) processing in microglia | Morozzi G, Rothen J, Toussaint G, De Lange K, Westritschnig K, Doelemeyer A, Ueberschlag V, Kahle P, Lambert C, Obrecht M, Beckmann N, Ritter V, Panesar M, Stauffer D, Garnier I, Mueller M, Guerini D, Keller C, Knehr J, Roma G, Bidinosti M, Brachat S, Morvan F, Forano M | 2021 | iScience | Neuroscience | Cytonuclear | HALO, HALO AI |
| High density of cytotoxic T-lymphocytes is linked to tumoral PD-L1 expression regardless of the mismatch repair status in colorectal cancer | Möller K, Blessin N, Höflmayer D, et al. | 2021 | Acta Oncologica | Immuno-oncology | Highplex FL | HALO |
| Inhibitory effects and mechanisms of the anti-covid-19 traditional Chinese prescription, Keguan-1, on acute lung injury | Bai, Z, Li P, Wen J, Han Y, Cui Y, Zhou Y, Shi Z, Chen S, Li Q, Zhao X, Wang Z, Li R, Guo Y, Zhan X, Xu G, Ding K, Wang J, Xiao X | 2021 | Journal of Ethnopharmacology | Infectious Disease | Highplex FL | HALO |
| Spatial mapping of protein composition and tissue organization: a primer for multiplexed antibody-based imaging | Hickey J, Neumann E, Radtke A, Camarillo J, Beuschel R, Albanese A McDonough E, Hatler J, Wiblin A, Fisher J, Croteau J, Small E, Sood A, Caprioli R, Angelo R. Nolan G, Chung K, Hewitt S, Germain R, Spraggins J, Lundberg E, Snyder M, Kelleher N, Saka S | 2021 | Nature Methods | Review | HALO | |
| Alpha-synuclein from patient Lewy bodies exhibits distinct pathological activity that can be propagated in vitro | Marotta N, Ara J, Uemura N, Lougee M, Meymand E, Zhang B, Petersson E, Trojanowski J, Lee V | 2021 | Acta Neuropathologica Communications | Neuroscience | HALO | |
| Advances in mass cytometry and its applicability to digital pathology in clinical-translational cancer research | Cereceda K, Jorquera R, Villarroel-Espindola, F | 2021 | Advances in Laboratory Medicine | Review | HALO | |
| LRPPRC regulates redox homeostasis via the circANKHD1/FOXM1 axis to enhance bladder urothelial carcinoma tumorigenesis | Wei W, Wang N, Deng M, Dong P, Liu J, Xiang Z, Li X, Li Z, Liu Z, Peng Y, Li Z, Jiang L, Yao K, Ye Y, Lu W, Zhang Z, Zhou F, Liu Z, Xie D, Yu C | 2021 | Redox Biology | Metabolism | HALO | |
| Antiretroviral therapy timing impacts latent tuberculosis infection reactivation in a tuberculosis/simian immunodeficiency virus coinfection model | Sharan R, Ganatra S, Bucsan A, Cole J, Singh D, Alvarez X, Gough M, Alvarez C, Blakley A, Ferdin J, Thippeshappa R, Singh B, Escobedo R, Shivanna V, Dick E, Hall-Ursone S, Khader S, Mehra S, Rengarajan J, Kaushal D | 2021 | The Journal of Clinical Investigation | Infectious Disease | HALO | |
| Effects of Dietary Pork Fat Cooked Using Different Methods on Glucose and Lipid Metabolism, Liver Inflammation and Gut Microbiota in Rats | Zhu W, Xu Y, Liu J, Chen D, Zhang H, Yang Z, Zhou X | 2021 | Foods | Metabolism | Area Quantification | HALO |
| Low immunogenicity of LNP allows repeated administrations of CRISPR-Cas9 mRNA into skeletal muscle in mice | Kenjo E, Hozumi H, Makita Y, Iwabuchi K, Fujimoto N, Matsumoto S, Kimura M, Amano Y, Ifuku M, Naoe Y, Inukai N, Hotta A | 2021 | Nature Communications | Other | Muscle Fiber | HALO |
| Inter-organ transmission of hepatocellular senescence induces multi-organ dysfunction through the TGFβ signalling pathway | Kiourtis C, Terradas-Terradas M, Gee L, Hsieh Y, Nixon C, Clark W, Shaw R, Hanson P, Sumpton D, Mackay G, May S, Muller M, Najumudeen A, Campbell A, Barry S, Morris C, LeBeau F, Sansom O, Kirschner K, Oakley F, Bird T | 2021 | Research Square | Other | HALO | |
| Bone Morphogenetic Protein Pathway Antagonism by Grem1 Regulates Epithelial Cell Fate in Intestinal Regeneration | Koppens MAJ, Davis H, Valbuena GN, Mulholland EJ, Nasreddin N, Colombe M, Antanaviciute A, Biswas S, Friedrich M, Lee L, Oxford IBD cohort investigators, Wang LM, Koelzer VH, East JE, Simmons A, Winton DJ, Leedham SJ | 2021 | Gastroenterology | Gastroenterology | Area Quantification | HALO |
| Pixelwise H-score: a novel digital image analysis-based metric to quantify membrane biomarker expression from immunohistochemistry images | Ram S, Vizcarra P, Whalen P, Deng S, Painter C, Jackson-Fisher A, Pirie-Shepherd S, Xia X, Powell E | 2021 | PLOS One | Other | HALO | |
| Hedgehog-signalling in papillary fibroblasts is essential for hair follicle regeneration during wound healing | Frech S, Forsthuber A, Korosec A, Lipp K, Kozumov V, Lichtenberger B | 2021 | Journal of Investigative Dermatology | Dermatology | HALO | |
| Splenic T lymphocytes induce the formation of immunosuppressive neutrophils through IFN-γ in sepsis | Huang J, Sun R, Yang Y, Li L, Liu L, Shao Y, Ji D, Sun B | 2021 | Inflammation Research | Immunology | Highplex FL | HALO |
| A minimal standardized human bone marrow microphysiological system to assess resident cell behavior during normal and pathological processes | Voeltzel T, Fossard G, Degaud M, Geistlich K, Gadot N, Jeanpierre S, Mikaelian I, Brevet M, Anginot A, Le Bousse-Kerdiles M, Trichet V, Lefort S, Maguer-Satta V | 2021 | Biomaterials Science | Biomaterials | Area Quantification, Cytonuclear | HALO |
| Secretory pathway Ca-ATPase2 (SPCA2) gene knockout results in mouse mammary gland changes and a secretory defect | Reinhardt T, Lippolis J, Palmer M | 2021 | Research Square | Other | HALO | |
| Effect of Electroacupuncture at Siguan Acupoints on Expression of BDNF and TrkB Proteins in the Hippocampus of Post-Stroke Depression Rats | Kang Z, Ye H, Chen T, et al. | 2021 | Journal of Molecular Neuroscience | Neuroscience | HALO | |
| Validation of multiplex immunofluorescence and digital image analysis for programmed death-ligand 1 expression and immune cell assessment in non-small cell lung cancer: comparison with conventional immunohistochemistry | Wu J, Mao L, Sun W, Yang X, Wang H, Liu X, Chi K, Xiaozheng H, Lin D | 2021 | Journal of Clinical Pathology | Immuno-oncology | HALO | |
| Computational pathology reveals unique spatial patterns of immune response in H&E images from COVID-19 autopsies: preliminary findings | Corredor G, Toro P, Bera K, Rasmussen D, Viswanathan V, Buzzy C, Fu P, Barton L, Stroberg E, Duval E, Gilmore H, Mukhopadhyay, Madabhushi A | 2021 | Journal of Medical Imaging | Infectious Disease | HALO Link | |
| Anti-CD47 antibody administration via cisterna magna in proper dosage can reduce perihematomal cell death following intracerebral hemorrhage in rats | Song Y, Wang H, Li F, Huang Q, Zhang Z | 2021 | Brain Research Bulletin | Other | Highplex FL | HALO |
| Specificity and off-target effects of AAV8-TBG viral vectors for the manipulation of hepatocellular gene expression in mice | Kiourtis C, Wilczynska A, Nixon C, Clark W, May S, Bird T | 2021 | Biology Open | Other | Multiplex IHC | HALO |
| spatialTIME and iTIME: R package and Shiny application for visualization and analysis of immunofluorescence data | Creed J, Wilson C, Soupir A, Colin-Leitzinger C, Kimmel G, Ospina O, Chakiryan N, Markowitz J, Peres L, Coghill A, Fridley B | 2021 | Bioinformatics | Other | Classifier | HALO |
| Local radiotherapy and E7 RNA-LPX vaccination show enhanced therapeutic efficacy in preclinical models of HPV16+ cancer | Salomon N, Selmi A, Grunwitz C, Kong A, Stanganello E, Neumaier J, Petschenka J, Diken M, Kreiter S, Tureci O, Sahin U, Vascotto F | 2021 | Cancer Immunology, Immunotherapy | Oncology, Infectious Disease | Highplex FL | HALO |
| Clinically relevant mitochondrial-targeted therapy improves chronic outcomes after traumatic brain injury | Hubbard W, Spry M, Gooch J, Cloud A, Vekaria H, Burden S, Powell D, Berkowitz B, Geldenhuys W, Harris N, Sullivan P | 2021 | Brain | Neuroscience | Area Quantification | HALO |
| The microglial P2Y6 receptor mediates neuronal loss and memory deficits in neurodegeneration | Puigdellivol M, Milde S, Vilalta A, Cockram T, Allendorf D, Lee J, Dundee J, Pampuscenko K, Borutaite V, Nuthall H, Brelstaff J, Spillantini G, Brown G | 2021 | Cell Reports | Neuroscience | HALO | |
| Cross-linking of T cell to B cell lymphoma by the T cell bispecific antibody CD20-TCB induces IFNγ/CXCL10-dependent peripheral T cell recruitment in humanized murine model | Cremasco F, Menietti E, Speziale D, Sam J, Sammicheli S, Richard M, Varol A, Klein C, Umana P, Bacac M, Colombetti S, Perro M | 2021 | PLOS One | Oncology | HALO | |
| Spatial Clustering of CD68+ Tumor Associated Macrophages with Tumor Cells is Associated with Worse Overall Survival in Metastatic Clear Cell Renal Cell Carcinoma | Chakiryan NH, Kimmel GJ, Kim Y, Hajiran A, Aydin AM, Zemp L, Katende E, Nguyen J, Lopez-Blanco N, Chahoud J, Spiess PE, Fournier M, Dhillon J, Wang L, Moran-Segura C, El-Kenawi A, Mulé J, Altrock PM, Manley BJ | 2021 | PLOS ONE | Immuno-oncology | Highplex FL | HALO |
| Sustained Helicobacter pylori infection accelerates gastric dysplasia in a mouse model | O’Brien VP, Koehne AL, Dubrulle J, Rodriguez AE, Leverich CK, Kong VP, Campbell JS, Pierce RH, Goldenring JR, Choi E, Salama NR | 2021 | Life Science Alliance | Immuno-oncology | Highplex FL | HALO |
| Two distinct immunopathological profiles in autopsy lungs of COVID-19 | Nienhold R, Ciani Y, Koelzer V, Tzankov A, Haslbauer J, Menter T, Schwab N, Henkel M, Frank A, Zsikla V, Willi N, Kempf W, Hoyler T, Barbareschi M, Moch H, Tolnay M, Cathomas G, Dernichelis F, Junt T, Mertz K | 2021 | Nature Communications | Infectious Disease | Multiplex IHC | HALO, HALO AI |
| CD8+ T cells fail to limit SIV reactivation following ART withdrawal until after viral amplification | Okoye AA, Duell DD, Fukazawa Y, Varco-Merth B, Marenco A, Behrens H, Chaunzwa TM, Selseth AN, Gilbride RM, Shao J, Edlefsen PT, Geleziunas R, Pinkevych M, Davenport MP, Busman-Sahay K, Nekorchuk MD, Park H, Smedley JV, Axthelm MK, Estes JD, Hansen SG, Keele BF, Lifson JD, Picker LJ | 2021 | The Journal of Clinical Investigation | Immunology, Infectious Disease | ISH/FISH | HALO, HALO AI |
| Myeloid cell-driven nonregenerative pulmonary scarring is conserved in multiple nonhuman primate species regardless of SARS-CoV-2 infection modality | Fears A, Beddingfield B, Chirichella N, Slisarenko N, Kileen S, Redmann R, Goff K, Spencer S, Picou B, Golden N, Bush D, Branco L, Boisen M, Gao H, Montefiori D, Blair R, Doyle-Meyers L, Russel-Lodrigue K, Maness N, Roy C | 2021 | bioRxiv | Infectious Disease | Highplex FL | HALO, HALO AI |
| Structure of the helicase core of Werner helicase, a key target in microsatellite instability cancers | Newman J, Gavard A, Lieb S, Ravichandran M, Hauer K, Werni P, Geist L, Bottcher J, Engen J, Rumpel K, Samwer M, Petronczki, Gileadi O | 2021 | Life Science Alliance | Oncology | HALO | |
| Tau isoforms are differentially expressed across the hippocampus in chronic traumatic encephalopathy and Alzheimer’s disease | Cherry J, Esnault C, Baucom Z, Tripodis Y, Huber B, Alvarez V, Stein T, Dickson D, McKee A | 2021 | Acta Neuropathologica Communications | Neuroscience | HALO, HALO AI | |
| Maternal obesity during pregnancy leads to adipose tissue ER stress in mice via miR-126-mediated reduction in Lunapark | de Almeida-Faria J, Duque-Guimares D, Ong T, Pantaleao L, Carpenter A, Loche E, Kusinki L, Ashmore T, Antrobus R, Bushell M, Fernandez-Twinn, Ozanne S | 2021 | Diabetologia | Metabolism | HALO, HALO AI | |
| Genetically engineered microglia-like cells have therapeutic potential for neurodegenerative 2 disease | Plasschaert R, DeAndrade M, Hull F, Nguyen Q, Peterson T, Yan A, Loperfido M, Baricordi C, Barbarossa L, Yoon J, Dogan Y, Unnisa Z, Schindler J, van Til N, Biasco L, Mason C | 2021 | bioRxiv | Neuroscience | HALO | |
| Ki-67 Proliferation Index Assessment in Gastroenteropancreatic Neuroendocrine Tumors by Digital Image Analysis With Stringent Case and Hotspot Level Concordance Requirements | Boukhar SA, Gosse MD, Bellizzi AM, Rajan A | 2021 | American Journal of Clinical Pathology | Oncology | Cytonuclear | HALO |
| Age-associated expression of p21 and p53 during human wound healing | Chia CW, Sherman-Baust CA, Larson SA, Pandey R, Withers R, Karikkineth AC, Zukley LM, Campisi J, Egan JM, Sen R, Ferrucci L | 2021 | Aging Cell | Dermatology | Area Quantification, ISH/FISH, Multiplex IHC | HALO |
| Mastocytosis-derived extracellular vesicles deliver miR-23a and miR-30a into pre-osteoblasts and prevent osteoblastogenesis and bone formation | Kim D-K, Bandara G, Cho Y-E, Komarow HD, Donahue DR, Karim B, Baek M-C, Kim HM, Metcalfe DD, Olivera A | 2021 | Nature Communications | Other | Classifier | HALO |
| Mismatch repair-deficient prostate cancer with parenchymal brain metastases treated with immune checkpoint blockade | Sena L, Salles D, Engle E, Zhu Q, Tukachinsky H, Lotan T, Antonarakis E | 2021 | Molecular Case Studies | Immuno-oncology | Highplex FL | HALO |
| Predicting nodal metastases in papillary thyroid carcinoma using artificial intelligence | Esce AR, Redemann JP, Sanchez AC, Olson GT, Hanson JA, Argwal S, Boyd NH, Martin DR | 2021 | The American Journal of Surgery | Oncology | HALO, HALO AI | |
| Diverse human astrocyte and microglial transcriptional responses to Alzheimer’s pathology | Smith A, Davey K, Tsartsalis S, Khozoie C, Fancy N, Tang S, Liaptsi E, Weinert M, McGarry A, Muirhead R, Gentleman S, Owen D, Matthews P | 2021 | Acta Neuropathologica | Neuroscience | Area Quantification, Multiplex IHC, Microglia | HALO |
| T Cells Limit Accumulation of Aggregate Pathology Following Intrastriatal Injection of α-Synuclein Fibrils | George S, Tyson T, Rey N, Sheridan R, Peelaerts W, Becker K, Schulz E, Meyerdirk L, Burmeister A, von Linstow C, Steiner J, Galvis M, Ma J, Pospisilik J, Labrie V, Brundin L, Brundin P | 2021 | Journal of Parkinson's Disease | Immunology, Neuroscience | HALO | |
| Viral alpha-synuclein knockdown prevents spreading synucleinopathy | Menon S, Kofoed R, Nabbouh F, Xhima K, Al-Fahoum Y, Langman T, Mount H, Shihabuddin L, Sardi S, Fraser P, Watts J, Aubert I, Tandon A | 2021 | Brain Communication | Neuroscience | HALO | |
| Alteration of Colonic Mucin Composition and Cytokine Expression in Acute Swine Dysentery | Lin S J-H, Arruda B, Burrough E | 2021 | Veterinary Pathology | Immunology | Area Quantification, ISH/FISH | HALO |
| The SGLT2i Dapagliflozin Reduces RV Hypertrophy Independent of Changes in RV Pressure Induced by Pulmonary Artery Banding | Connelly K, Wu E, Visram A, Friedberg M, Batchu S, Yeera V, Thai K, Nghiem L, Zhang Y, Kabir G, Desjardins J, Advani A, Gilbert R | 2021 | Research Square | Other | Area Quantification | HALO |
| CD19 and intraglandular CD163-positivity as prognostic indicators of pregnancy outcome in CD138-negative women with a previous fresh-embryo-transfer failure | Fan X, Yang Y, Wen Q, Li Y, Meng F, Liao J, Chen H, Lu G, Gong F | 2021 | Journal of Reproductive Immunology | Other | Multiplex IHC | HALO |
| Inflammatory Pathways Are Impaired in Alzheimer Disease and Differentially Associated With Apolipoprotein E Status | Kloske C, Dugan A, Weekman E, Winder Z, Patel E, Nelson P, Fardo D, Wilcock D | 2021 | Journal of Neuropathology & Experimental Neurology | Neuroscience | Object Colocalization | HALO |
| Functional expression of TRPA1 channel, TRPV1 channel and TMEM100 in human odontoblasts | Liu Y, Wang Y, Lou Y, Tian W, Que K | 2021 | Journal of Molecular Histology | Other | Highplex FL | HALO |
| Whole-slide imaging, tissue image analysis, and artificial intelligence in veterinary pathology: An updated introduction and review | Zuraw A, Aeffner F | 2021 | Veterinary Pathology | Review | Spatial Analysis | HALO |
| Recipient bone marrow-derived IL-17 receptor A-positive cells drive allograft fibrosis in a mouse intrapulmonary tracheal transplantation model | Watanabe T, Juvet S, Boonstra K, Guan Z, Joe B, Teskey G, Keshavjee S, Martinu T | 2021 | Transplant Immunology | Other | Highplex FL | HALO |
| Transcriptional and functional divergence in lateral hypothalamic glutamate neurons projecting to the lateral habenula and ventral tegmental area | Rossi M, Basiri M, Liu Y, Hashikawa Y, Hashikawa K, Fenno L, Kim Y, Ramakrishnan C, Deisseroth K, Stuber G | 2021 | Neuron | Neuroscience | ISH/FISH | HALO |
| Genetic suppression of the dopamine D3 receptor in striatal D1 cells reduces the development of L-DOPA-induced dyskinesia | Lanza K, Centner A, Coyle M, Del Priore I, Manfredsson F, Bishop C | 2021 | Experimental Neurology | Neuroscience | ISH/FISH | HALO |
| Complement activation is a crucial driver of acute kidney injury in rhabdomyolysis | Broudhabhay I, Poillerat V, Grunenwald A, Torset C, Leon J, Daugan M, Lucibello F, Karoui K, Ydee A, Chauvet S, Girardie P, Sacks S, Farrar C, Garred P, Berthaud R, Le Quintrec M, Rabant M de Lonlay P, Rambaud C, Gnemmi V, Fremeaux-Bacchi V, Frimat M, Roumenina L | 2021 | Kidney International | Other | Area Quantification | HALO |
| An endogenous opioid circuit determines state-dependent reward consumption | Castro D, Oswell C, Zhang E, Pedersen C, Piantadosi S, Rossi M, Hunker A, Guglin A, Moron J, Zweifel L, Stuber G, Bruchas M | 2021 | Nature | Neuroscience | ISH/FISH | HALO |
| Shaping the thyroid: from peninsula to de novo lumen formation | Pierreux C | 2021 | Molecular and Cellular Endocrinology | Review | Highplex FL | HALO |
| Sex differences in the rodent hippocampal opioid system following stress and oxycodone associated learning processes | Chalangal J, Mazid S, Windisch K, Milner T | 2021 | Pharmacology Biochemistry and Behavior | Review | ISH/FISH | HALO |
| Porcine epidemic diarrhea virus infection induces endoplasmic reticulum stress and unfolded protein response in jejunal epithelial cells of weaned pigs | Chen Y, Gabler N, Burrough E | 2021 | Veterinary Pathology | Other | Multiplex IHC | HALO |
| Contribution of NADPH oxidase to the retention of UVR-induced DNA damage by arsenic | Cooper K, Volk L, Dominguez D, Duran A, Liu K, Hudson L | 2021 | Toxicology and Applied Pharmacology | Other | Multiplex IHC | HALO |
| Use of high-rate ventilation results in enhanced recellularization of bio-engineered lung scaffolds | Ahmadipour M, Taniguchi D, Duchesneau P, Aoki F, Phillips G, Sinderby C, Waddell T, Karoubi G | 2021 | Tissue Engineering Part C: Methods | Biomaterials | Classifier, Multiplex IHC | HALO |
| Vascular endothelial ERp72 is involved in the inflammatory response in a rat model of skeletal muscle injury | Khalaf NB, Al-Mehatab D, Fathallah DM | 2021 | Molecular Medicine Reports | Immunology | Cytonuclear | HALO |
| Multiparameter immunohistochemistry analysis of HIV DNA, RNA and immune checkpoints in lymph node tissue | Richardson Z, Deleage C, Tutuka C, Walkiewica M, Del Rio-Estrada P, Pascoe R, Evans V, Reyesteran G, Gonzales M, Roberts-Thomson S, Gonzalez-Navarro M, Torres-Ruiz, F, Estes J, Lewin S, Cameron P | 2021 | Journal of Immunological Methods | Infectious Disease | ISH-IHC/FISH-IF | HALO |
| Distinct characteristics of limbic-predominant age-related TDP-43 encephalopathy in Lewy body disease | Uemura M, Robinson J, Cousins K, Tropea T, Kargilis D, McBride J, Suh E, Xie S, Xu Y, Porta S, Uemura N, Van Deerlin V, Wolk D, Irwin D, Brunden K, Lee V, Lee E, Trojanowski J | 2021 | Acta Neuropathologica | Neuroscience | Highplex FL | HALO |
| Tumor cell PD-L1 expression is a strong predictor of unfavorable prognosis in immune checkpoint therapy-naive clear cell renal cell cancer | Möller K, Fraune C, Blessin NC, Lennartz M, Kluth M, Hube-Magg C, Lindhorst L, Dahlem R, Fisch M, Eichenauer T, Riechardt S, Simon R, Sauter G, Büscheck F, Höppner W, Matthies C, Doh O, Krech T, Marx AH, Zecha H, Rink M, Steurer S, Clauditz TS | 2021 | International Urology and Nephrology | Immuno-oncology | Multiplex IHC, TMA | HALO |
| Engineering Cancer Antigen-Specific T Cells to Overcome the Immunosuppressive Effects of TGF-β | Silk J, Abbott R Adams K, Bennett A, Brett S, Cornforth T, Crossland K, Figueroa D, Jing J, O'Conner C, Pachnio A, Patasic L, Peredo C, Quattrini A, Quinn L, Rust A, Saini M, Sanderson J, Steiner D, Tavano B, Viswanathan P, Wiedermann G, Wong R, Jakobsen B, Britten C, Gerry A, Brewer J | 2021 | The Journal of Immunology | Immuno-oncology, Other | ISH/FISH | HALO |
| Tailoring Chemoimmunostimulant Bioscaffolds for Inhibiting Tumor Growth and Metastasis after Incomplete Microwave Ablation | Shen Y, Chen L, Guan X, Han X, Bo X, Li S, Sun L, Chen Y, Yue W, Xu H | 2021 | ACS Nano | Oncology, Biomaterials | Highplex FL | HALO |
| A single-cell atlas of mouse lung development | Negretti N, Plosa E, Benjamin J, Schuler B, Habermann A, Jetter C, Gulleman P, Bunn C, Hackett A, Ransom M, Taylor C, Nichols D, Matlock B, Guttentag S, Blackwell T, Banovich N, Kropski J, Sucre J | 2021 | Development | Other | ISH/FISH | HALO |
| Pharmacological HIF-1 stabilization promotes intestinal epithelial healing through regulation of α-integrin expression and function | Goggins B, Minihan K, Sherwin S, Soh W, Pryor J, Bruce J, Liu G, Mathe A, Knight D, Horvat J, Walker M, Keely S | 2021 | American Journal of Physiology-Gastrointestinal and Liver Physiology | Gastroenterology | Area Quantification | HALO |
| Endothelial cell infection and dysfunction, immune activation in severe COVID-19 | Qin Z, Liu F, Blair R, Wang C, Yang H, Mudd J, Currey J, Iwanaga N, He J, Mi R, Han K, Midkiff C, Alam M, Aktas B, Heide R, Veazey R, Piedimonte G, Maness N, Ergün S, Mauvais-Jarvis F, Rappaport J, Kolls J, Qin X | 2021 | Theranostics | Immunology, Infectious Disease | Multiplex IHC, Spatial Analysis | HALO |
| IL-1β Promotes Expansion of IL-33+ Lung Epithelial Stem Cells Following RSV Infection During Infancy | Vu L, Phan A, Hijano D, Siefker D, Tillman H, Cormierr S | 2021 | American Journal of Respiratory Cell and Molecular Biology | Infectious Disease | ISH-IHC | HALO |
| Transcriptomic Analysis of Healthy and Atopic Dermatitis Samples Reveals the Role of IL-37 in Human Skin | Zhou J, Gemperline D, Turner M, Oldach J, Molignano J, Sims J, Stayrook K | 2021 | ImmunoHorizons | Dermatology | Area Quantification, Cytonuclear | HALO |
| Toluidine blue staining of murine mast cells and quantitation by a novel, automated image analysis method using whole slide skin images | Raja N, Naikodi S, Govindarajan A, Palanisamy K | 2021 | Journal of Histotechnology | Immunology | Cytonuclear | HALO |
| Establishing a multiplex imaging panel to study T cell development in the thymus in mouse | Allam A, Russell S | 2022 | STAR Protocols | Immunology | Highplex FL | HALO |
| Glioblastoma exosomes influence glial cell hyaluronic acid deposition to promote invasiveness | Koessinger D, Novo D, Koessinger A, Zerbst D, Moore M, Mitchell L, Neilson M, Stevenson K, Chalmers A, Birch J, Norman J | 2022 | bioRxiv | Oncology | HALO | |
| Collagen-VI expression is negatively mechanosensitive in pancreatic cancer cells and supports the metastatic niche | Papalazarou V, Drew J, Juin A, Spence H, Nixon C, Salmeron-Sanchez M, Machesky L | 2022 | bioRxiv | Oncology | Area Quantification, Figure Maker | HALO |
| Genome-wide mapping of oncogenic pathways and genetic modifiers of chemotherapy using a high-risk hepatoblastoma genetic model | Fang J, Singh S, Natarajan S, Tillman H, Abuzaid A, Durbin A, Lee H, Wu Q, Steele J, Connelly J, Cheng C, Jin H, Chen W, Fan Y, Pruett-Miller S, Rehg J, Emmons J, Cairo S, Wang R, Glazer E, Murphy A, Chen T, Davidoff A, Easton J, Chen X, Yang J | 2022 | Research Square | Oncology | HALO | |
| Organelle resolved proteomics reveals new chordoma cell surface markers required for proliferation and association with outcome | Khan S, Zuccato J, Ignatchenko V, Singh O, Govindarajan M, Waas M, Gao A, Zadeh G, Kislinger T | 2022 | Research Square | Oncology | HALO | |
| SOX9+ malignant cells define a poor prognosis subtype of Glioma with tumor-associated macrophage recruitment | Yu S, Ma C, Wang H, Yu B, Luan Y, Xia Z | 2022 | Research Square | Immuno-oncology | HALO | |
| Multiplexed immunofluorescence analysis of CAFmarkers, EZH2 and FOXM1 in Gastric Tissue: Associations with Clinicopathological Parameters and Clinical Outcomes | Sun H, Wang X, Wang X, Tan C, Weng W, Zhang M, Ni S, Wang L, Huang D, Sheng W, Xu M | 2022 | Research Square | Oncology | HALO | |
| LncRNA scaRNA2 bridges DNA end-resection to homologous recombination repair mediated chemoradioresistance | Yang Y, Chen Y, Shen H, Liu T, Cao K, Wan Z, Du Z, Wang H, Yu Y, Ma S, Li B, Zhang W, Cai J, Gao F | 2022 | Research Square | Oncology | Highplex FL, TMA | HALO |
| STRIP2 motivates non-small cell lung cancer progression by modulating the TMBIM6 stability through IGF2BP3 dependent | Zhang X, Chen Q, He Y, Shi Q, Yin C, Xie Y, Yu H, Bao Y, Tang C, Dong Z | 2022 | Research Square | Oncology | Multiplex IHC | HALO |
| Construction of immune related prognostic model for pancreatic ductal adenocarcinoma based on single cell RNA-seq analysis | Chen K, Wang Q, Liu X, Wang F, Ma Y, Zhang S, Shao Z, Yang Y, Tian X | 2022 | Research Square | Oncology | HALO | |
| Fucosylation of HLA-DRB1 regulates CD4+T cell-mediated anti-melanoma immunity and enhances immunotherapy efficacy | Lau E, Lester D, Burton C, Gardner A, Innamarato P, Kodumudi K, Liu Q, Adhikari E, Ming Q, Williamson D, Frederick D, Sharova T, White M, Markowitz J, Cao B, Nguyen J, Johnson J, Beatty M, Mockabee0Macias A, Mercurio M, Watson G, Chen P, McCarthy S, Moran C, Messina J, Thomas K, Darville L, Izuma V, Koomen J, Pilon-Thomas S, Ruffell B, Luca V, Haltiwanger R, Wang X, Wargo J, Boland G | 2022 | Research Square | Immuno-oncology | HALO | |
| The association of HHLA2 and PD-L1 expression with prognosis and immune microenvironment in hepatocellular carcinoma | Wang C, Chen S, Yang X, Wu T, Liu L, Yun J | 2022 | Research Square | Oncology | HALO | |
| Developing a Nomogram for Preoperative Prediction of Cervical Cancer Lymph Node Metastasis by Multiplex Immunofluorescence | Wu J, Guo Q, Zhu J, Wu Y, Liang S Chen S, Wang S, Ju X, Wu X | 2022 | Authorea | Oncology | Spatial Analysis, Highplex FL, TMA | HALO |
| Collaborative workflow between pathologists and deep learning for evaluation of tumor cellularity in lung adenocarcinoma | Sakamoto T, Furukawa T, Pham H, Kuroda K, Tabata K, Kshima Y, Okoshi E, Morimoti S, Bychkov A, Fukuoka J | 2022 | bioRxiv | Oncology | HALO, HALO AI | |
| African-Ancestry Associated Gene Expression Signatures and Pathways in Triple Negative Breast Cancer, a Comparison across Women of African Descent | Martini R, Delpe P, Chu T, Arora K, Lord B, Verma A, Chen Y, Gebregzabher, Oppong J, Adjei E, Jibril A, Awuah B, Bekele M, Abebe E, Kyei I, Aitpillah F, Adinku M, Ankomah K, Osei-Bonsu E, Chitale D, Bensenhaver J, Nathanson S, Jackson L, Jiagge E, Petersen L, Proctor E, Gyan K, Gibbs L, Monojlovic Z, Kittles R, White J, Yates C, Manne U, Gardner K, Mongan N, Cheng E, Ginter P, Hoda S, Elemento O, Robine N, Sboner A, Carpten J, Newman L, Davis M | 2022 | medRxiv | Oncology | Multiplex IHC, Serial Section | HALO |
| 3’UTR-directed, kinase proximal mRNA decay inhibits C/EBPβ phosphorylation/activation to suppress senescence in tumor cells | Salotti J, Karim B, Misra S, Hu L, Basu S, Martin N, Luke B, Saylor K, Andresson T, Scheiblin D, Lockett S, Tessarollo L, Johnson P | 2022 | bioRxiv | Oncology | Classifier, Cytonuclear | HALO, HALO AI |
| CK2 signaling from TOLLIP-dependent perinuclear endosomes is an essential feature of KRAS mutant cancers | Basu S, Luke B, Karim B, Martin N, Lockett S, Das S, Andresson T, Saylor K, Kozlov S, Bassel L, Esposito D, Johnson P | 2022 | bioRxiv | Oncology | HALO, HALO AI | |
| Prostate cancer androgen receptor activity dictates efficacy of Bipolar Androgen Therapy | Sena L, Kumar R, Sanin D, Thompson E, Rosen D, Dalrymple S, Antony L, Yang Y, Comes-Alexandre C, Hicks J, Jones T, Bowers K, Eskra J, Meyers J, Gupta A, Skaist A, Yegnasubramanian S, Luo J, Brennen W, Kachhap S, Antonarakis E, De Marzo A, Isaacs J, Markowski M, Denmeade S | 2022 | medrxiv | Oncology | Classifier, Cytonuclear, Multiplex IHC, Registration | HALO |
| Cystatin C is glucocorticoid-responsive, directs recruitment of Trem2+ macrophages and predicts failure of cancer immunotherapy | Kleeman S, Demestichas B, Mourikis N, Loiero D, Ferrer M, Bankier S, Riazat-Kesh Y, Lee H, Chantzichristos D, Regan C, Preall J, Sinha S, Rosin N, Yipp B, de Almeida L, Biernaskie J, Dufour A, Tober-Lau P, Ruusalepp A, Bjorkegren J, Ralser M, Kuth F, Demechev V, Heywood T, Gao Q, Johannsson G, Koelzer V, Walker B, Meyer H, Janowitz T | 2022 | medrxiv | Immuno-oncology | Multiplex IHC | HALO, HALO AI |
| NOS2 and COX2 Blockade Limits TNBC Disease Progression and Alters CD8+ T Cell Spatial Orientation and Density | Somasundaram V, Ridnour L, Cheng R, Walke A, Kedei N, Bhattacharyya D, Wink A, Edmondson E, Butcher D, Warner A, Dorsey T, Scheiblin D, Heinz W, Bryant R, Kinders R, Lipkowitz S, Wong S, Pore M, Hewitt S, McVicar D, Anderson S, Chang J, Glynn S, Ambs S, Lockett S, Wink D | 2022 | bioRxiv | Immuno-oncology | HALO | |
| PHGDH heterogeneity potentiates cancer cell dissemination and metastasis | Rossi M, Altea-Manzano P, Demicco M, Doglioni G, Bornes L, Fukano M, Vandekeere A, Cuadros A, Fernandez-Garcia J, Riera-Domingo C, Jauset C, Planque M, Alkan H, Nittner D, Zuo D, Broadfield L, Parik S, Pane A, Rizzollo F, Rinaldi G, Zhang T, Teoh S, Aurora A, Karras P, Vermeire I, Broekaert D, Van Elsen J, Knott M, Orth M, Demeyer S, Eelen G, Dobrolecki L, Bassez A BRussel T, Sotlar K, Lewis M, Bartsch H, Wuhrer M, van Veelen P, Carmeliet J, Cools J, Morrison S, Marine J, Lambrechts D, Mazzone M, Hannon G, Lunt S, Grunewald T, Park M, van Rheenen J, Fendt S | 2022 | Nature | Oncology | Highplex FL | HALO |
| Potentiating adoptive cell therapy using synthetic IL-9 receptors | Kalbasi A, Siurala M, Su L, Tariveranmoshabad M, Picton L, Ravikumar P, Li P, Lin J, Escuin-Ordinas H, Da T, Kremer S, Sun A, Castelli S, Agarwal S, Scholler J, Song D, Rommel P, Radaelli E, Young R, Leonard W, Ribas A, June C, Gargia K | 2022 | Nature | Immuno-oncology | Highplex FL | HALO |
| Metastatic recurrence in colorectal cancer arises from residual EMP1+ cells | Canellas-Socias A, Cortina C, Hernando-Momblona X, Palomo-Ponce S, Mulholland E, Turon G, Mateo L, Conti S, Roman O, Sevillano M, Slebe F, Stork D, Caballe-Mestres A, Berenguer-Llergo A, Alvarez-Varela A, Fenderico N, Novellasdemunt L, Jimenez-Gracia L, Sipka T, Bardia L, Lorden P, Colombelli J, Heyn H, Trepat X, Tejpar S, Sancho E, Tauriello D, Leedham S, Attolini C, Batlle E | 2022 | Nature | Oncology | Classifier, Highplex FL, Registration | HALO |
| Liver tumour immune microenvironment subtypes and neutrophil heterogeneity | Xue R, Zhang Q, Cao Q, Kong R, Xiang X, Liu H, Feng M, Wang F, Cheng J, Li Z, Zhan Q, Deng M, Zhu J, Zhang Z, Zhang N | 2022 | Nature | Immuno-oncology | Multiplex IHC, Highplex FL | HALO |
| Tissue-resident FOLR2+ macrophages associate with CD8+ T cell infiltration in human breast cancer | Ramos R, Missolo-Koussou Y, Gerber-Ferder Y, Bromley C, Bugatti M, Nunez N, Boari J, Richer W, Menger L, Denizeau J, Sedlik C, Caudana P, Kotsias F, Niborski L, Viel S, Bohec M, Lameiras S, Baulande S, Lesage L, Nicolas A, Meseure D, Vincent-Salomon A, Reyal F, Dutertre C, Ginhoux F, Vimeux L, Donnadieu E, Buttard B, Galon J, Zelenay S, Vermi W, Guermonprez P, Piaggio E, Helft J | 2022 | Cell | Immuno-oncology | Spatial Analysis, Highplex FL | HALO |
| Tumor immune contexture is a determinant of anti-CD19 CAR T cell efficacy in large B cell lymphoma | Scholler N, Perbost R, Locke F, Jain M, Turcan S, Danan C, Chang E, Neelapu S, Miklos D, Jacobson C, Lekakis L, Lin Y, Ghobadi A, Kim J, Chou J, Plaks V, Wang Z, Xue A, Mattie M, Rossi J, Bot A, Galon J | 2022 | Nature Medicine | Immuno-oncology | HALO | |
| Upfront FOLFOXIRI plus bevacizumab with or without atezolizumab in the treatment of patients with metastatic colorectal cancer (AtezoTRIBE): a multicentre, open-label, randomised, controlled, phase 2 trial | Antoniotti C, Rossini D, Pietrantonio F, Catteau A, Salvatore L, Lonardi S, Boquet I, Tamberi S, Marmorino F, Moretto R, Ambrosini M, Tamburini E, Tortora G, Passardi A, Bergamo F, Kassambara A, Sbarrato T, Morano F, Ritorto G, Borelli B, Boccaccino A, Conca V, Giordano M, Ugolini C, Fieschi J, Papadopulos A, Massoue C, Aprile G, Antonyzzo L, Gelsomino F, Martinelli E, Pella N, Masi G, Fontanini G, Boni L, Galon J, Cremolini C | 2022 | The Lancet Oncology | Oncology | Multiplex IHC, Spatial Analysis | HALO |
| The chromatin remodeler CHD6 promotes colorectal cancer development by regulating TMEM65-mediated mitochondrial dynamics via EGF and Wnt signaling | Zhang B, Liu Q, Wen W, Gao H, Wei W, Tang A, Qin B, Lyu H, Meng X, Li K, Jin H, Yu F, Pan Q Lin J, Lee M | 2022 | Cell Discovery | Oncology | TMA | HALO |
| Escherichia coli-specific CXCL13-producing TFH are associated with clinical efficacy of neoadjuvant PD-1 blockade against muscle-invasive bladder cancer | Goubet A, Lordello L, Silva C, Peguillet I, Gazzano M, Mbogning-Fonkou M, Thelemaque C, Lebacle C, Thibault C, Audenet F, Pignot G, Gravis G, Helissey C, Campbedel L, Roupret M, Xylinas E, Ouzaid I, Dubuisson A, Mazzenga M, Flament C, Ly P, Marty V, Signolle N, Sauvat A, Sbarrato T, Filahi M, Davin C, Haddad G, Khalil J, Bleriot C, Danlos F, Dunsmore G, Mulder K, Silvin A, Raoult T, Archambaud B, Belhechmi S, Boneca I, Cayet N, Moya-Nilges M, Mallet A, Daillere R, Rouleau E, Radulescu C, Allory Y, Fieschi J, Rouanne M, Ginhoux F, Le Teuff G, Derosa L, Marabelle A, Van Dorp J, Van Dijk N, van der Heijden M, Besse B, Andre F, Merad M, Kroemer G, Scoazec J, Zitvogel L, Loriot Y | 2022 | Cancer Discovery | Oncology | Multiplex IHC, Spatial Analysis | HALO |
| Genomic and single-cell landscape reveals novel drivers and therapeutic vulnerabilities of transformed cutaneous T-cell lymphoma | Song X, Chang S, Seminario-Vidal L, de Mingo Pulido A, Tordesillas L, Song X, Reed R, Harkins A, Whiddon S, Nguyen J, Segura C, Zhang C, Yoder S, Sayegh Z, Zhao Y, Messina J, Harro C, Zhang X, Conejo-Garcia J, Berglund A, Sokol L, Zhang J, Rodriguez P, Mule J, Futreal A, Tsai K, Chen P | 2022 | Cancer Discovery | Oncology | HALO | |
| Reverse Transcriptase Inhibition Disrupts Repeat Element Life Cycle in Colorectal Cancer | Rajurkar M, Parikh A, Solovyov A, You E, Kulkarni A, Chu C, Xu K, Jaicks C, Taylor M, Wu C, Alexander K, Good C, Szabolcs A, Gerstberger S, Tran A, Xu N, Ebright R, Van Seventer E, Vo K, Tai E, Lu C, Joseph-Chazan J, Raabe M, Nieman L, Desai N, Arora K, Ligorio M, Thapar V, Cohen L, Garden P, Senussi Y, Zheng H, Allen J, Blaszkowsky L, Clark J, Goyal L, Wo J, Ryan D, Cocoran R, Deshpande V, Rivera M, Aryee M, Hong T, Berger S, WAlt D, Burns K, Park P, Greenbaum B, Ting D | 2022 | Cancer Discovery | Oncology | Area Quantification | HALO |
| A Targetable Myeloid Inflammatory State Governs Disease Recurrence in Clear Cell Renal Cell Carcinoma | Rappold P, Vuong L, Leibold J, Chakiryan N, Curry M, Kuo F, Sabio E, Jiang H, Nixon B, Liu M, Berglund A, Silagy A, Mascareno A, Golkaram M, Marker M, Reising A, Savchenko A, Milholland J, Chen Y, Russo P, Coleman J, Reznik E, Manley B, Ostrovnaya I, Makarav V, DiNatale R, Blum K, Ma X, Chowell D, Li M, Solit D, Lowe S, Chan T, Motzer R, Voss M, Hakimi A | 2022 | Cancer Discovery | Oncology | Highplex FL | HALO |
| The NALCN channel regulates metastasis and nonmalignant cell dissemination | Rahrmann E, Shorthouse D, Jassim A, Hu L, Ortiz M, Mahler-Araujo B, Vogel P, Paez-Ribes M, Fatemi A, Hannon G, Iyer R, Blundon J, Lourenco F, Kay J, Nazarian R, Hall B, Zakharenko S, Winton D, Zhu L, Gilbertson R | 2022 | Nature Genetics | Oncology | ISH/FISH | HALO |
| Neoantigen-specific CD4+ T cells in human melanoma have diverse differentiation states and correlate with CD8+ T cell, macrophage, and B cell function | Veatch J, Lee S, Shasha C, Singhi N, Szeto J, Moshiri A, Kim T, Smythe K, Kong P, Fitzgibbon M, Jesernig B, Bhatia S, Tykodi S, Hall E, Byrd D, Thompson J, Pillarisetty V, Duhen T, Houghton A, Newell E, Gottardo R, Riddell S | 2022 | Cancer Cell | Immuno-oncology | Spatial Analysis, Highplex FL | HALO |
| NKG2A and HLA-E define an alternative immune checkpoint axis in bladder cancer | Salome B, Sfakianos J, Ranti D, Daza J, Bieber C, Charap A, Hammer C, Banchereau R, Farkas A, Ruan D, Izadmehr S, Geanon D, Kelly G, Real R, Lee B, Beaumont K, Shroff S, Wang Y, Wang Y, Thin T, Garcia-Barros M, Hegewisch-Solloa E, Mace E, Wang L, O'Donnell T, Chowell D, Fernandez-Rodriguez R, Skobe M, Taylor N, Kim-Schulze S, Sebra R, Palmer D, Clancy-Thompson E, Hammond S, Kamphorst A, Malmberg K, Marcenaro E, Romero P, Brody R, Viard M, Yuki Y, Martin M, Carrington M, Mehrazin R, Wilund P, Mellman I, Mariathasan S, Zhu J, Galsky M, Bhardwaj N, Horowitz A | 2022 | Cancer Cell | Oncology, Immuno-oncology | Classifier, Multiplex IHC | HALO, HALO AI |
| Ablation of the endoplasmic reticulum stress kinase PERK induces paraptosis and type I interferon to promote anti-tumor T cell responses | Mandula J, Chang S, Mohamed E, Jimenez R, Sierra-Mondragon R, Chang D, Obermayer A, Moran-Segura C, Das S, Vazquez-Martinez J, Prieto K, Chen A, Smalley K, Czerniecki B, Forsyth P, Koya R, Ruffell B, Cubillos-Ruiz J, Munn D, Shaw T, Conejo-Garcia J, Rodriguez P | 2022 | Cancer Cell | Immuno-oncology | Highplex FL | HALO |
| CD16+ fibroblasts foster a trastuzumab-refractory microenvironment that is reversed by VAV2 inhibition | Liu X, Lu Y, Huang J, Xing Y, Dai H, Zhu L, Li S, Feng J, Zhou B, Li J, Xia Q, Li J, Huang M, Gu Y, Su S | 2022 | Cancer Cell | Immuno-oncology | Spatial Analysis, Highplex FL | HALO |
| Interferon-dependent SLC14A1+ cancer-associated fibroblasts promote cancer stemness via WNT5A in bladder cancer | Ma Z, Li X, Mao Y, Wei C, Huang Z, Li G, Yin J, Liang X, Liu Z | 2022 | Cancer Cell | Oncology | Multiplex IHC, Highplex FL | HALO |
| Dynamic and adaptive cancer stem cell population admixture in colorectal neoplasia | Vasquez E, Nasreddin N, Valbuena G, Mulholland E, Belnoue-Davis H, Eggington H, Schenck R, Wouters V, Wirapati P, Gilroy K, Lannagan R, Flanagan D, Nujumudeen A, Omwenga S, McCorry A, Easton A, Koelzer V, East J, Morton D, Trusolino L, Maughan T, Campbell A, Loughrey M, Dunne P, Tsantoulis P, Juels D, Tejpar S, Sansom O, Leedham S | 2022 | Cell Stem Cell | Oncology | Registration | HALO |
| An anti-PD-1–GITR-L bispecific agonist induces GITR clustering-mediated T cell activation for cancer immunotherapy | Chan S, Belmar N, Ho S, Rogers B, Stickler M, Graham M, Lee E, Tran N, Zhang D, Gupta P, Sho M, MacDonough T, Woolley A, Kim H, Zhang H, Liu W, Zheng P, Dezso Z, Halliwill K, Ceccarelli M, Rhodes S, Thakur A, Forsyth C, Xiong M, Tan S, Iyer R, Lake M, Digiammarino E, Zhou L, Bigelow L, Longenecker K, Judge R, Liu C, Trumble M, Remis J, Fox M, Cairns B, Akamatsu Y, Hollenbaugh D, Farding F, Alvarez H | 2022 | Nature Cancer | Immuno-oncology | Area Quantification | HALO |
| Multimodal integration of radiology, pathology and genomics for prediction of response to PD-(L)1 blockade in patients with non-small cell lung cancer | Vanguri R, Luo J, Aukerman A, Egger J, Fong C, Horvat N, Pagano A, Araujo-Filho J, Geneslaw L, Rizvi H, Sosa R, Boehm K, Yang S, Bodd F, Ventura K, Hollmann, T, Ginsberg M, Gao J, MSK MIND Consortium, Hellmann M, Sauter J, Shah S | 2022 | Nature Cancer | Immuno-oncology | HALO, HALO AI | |
| Tertiary lymphoid structures generate and propagate anti-tumor antibody-producing plasma cells in renal cell cancer | Meylan M, Petitprez F, Becht E, Bougouin A, Pupier G, Calvez A, Giglioli I, Verkarre V, Lacroix G, Verneau J, Sun C, Laurent-Puig P, Vano Y, Reynaud C, Reynies A, Sautes-Fridman C, Fridman W | 2022 | Immunity | Oncology | Spatial Analysis, Registration | HALO, HALO AI |
| Tumor cells modulate macrophage phenotype in a novel in vitro co-culture model of the non-small cell lung cancer tumor microenvironment | Park J, Chandra R, Cai L, Ganguly D, Li H, Toombs J, Girard L, Brekken R, Minna J | 2022 | Journal of Thoracic Oncology | Immuno-oncology | Highplex FL | HALO |
| The proteomic landscape of glioblastoma recurrence reveals novel and targetable immunoregulatory drivers | Tatari N, Khan S, Livingstone J, Zhai K, Mckenna D, Ignatchenko V, Chokshi C, Gwynne W, Singh M, Revill S, Mikolajewicz N, Zhu C, Chan J, Hawkins C, Lu J, Provias J, Ask K, Morrissy S, Brown S, Weiss T, Weller M, Han H, Greenspoon J, Moffat J, Venugopal C, Boutros P | 2022 | Acta Neuropathologica | Oncology | Multiplex IHC, TMA | HALO |
| Spatially mapping the immune landscape of melanoma using imaging mass cytometry | Moldoveanu D, Ramsay L, Lajoie M, Anderson-Trocme L, Lingrand M, Berry D, Perus L, Wei Y, Moraes C, Alkallas R, Rajkumar S, Zuo D, Dankner M, Xu E, Bertos N, Najafabadi H, Gravel S, Costantino S, Richer M, Lund A, Del Rincon S, Spatz A, Miller W, Jamal R, Lapointe R, Mes-Masson A, Turcotte S, Petrecca K, Dumitra S, Meguerditchian A, Richardson K, Tremblay F, Wang B, Chergui M, Guiot M, Watters K, Stagg J, Quail D, Mihalcioiu C, Meterissian S, Watson I | 2022 | Science Immunology | Oncology | Highplex FL | HALO |
| Cytotoxic granzyme C–expressing ILC1s contribute to antitumor immunity and neonatal autoimmunity | Nixon B, Chou C, Krishna C, Dadi S, Michel A, Cornish A, Kansler E, Do M, Wang X, Capistrano K, Rudensky A, Leslie C, Li M | 2022 | Science Immunology | Immuno-oncology | Area Quantification | HALO |
| Biomimetic nanoparticles drive the mechanism understanding of shear-wave elasticity stiffness in triple negative breast cancers to predict clinical treatment | Zheng D, Zhou J, Qian L, Liu X, Chang C, Tang S, Zhang H, Zhou S | 2022 | Bioactive Materials | Oncology | HALO, Pharma Services | |
| A selective and orally bioavailable VHL-recruiting PROTAC achieves SMARCA2 degradation in vivo | Kofink C, Trainor N, Mair B, Wrhrle S, Wurm M, Mischerikow N, Bader G, Rumpel K, Gerstberger T, Cui Y, Greb P, Garavel G, Scharnweber M, Fuchs J, Gremel G, Chette P, Hopf S, Budano N, Rinnenthal J, Gmaschitz G, Diers E, McLennan R, Roy M, Whitworth C, Vetma V, Mayer M, Koegl M, Ciulli A, Weinstabl H, Farnaby W | 2022 | Nature Communications | Oncology | Classifier | HALO |
| CD22-targeted CD28 bispecific antibody enhances antitumor efficacy of odronextamab in refractory diffuse large B cell lymphoma models | Wei J, Montalvo-Ortiz W, Yu L, Krasco A, Olson K, Rizvi S, Fiaschi N, Coetzee S, Wang F, Ullman E, Ahmed H, Herlihy E, Lee K, Havel L, Potocky T, Ebstein S, Frleta D, Khatri A, Godin S, Hamon S, Brouwer-Visser J, Gorenc T, Macdonald D, Hermann A, Chaudhry A, Sirulnik A, Olson W, Lin J, Thurston G, Lowy I, Murphy A, Smith E, Jankovic V, Sleeman M, Skokos D | 2022 | Science Translational Medicine | Immuno-oncology | Multiplex IHC, Highplex FL | HALO |
| The FUS::DDIT3 fusion oncoprotein inhibits BAF complex targeting and activity in myxoid liposarcoma | Zullow H, Sankar A, Ingram D, Guerra D, D'Avino A, Collings C, Lazcano R, Wang W, Liang Y, Qi J, Lazar A, Kadoch C | 2022 | Molecular Cell | Oncology | Multiplex IHC | HALO |
| Fasting improves therapeutic response in hepatocellular carcinoma through p53-dependent metabolic synergism | Krstic J, Reinisch I, Schindlmaier K, Galhuber M, Riahi Z, Berger N, Kupper N, Moyschewitz E, Auer M, Michenthaler H, Nossing C, Repaoli M, Ramadani-Muja J, Usluer S, Stryeck S, Pichler M, Rinner B, Deutsch A, Reinisch A, Madl T, Chiozzi R, Heck A, Huch M, Malli R, Prokesch | 2022 | Science Advances | Oncology | Classifier | HALO |
| Notch signaling promotes mature T-cell lymphomagenesis | Gao X, Wang C, Abdelrahman S, Kady N, Murga-Zamalloa C, Gann P, Sverdlov M, Wolfe A, Polk A, Brown N, Bailey N, Inamdar K, Casavilca-Zambrano S, Montes J, Barrionuevo C, Taxa L, Reneau J, Siebel C, Maillard I, Wilcox R | 2022 | Cancer Research | Immuno-oncology | Highplex FL | HALO, HALO AI |
| Overcoming high level adenosine-mediated immunosuppression by DZD2269, a potent and selective A2aR antagonist | Bai Y, Zhang X, Zheng J, Liu Z, Yang Z, Zhang X | 2022 | Journal of Experimental & Clinical Cancer Research | Oncology | HALO | |
| Tertiary lymphoid structures critical for prognosis in endometrial cancer patients - a TransPORTEC study | Horeweg N, Workel, H, Loiero D, Church D, Vermij L, Léon-Castillo A, Krog R, de Boer S, Nout R, Powel M, Mileshkin L, MacKay H, Leary A, Singh N, Jürgenliemk-Schulz I, Creutzberg C, Koelzer V, Nijman H, Bosse T, Bruyn M | 2022 | Nature Communications | Oncology | TMA | HALO, HALO AI |
| A lncRNA signature associated with tumor immune heterogeneity predicts distant metastasis in locoregionally advanced nasopharyngeal carcinoma | Liang Y, Zhang Y, Tan X, Qiao H, Liu S, Tang L, Mao Y, Chen L, Li W, Zhou G, Zhao Y, Li J, Li Q, Huang S, Gong S, Zheng Z, Li Z, Sun Y, Jiang W, Ma J, Li Y, Liu N | 2022 | Nature Communications | Immuno-oncology | Multiplex IHC, Registration | HALO |
| Hyperpolarised 13C-MRI identifies the emergence of a glycolytic cell population within intermediate-risk human prostate cancer | Sushentsev N, McLean M, Warren A, Benjamin A, Brodie C, Frary A, Gill A, Jones J, Kaggie J, Lamb B, Locke M, Miller J, Mills I, Priest A, Robb F, Shah N, Schulte R, Graves M, Gnanapragasam V, Brindle K, Barrett T, Gallacher F | 2022 | Nature Communications | Oncology | ISH/FISH, Membrane, Multiplex IHC | HALO |
| In vivo tumor immune microenvironment phenotypes correlate with inflammation and vasculature to predict immunotherapy response | Sahu A, Kose K, Kraehenbuehl L, Byers C, Holland A, Tembo T, Santella A, Alfonso A, Li M, Cordova M, Gill M, Fox C, Gonzalez S, Kumar P, Wang A, Kurtansky N, Chandrani P, Yin S, Mehta P, Navarrete-Dechent C, Peterson G, King K, Dusza S, Yang N, Liu S, Phillips W, Guitera P, Rossi A, Halpern A, Deng L, Pulitzer M, Marghoob A, Chen C, Merghoub T, Rajadhyaksha M | 2022 | Nature Communications | Immuno-oncology | HALO | |
| Combination of T cell-redirecting bispecific antibody ERY974 and chemotherapy reciprocally enhances efficacy against non-inflamed tumours | Sano Y, Azuma Y, Tsunenari T, Kayukawa Y, Shinozuka J, Fujii E, Amano J, Nishito Y, Maruyama T, Kinoshita Y, Sakamoto Y, Yoshida A, Miyazaki Y, Sato Y, Teramoto-Seida C, Ishiguro T, Tanaka T, Kitazawa T, Endo M | 2022 | Nature Communications | Immuno-oncology | Immune | HALO |
| Single cell analysis of cribriform prostate cancer reveals cell intrinsic and tumor microenvironmental pathways of aggressive disease | Wong H, Sheng Q, Hesterberg A, Croessmann S, Rios B, Giri K, Jackson J, Miranda A, Watkins E, Schaffer K, Donahue M, Winkler E, Penson D, Smith J, Herrell S, Luckenbaugh A, Barocas D, Kim Y, Graves D, Giannico G, Rathmell J, Park B, Gordetsky J, Hurley P | 2022 | Nature Communications | Oncology | ISH/FISH | HALO |
| Progranulin mediates immune evasion of pancreatic ductal adenocarcinoma through regulation of MHCI expression | Cheung P, Yang J, Fang R, Borgers A, Krengel K, Stoffel A, Althoff K, Yip C, Siu E, Ng L, Lang K, Cham L, Engel D, Soun C, Cima I, Scheffler B, Striefler J, Sinn M, Bahra M, Pelzer U, Oettle H, Markus P, Smeets E, Aarntzen E, Savvatakis K, Liffers S, Lueong S, Neander C, Bazarna A, Zhang X, Paschen A, Crawford H, Chan A, Cheung S, Siveke J | 2022 | Nature Communications | Oncology | Spatial Analysis | HALO |
| The Neo-PLANET phase II trial of neoadjuvant camrelizumab plus concurrent chemoradiotherapy in locally advanced adenocarcinoma of stomach or gastroesophageal junction | Tang Z, Wang Y, Liu D, Wang X, Xu C, Yu Y, Cui Y, Tang C, Li Q, Sun J, Zhang Q, Ji Y, Ma G, Li H, Shen Z, Shen K, Zheng R, Hou Z, Liu T, Wang J, Sun Y | 2022 | Nature Communications | Immuno-oncology | HALO | |
| Fibrocytes boost tumor-supportive phenotypic switches in the lung cancer niche via the endothelin system | Weigert A, Zheng X, Nenzel A, Turkowski K, Gunther S, Strack E, Sirait-Fischer E, Elwakeel E, Kur I, Nikam V, Valasarajan C, Winter H, Wissgott A, Voswinkel R, Grimminger F, Brune B, Seeger W, Pullamsetti S, Savai R | 2022 | Nature Communications | Oncology | Spatial Analysis | HALO |
| Multiregional single-cell dissection of tumor and immune cells reveals stable lock-and-key features in liver cancer | Ma L, Heinrich S, Wang L, Keggenhoff F, Khatib S, Forgues M, Kelly M, Hewitt S, Saif A, Hernandez J, Mabry D, Kloeckner R, Greten T, Chaisaingmongkol J, Ruchirawat M, Marquardt J, Wang X | 2022 | Nature Communications | Oncology | ISH/FISH | HALO |
| Tumor MHC Class I Expression Associates with Intralesional Interleukin-2 Response in Melanoma | Pourmaleki M, Jones C, Ariyan C, Zeng Z, Pirun M, Navarrete D, Li Y, Zhang M, Nandakumar S, Campos C, Nadeem S, Klimstra D, Temple-Oberle C, Brenn T, Kipson E, Schenk K, Stein J, Taube J, White M, Traweek R, Wargo J, Kirkwood J, Gasmi B, Goff S, Corwin A, McDonough E, Ginty F, Callahan M, Schietinger A, Socci N, Mellinghoff I, Hollmann T | 2022 | Cancer Research Immunology | Immuno-oncology | Highplex FL | HALO |
| Co-existing alterations of MHC class I antigen presentation and IFNγ signaling mediate acquired resistance of melanoma to post-PD-1 immunotherapy | Nielson M, Presti M, Sztupinszki Z, Jensen A, Draghi A, Chamberlain C, Schina A, Yde C, Wojcik J, Szallasi Z, Crowther M, Svane I, Donia M | 2022 | Cancer Immunology Research | Immuno-oncology | HALO Link | |
| CD73 inhibits cGAS-STING and cooperates with CD39 to promote pancreatic cancer | Jacoberger-Foissac C, Cousineau I, Bareche Y, Allard D, Chrobak P, Allard B, Pommey S, Messaoudi N, McNicoll Y, Soucy G, Koseoglu S, Masia R, Lake A, Seo H, Eeles C, Rohatgi N, Robson S, Turcotte S, Haibe-Kains B, Stagg J | 2022 | Cancer Immunology Research | Oncology | HALO | |
| Satellite repeat RNA expression in epithelial ovarian cancer associates with a tumor immunosuppressive phenotype | Porter R, Sun S, Flores M, Berzolla E, You E, Phillips I, KC N, Desai N, Tai E, Szabolcs A, Lang E, Pankaj A, Raabe M, Thapar V, Xu K, Nieman L, Rabe D, Kolin D, Stover E, Pepin D, Stott S, Deshpande V, Liu J, Solovyov A, Matulonis U, Greenbaum B, Ting D | 2022 | The Journal of Clinical Investigation | Immuno-oncology | ISH/FISH, ISH-IHC/FISH-IF | HALO |
| Annexin A2/TLR2/MYD88 pathway induces arginase 1 expression in tumor-associated neutrophils | Zhang H, Zhu X, Friesen T, Kwak J, Pisarenko T, Mekvanich S, Velasco M, Randolph T, Kargl J, Houghton A | 2022 | Journal of Clinical Investigation | Immuno-oncology | ISH-IHC/FISH-IF | HALO |
| Nitric oxide favours tumour-promoting inflammation through mitochondria-dependent and -independent actions on macrophages | Drehmer D, Luiz J, Hernandez C, Alves-Filho J, Hussell T, Townsend P, Moncada S | 2022 | Redox Biology | Oncology | Highplex FL | HALO |
| Systemic Nos2 Depletion and Cox inhibition limits TNBC disease progression and alters lymphoid cell spatial orientation and density | Somasundaram V, Ridnour L, Cheng R, Walke A, Kedei N, Bhattacharyya D, Wink A, Edmondson E, Butcher D, Warner A, Dorsey T, Scheiblin D, Heinz W, Bryant R, Kinders R, Lipkowitz S, Wong S, Pore M, Hewitt S, McVicar D, Anderson S, Chang J, Glynn S, Ambs S, Lockett S, Wink D | 2022 | Redox Biology | Oncology | Classifier, Registration | HALO |
| CD4+ T helper 2 cells suppress breast cancer by inducing terminal differentiation | Boieri M, Malishkevich A, Guennoun R, Marchese E, Kroon S, Trerice K, Awad M, Park J, Iyer S, Kreuzer J, Haas W, Rivera M, Demehri S | 2022 | Journal of Experimental Medicine | Immuno-oncology | HALO | |
| PERK reprograms hematopoietic progenitor cells to direct tumor-promoting myelopoiesis in the spleen | Liu M, Wu C, Luo S, Hua Q, Chen H, Weng Y, Xu J, Lin H, Wang L, Li J, Zhu L, Guo Z, Zhuang S, Kang T, Zheng L | 2022 | Journal of Experimental Medicine | Oncology | Highplex FL, Registration | HALO |
| Multi-modal molecular imaging maps the correlation between tumor microenvironments and nanomedicine distribution | Strittmatter N, Moss J, Race A, Sutton D, Canales J, Ling S, Wong E, Wilson J, Smith A, Howes C, Bunch J, Barry S, Goodwin R, Ashford M | 2022 | Theranostics | Immuno-oncology | Highplex FL | HALO, HALO AI |
| Multi-scale integrative analyses identify THBS2+ cancer-associated fibroblasts as a key orchestrator promoting aggressiveness in early-stage lung adenocarcinoma | Yang H, Sun B, Fan L, Ma W, Xu K, Hall S, Wang Z, Schmid R, Peng R, Marti T, Gao W, Xu J, Yang W, Yao F | 2022 | Theranostics | Oncology | HALO | |
| PD-L1 predicts chemotherapy resistance in large-cell neuroendocrine carcinoma | Che Y, Luo Z, Cao Y, Sun N, Xue Q, He J | 2022 | British Journal of Surgery | Oncology | Classifier, Multiplex IHC | HALO |
| Spatiotemporal transcriptome analysis reveals critical roles for mechano-sensing genes at the border zone in remodeling after myocardial infarction | Yamada S, Ko T, Hatsuse S, Nomura S, Zhang B, Dai Z, Inoue S, Kubota M, Sawami K, Yamada T, Sassa T, Katagiri M, Fujita K, Katoh M, Ito M, Harada M, Toko H, Takeda N, Morita H, Aburatani H, Komuro I | 2022 | Nature Cardiovascular Research | Myology | ISH-IHC/FISH-IF | HALO |
| Evaluation of Early Markers of Ischemia-reperfusion Injury and Preservation Solutions in a Modified Hindlimb Model of Vascularized Composite Allotransplantation | Rostami S, Xu M, Datta S, Haykal S | 2022 | Transplantation Direct | Other | HALO | |
| Cannabinoid control of gingival immune activation in chronically SIV-infected rhesus macaques involves modulation of the indoleamine-2,3-dioxygenase-1 pathway and salivary microbiome | McDew-White M, Lee E, Alvarez X, Sestak K, Ling B, Byrareddy S, Okeoma C, Mohan M | 2022 | EBioMedicine | Infectious Disease | Area Quantification | HALO |
| ACE2-IgG1 fusions with improved in vitro and in vivo activity against SARS-CoV-2 | Iwanaga N, Cooper L, Rong L, Maness N, Beddingfield B, Qin Z, Crabtree J, Tripp R, Yang H, Blair R, Jangra S, Garcia-Sastre A, Schotsaert M, Chandra S, Robinson J, Srivastava A, Rabito F, Qin X, Kolls J | 2022 | iScience | Infectious Disease | Highplex FL | HALO, HALO AI |
| Integrated pathological analysis to develop a Gal-9 based immune survival stratification to predict the outcome of lung large cell neuroendocrine carcinoma and its usefulness in immunotherapy | Che Y, Luo Z, Cao Y, Wang J, Xue Q, Sun N, He J | 2022 | International Journal of Biological Sciences | Oncology | Classifier, Multiplex IHC | HALO |
| Genome Sequence and Experimental Infection of Calves with Bovine Gammaherpesvirus 4 (BoHV-4) | Bauermann F, Falkenberg S, Martins M, Dassanayake R, Neill J, Ridpath J, Silveira S, Palmer M, Buysse A, Mohr A, Flores E, Diel D | 2022 | Research Square | Infectious Disease, Other | ISH/FISH | HALO |
| Postmortem high-dimensional immune profiling of severe COVID-19 patients reveals distinct patterns of immunosuppression and immunoactivation | Wu H, He P, Ren Y, Xiao S, Wang W, Liu Z, Li H, Wang Z, Zhang D, Cai J, Zhou X, Jiang D, Fei X, Zhao L, Zhang H, Liu Z, Chen R, Li W, Wang C, Zhang S, Qin J, Nasan B, Sun C | 2022 | Nature Communications | Infectious Disease | Multiplex IHC | HALO |
| Increased apoptotic sensitivity of glioblastoma enables therapeutic targeting by BH3-mimetics | Koessinger A, Cloix C, Koessinger D, Heiland D, Bock F, Strathdee K, Kinch K, Martinez-Escardo L, Paul N, Nixon C, Malviya G, Jackson M, Campbell K, Stevenson K, Davis S, Elmasry Y, Ahmed A, O'Prey J, Ichim G, Schnell O, Stewart W, Blyth K, Ryan K, Chalmers A, Norman J, Tait S | 2022 | Cell Death & Differentiation | Oncology | HALO | |
| AAV9/MFSD8 gene therapy is effective in preclinical models of neuronal ceroid lipofuscinosis type 7 disease | Chen X, Dong T, Hu Y, Shaffo F, Belur N, Mazzulli J, Gray S | 2022 | The Journal of Clinical Investigation | Neuroscience | ISH/FISH | HALO |
| Transcription factor Mesenchyme Homeobox Protein 2 (MEOX2) modulates nociceptor function | Kokotovic T, Lenartowicz E, Langeslag M, Ciotu C, Fell C, Scaramuzza A, Fischer M, Kress M, Penninger J, Nagy V | 2022 | The FEBS Journal | Neuroscience | Multiplex IHC | HALO |
| Switching to Regular Diet Partially Resolves Liver Fibrosis Induced by High-Fat, High-Cholesterol Diet in Mice | Farooq M, Hameed H, Dimanchi-Boitrel M, Piquet-Pellorce C, Samson M, Le Seyec J | 2022 | Nutrients | Metabolism | Area Quantification | HALO |
| New Fully Automated Preparation of High Apparent Molar Activity 68Ga-FAPI-46 on a Trasis AiO Platform | Da Pieve C, Braga M, Turton D, Valla F, Cakmak P, Plate K, Kramer-Marek G | 2022 | Molecules | Other | HALO | |
| Modelling aggressive prostate cancers of young men in immune-competent mice, driven by isogenic Trp53 alterations and Pten loss | Mejia-Hernandez J, Keam S, Saleh R, Muntz F, Fox S, Byrne D, Kogan A, Pang L, Huynh J, Litchfield C, Caramia F, Lozano G, He H, You J, Sandhu S, Williams S, Haupt Y, Haupt S | 2022 | Cell Death & Disease | Oncology | HALO | |
| Activation of Drp1 promotes fatty acids-induced metabolic reprograming to potentiate Wnt signaling in colon cancer | Xiong X, Hasani S, Young L, Rivas D, Skaggs A, Martinez R, Wang C, Weiss H, Gentry M, Sun R, Gao T | 2022 | Cell Death & Differentiation | Oncology | Multiplex IHC | HALO |
| Repeated photodynamic therapy mediates the abscopal effect through multiple innate and adaptive immune responses with and without immune checkpoint therapy | Lou J, Aragaki M, Bernards N, Chee T, Gregor A, Hiraishi Y, Ishiwata T, Leung C, Ding L, Kitazawa S, Koga T, Sata Y, Ogawa H, Chen J, Kato T, Yasufuku K, Zheng G | 2022 | Biomaterials | Oncology | Cytonuclear | HALO |
| High-dose rifampin improves bactericidal activity without increased intracerebral inflammation in animal models of tuberculous meningitis | Ruiz-Bedoya C, Mota F, Tucker E, Mahmud F, Reyes-Mantilla M, Erice C, Bahr M, Flavahan K, De Jesus P, Kim J, Foss C, Peloquin C, Hammound D, Ordonez A, Pardo C, Jain S | 2022 | The Journal of Clinical Investigation | Infectious Disease | Area Quantification | HALO |
| Evaluation of a PEGylated Fibroblast Growth Factor 21 Variant Using Novel Preclinical Magnetic Resonance Imaging and Magnetic Resonance Elastography in a Mouse Model of Nonalcoholic Steatohepatitis | Tang H, Li J, Zinker B, Boehm S, Mauer A, Rex-Rabe S, Glaser K, Fronheiser M, Bradstreet T, Nakao Y, Petrone T, Pena A, Villano M, Chow P, Malhi H, Charles E, Hayes W, Ehman R, Du S, Yin M | 2022 | Journal of Magnetic Resonance Imaging | Metabolism | Vacuole | HALO |
| Therapeutic treatment with the anti-inflammatory drug candidate MW151 may partially reduce memory impairment and normalizes hippocampal metabolic markers in a mouse model of comorbid amyloid and vascular pathology | Braun D, Powell D, McLouth C, Roy S, Watterson D, Van Eldik | 2022 | PLOS One | Neuroscience | Classifier, Area Quantification | HALO |
| Obesity due to Steroid Receptor Coactivator-1 deficiency is associated with endocrine and metabolic abnormalities | Cacciottolo T, Henning E, Keogh J, Lassen P, Lawler K, Bounds R, Ahmed R, Perdikari A, Mendes de Oliverira E, Smith M, Godfrey E, Johnson E, Hodson L, Clement K, van der Klaauw A, Farooqi I | 2022 | The Journal of Clinical Endocrinology & Metabolism | Metabolism | Vacuole | HALO |
| High-Field Asymmetric Waveform Ion Mobility Spectrometry and Parallel Reaction Monitoring Increases Sensitivity for Clinical Biomarker Quantitation from FormalinFixed, Paraffin-Embedded Tumor Biopsies | Sweet S, Chain D, Yu W, Martin P, Rebelatto M, Chambers A, Cecchi F, Kim Y | 2022 | bioRxiv | Other | HALO AI | |
| Eradicating tumor in a recurrent cervical cancer patient with autologous tumorinfiltrating lymphocytes and a modified lymphodepleting regimen | Guo J, Luo N, Ai G, Yang W, Zhu J, Li C, Chen R, Zhang C, Liu S, Jin H, Cheng Z | 2022 | Journal for ImmunoTherapy of Cancer | Immuno-oncology | HALO | |
| The oral drug nitazoxanide restricts SARS-CoV-2 infection and attenuates disease pathogenesis in Syrian hamsters | Miorin L, Mire C, Ranjbar S, Hume A, Huang J, Crossland N, White K, Laporte M, Kehrer T, Haridas V, Moreno E, Nambu A, Jangra S, Cupic A, Dejosez M, Abo K, Tseng A, Werder R, Rathnasinghe R, Mutetwa T, Ramos I, Sainz de Aja J, Garcia de Alba Rivas C, Schotsaert M, Corley R, Falvo J, Fernandez-Sesma A, Kim C, Rossingnol J, Wilson A, Zwaka T, Kotton D, Muhlberger E, Garcia-Sastre A, Goldfeld A | 2022 | bioRxiv | Infectious Disease | Area Quantification | HALO |
| Pancreas resident macrophage-induced fibrosis has divergent roles in pancreas inflammatory injury and PDAC | Baer J, Zuo C, Kang L, Alarcon de la Lastra A, Bocherding N, Knolhoff B, Bogner S, Zhu Y, Lewis M, Zhang N, Kim K, Fields R, Mills J, Ding L, Randolph G, DeNardo D | 2022 | bioRxiv | Fibrosis | Figure Maker | HALO |
| ZEB1 transcription factor promotes immune escape in melanoma | Plaschka M, Benboubker V, Grimont M, Berthet J, Tonon L, Lopez J, Le-Bouar M, Balme B, Tondeau G, de la Fouchardiere A, Larue L, Puisieux A, Grinberg-Bleyer Y, Bendriss-Vermare N, Dubois B, Caux C, Dalle S, Caramel J | 2022 | Journal for ImmunoTherapy of Cancer | Immuno-oncology | Highplex FL | HALO |
| Pathogenesis of follicular thymic hyperplasia associated with rheumatoid arthritis | Ohe R, Yang S, Yamashita D, Ichikawa C, Saito A, Kabasawa T, Utsunomiya A, Aung N, Urano Y, Kitaoka T, Suzuki K, Takahara D, Sasaki A, Takakubo Y, Takagi M, Yamakawa M, Futakuchi M | 2022 | Pathology International | Other | HALO | |
| Baseline and post-treatment biomarkers of resistance to anti-PD-1 therapy in acral and mucosal melanoma: an observational study | Shui I, Liu X, Zhao Q, Kim S, Sun Y, Yearley J, Choudhury T, Webber A, Krepler C, Cristescu R, Lee J | 2022 | Journal for Immunotherapy of Cancer | Immuno-oncology | HALO | |
| Extracellular vesicles released after cranial radiation: An insight into an early mechanism of brain injury | Sukati S, Ho J, Chaiswing L, Sompol P, Pandit H, Wei W, Izumi T, Chen Q, Weiss H, Noel T, Bondada S, Butterfield D, St. Cair D | 2022 | Brain Research | Neuroscience | Area Quantification | HALO |
| Spatial meta-transcriptomics reveal associations of intratumor bacteria burden with lung cancer cells showing a distinct oncogenic signature | Wong-Rolle A, Dong Q, Zhu Y, Divakar P, Hor J, Kedei N, Wong M, Tillo D, Conner E, Rajan A, Schrump D, Jim C, Germain R, Zhao C | 2022 | Journal for ImmunoTherapy of Cancer | Immuno-oncology | HALO | |
| Spartalizumab or placebo in combination with dabrafenib and trametinib in patients with BRAF V600-mutant melanoma: exploratory biomarker analyses from a randomized phase 3 trial (COMBI-i) | Tawbi H, Robert C, Brase J, Gusenleitner D, Gasal E, Garrett J, Savchenko A, Gorgun G, Flaherty K, Ribas A, Dummer R, Schadendorf D, Long G, Nathan P, Ascierto P | 2022 | Journal for ImmunoTherapy of Cancer | Oncology | Multiplex IHC | HALO |
| Transcriptional and functional analyses of neoantigen-specific CD4 T cells during a profound response to anti-PD-L1 in metastatic Merkel cell carcinoma | Church C, Pulliam T, Longino N, Park S, Smythe K, Makarov V, Riaz N, Jing L, Amezquita R, Campbell J, Gottardo R, Pierce R, Choi J, Chan T, Koelle D, Nghiem P | 2022 | Journal for ImmunoTherapy of Cancer | Oncology, Immuno-oncology | HALO | |
| The GotoKakizaki rat: Impact of age upon changes in cardiac and renal structure, function | Meagher P, Civitarese R, Lee X, Gordon M, Bugyei-Twum A, Desjardins J, Kabir G, Zhang Y, Kosanam H, Visram A, Leong-Poi H, Advani A, Connelly K | 2022 | PLOS One | Myology | Muscle Fiber | HALO |
| Phase I/II clinical trial of a helper peptide vaccine plus PD-1 blockade in PD-1 antibody-naïve and PD-1 antibody-experienced patients with melanoma (MEL64) | Vavolizza R, Petroni G, Mauldin I, Chianese-Bullock K, Olson W, Smith K, Dengel L, Haden K, Grosh W, Kaur V, Varhegyi N, Gaughan E, Slingluff C | 2022 | Journal for ImmunoTherapy of Cancer | Immuno-oncology | HALO | |
| Intratumoral administration of CD1c (BDCA-1)+ and CD141 (BDCA-3)+ myeloid dendritic cells in combination with talimogene laherparepvec in immune checkpoint blockade refractory advanced melanoma patients: a phase I clinical trial | Schwarze J, Tijtgat J, Awada G, Cras L, Vasaturo A, Bagnall C, Forsyth R, Dufait I, Tuyaerts S, Riet I, Neyns B | 2022 | Journal for ImmunoTherapy of Cancer | Oncology, Immuno-oncology | HALO | |
| An immunoPET probe to SARS-CoV-2 reveals early infection of the male genital tract in rhesus macaques | Madden P, Thomas Y, Blair R, Samer S, Doyle M, Midkiff C, Becker M, Arif M, McRaven M, Simons L, Carias A, Martinelli E, Lorenzo-Redondo R, Hultquist J, Villinger F, Veazey R, Hope T | 2022 | bioRxiv | Infectious Disease | HALO | |
| Transcriptional and DNA Methylation Signatures of Subcutaneous Adipose Tissue and Adipose-Derived Stem Cells in PCOS Women | Divoux A, Erdos E, Whytock K, Osborne T, Smith S | 2022 | Cells | Metabolism | Area Quantification | HALO |
| Higher proportions of CD39+ tumorresident cytotoxic T cells predict recurrence-free survival in patients with stage III melanoma treated with adjuvant immunotherapy | Attrill G, Owen C, Ahmed T, Vergara I, Colebatch A, Conway J, Nahar K, Thompson J, da Silva I, Carlino M, Menzies A, Lo S, Palendira U, Scolyer R, Long G, Wilmott J | 2022 | Journal for ImmunoTherapy of Cancer | Immuno-oncology | Spatial Analysis | HALO |
| Inhibition of CK2 mitigates Alzheimer’s tau pathology by preventing NR2B synaptic mislocalization | Marshall C, McBride J, Changolkar L, Riddle D, Trojanowski J, Lee V M-Y | 2022 | Acta Neuropathologica Communications | Neuroscience | HALO | |
| Unveiling the tumor immune microenvironment of organ-specific melanoma metastatic sites | Conway J, Rawson R, Lo S, Ahmed T, Veregara I, Gide T, Attrill G, Carlino M, Saw R, Thompson J, Spillane A, Shannon K, Shivalingam B, Menzies A, Wilmott J, Long G, Scolyer R, da Silva I | 2022 | Journal for ImmunoTherapy of Cancer | Oncology | Classifier, Spatial Analysis | HALO |
| Fatal Neurodissemination and SARS-CoV-2 Tropism in K18-hACE2 Mice Is Only Partially Dependent on hACE2 Expression | Carossino M, Kenney D, O'Connell A, Montarnaro P, Tseng A, Gertje H, Grosz K, Ericsson M, Huber B, Kurnick S, Subramaniam S, Kirkland T, Walker J, Francis K, Klose A, Paragas N, Bosmann M, Saeed M, Balasuriya U, Douam F, Crossland N | 2022 | Viruses | Infectious Disease | Classifier, Area Quantification, Highplex FL | HALO |
| Deep-Learning-Aided Detection of Mycobacteria in Pathology Specimens Increases the Sensitivity in Early Diagnosis of Pulmonary Tuberculosis Compared with Bacteriology Tests | Zaizen Y, Kanhori Y, Ishijima S, Kitamura Y, Yoon H, Ozasa M, Mukae H, Bychkov A, Hoshino T, Fukuoka J | 2022 | Diagnostics | Infectious Disease | HALO, HALO AI | |
| Acetyl-CoA-carboxylase 1 (ACC1) plays a critical role in glucagon secretion | Veprik A, Denwood G, Liu D, Bakar R, Morfin V, McHugh K, Tebeka N, Vetterli L, Yonova-Doing E, Gribble F, Reimann F, Hoehn K, Hemsley P, Ahnfelt-Ronne J, Rorsman P, Zhang Q, Wet H, Cantley J | 2022 | Communications Biology | Metabolism | HALO | |
| Sulforaphane exhibits antiviral activity against pandemic SARS-CoV-2 and seasonal HCoV-OC43 coronaviruses in vitro and in mice | Ordonez A, Bullen C, Villabona-Rueda A, Thompson E, Turner M, Merino V, Yan Y, Kim J, Davis S, Komm O, Powell J, D'Alessio F, Yolken R, Jain S, Jones-Brando L | 2022 | Communications Biology | Infectious Disease | Area Quantification | HALO |
| Extracellular matrix proteins regulate NK cell function in peripheral tissues | Bunting M, Vyas M, Requesens M, Langenbucher A, Schiferle E, Manguso R, Lawrence M, Demehri S | 2022 | Science Advances | Dermatology | HALO | |
| A Phase 1/2 Trial Combining Avelumab and Trabectedin for Advanced Liposarcoma and Leiomyosarcoma | Wagner M, Zhang Y, Cranmer L, Loggers E, Black G, McDonnell S, Maxwell S, Johnson R, Moore R, Hermida de Viveriros P, Aicher L, Smythe K, He Q, Jones R, Pollack S | 2022 | Clinical Cancer Research | Oncology | Highplex FL | HALO |
| Neoadjuvant Therapy Induces a Potent Immune Response to Sarcoma, Dominated by Myeloid and B Cells | Goff P, Riolobos L, LaFleur B, Spraker M, Seo Y, Smythe K, Campbell J, Pierce R, Zhang Y, He Q, Kim E, Schaub S, Kane G, Mantilla J, Chen E, Ricciotti R, Thompson M, Cranmer L, Wagner M, Loggers E, Jones R, Murphy E, Blumenschein W, McClanahan T, Earls J, Flanagan K, LaFranzo N, Kim T, Pollack S | 2022 | Clinical Cancer Research | Immuno-oncology | Highplex FL | HALO |
| Adrenal tropism of SARS-CoV-2 and adrenal findings in a post-mortem case series of patients with severe fatal COVID-19 | Paul T, Ledderose S, Bartsch H, Sun N, Soliman S, Markl B, Ruf V, Herms J, Stern M, Keppler O, Delbridge C, Muller S, Piontek G, Kimoto Y, Schreiber F, Williams T, Neumann J, Knosel T, Schulz H, Spallek R, Graw M, Kirchner T, Walch A, Rudelius M | 2022 | Nature Communications | Infectious Disease | HALO | |
| Modulation of the Human Pancreatic Ductal Adenocarcinoma Immune Microenvironment by Stereotactic Body Radiotherapy | Mills B, Qiu H, Drage M, Chen C, Mathew J, Garrett-Larsen J, Ye J, Uccello T, Murphy J, Belt B, Lord E, Katz A, Linehan D, Gerber S | 2022 | Clinical Cancer Research | Oncology | Classifier, Spatial Analysis, Highplex FL | HALO |
| Plasma CD27, a surrogate of the intratumoral CD27-CD70 interaction, correlates with immunotherapy resistance in renal cell carcinoma | Benhamouda N, Sam I, Epaillard N, Gey A, Phan L, Pham H, Gruel N, Saldmann A, Pineau J, Hasan M, Quiniou V, Nevoret C, Verkarre V, Libri V, Mella S, Granier C, Broudin C, Ravel P, De Guillebon E, Mauge L, Helley D, Jabla B, Chaput N, Albiges L, Katsahian S, Adam J, Mejean A, Adotevi O, Vano Y, Oudard S, Tartour E | 2022 | Clinical Cancer Research | Oncology | Spatial Analysis, Highplex FL | HALO |
| Improved cognitive impairments by silencing DMP1 via enhancing the proliferation of neural progenitor cell in Alzheimer-like mice | Zhao H, Wei J, Du Y, Chen P, Liu X, Liu H | 2022 | Aging Cell | Neuroscience | HALO | |
| A tumor suppressor role for EZH2 in diffuse midline glioma pathogenesis | Dhar S, Gadd S, Patel P, Vaynshteyn Jm Raju G, Hashizume R, Brat D, Becher O | 2022 | Acta Neuropathologica Communications | Neuroscience | HALO | |
| Defactinib, pembrolizumab, and gemcitabine in patients with advanced treatment refractory pancreatic cancer: A phase I, dose escalation, and expansion study | Wang-Gillam A, Lim K, McWilliams R, Suresh R, Lockhart A, Brown A, Breden M, Belle J, Herndon J, Bogner S, Pedersen K, Tan B, Boice N, Acharya A, Abdiannia M, Gao F, Yoon H, Zhu M, Trikalinos N, Ratner L, Aranha O, Hawkins W, Herzog B, DeNardo D | 2022 | Clinical Cancer Research | Immuno-oncology | Multiplex IHC, Spatial Analysis | HALO |
| Ad26.COV2.S prevents upregulation of SARS-CoV-2 induced pathways of inflammation and thrombosis in hamsters and rhesus macaques | Aid M, Vidal S, Piedra-Mora C, Ducat S, Chan C, Bondoc S, Colarusso A, Starke C, Nekorchuk M, Busman-Sahay K, Estes J, Martinot A, Barouch D | 2022 | PLOS Pathogens | Infectious Disease | Area Quantification, Multiplex IHC | HALO, HALO AI |
| Clinical tissue biomarker digital image analysis: A review of current applications | Li Z, Bui M, Pantanowitz L | 2022 | Human Pathology Reports | Review | HALO | |
| Vertical transmission of attaching and invasive E. coli from the dam to neonatal mice predisposes to more severe colitis following exposure to a colitic insult later in life | Brand M, Proctor A, Hostetter J, Zhou N, Friedberg I, Jergens A, Phillips G, Wannemuehler M | 2022 | PLOS ONE | Other | ISH/FISH | HALO |
| Advanced Age and Neurotrauma Diminish Glutathione and Impair Antioxidant Defense after Spinal Cord Injury | Stewart A, Glaser E, Mott C, Bailey W, Sullivan P, Patel S, Gensel J | 2022 | Journal of Neurotrauma | Neuroscience | HALO | |
| Humanized mice reveal a macrophage-enriched gene signature defining human lung tissue protection during SARS-CoV-2 infection | Kenney D, O'Connell A, Turcinovic J, Montanaro P, Hekman R, Tamura T, Berneshawi A, Cafiero T, Abdullatif S, Blum B, Goldstein S, Heller B, Gertje H, Bullitt E, Trachtenberg A, Chavez E, Nono E, Morrison C, Tseng A, Sheikh A, Kurnick S, Grosz K, Bosmann M, Ericsson M, Huber B, Saeed M, Balazs A, Francis K, Klose A, Paragas N, Campbell J, Connor J, Emili A, Crossland N, Ploss A, Douam F | 2022 | Cell Reports | Infectious Disease | Area Quantification, Highplex FL | HALO |
| A Deep Learning Convolutional Neural Network Can Differentiate Between Helicobacter Pylori Gastritis and Autoimmune Gastritis With Results Comparable to Gastrointestinal Pathologists | Franklin M, Schultz F, Tafoya M, Kerwin A, Broehm C, Fischer E, Gullapalli R, Clark D, Hanson J, Martin D | 2022 | Archives of Pathology & Laboratory Medicine | Oncology, Gastroenterology | HALO, HALO AI | |
| Intraoperative abobotulinumtoxinA alleviates pain after surgery and improves general wellness in a translational animal model | Cornet S, Carre D, Limana L, Castel D, Meilin S, Horn R, Pons L, Evans S, Lezmi S, Kalinichev M | 2022 | Research Square | Other | Object Colocalization | HALO |
| Interface astrogliosis in contact sport head impacts and military blast exposure | Babcock K, Abdolmohammadi B, Kiernan P, Mahar I, Cherry J, Alvarez V, Goldstein L, Stein T, McKee, Huber B | 2022 | Acta Neuropathologica Communications | Neuroscience | Area Quantification | HALO |
| The GBA1 D409V mutation exacerbates synuclein pathology to differing extents in two alpha-synuclein models | Polinski N, Martinez T, Ramboz S, Sasner M, Herberth M, Switzer R, Ahmad S, Pelligrino L, Clark S, Marcus J, Smith S, Dave K, Frasier M | 2022 | Disease Models & Mechanisms | Neuroscience | Object Colocalization | HALO |
| Immune and epithelial determinants of age-related risk and alveolar injury in fatal COVID-19 | Chait M, Yilmaz M, Shakil S, Ku A, Dogra P, Connors T, Szabo P, Gray J, Wells S, Kubota M, Matsumoto R, Poon M, Snyder M, Baldwin M, Sims P, Saqi A, Farber D, Weisberg S | 2022 | JCI Insight | Infectious Disease | Multiplex IHC | HALO |
| Neuropathology and virus in brain of SARS-CoV-2 infected non-human primates | Rutkai I, Mayer M, Hellmers L, Ning B, Huang Z, Monjure C, Coyne C, Silvestri R, Golden N, Hensley K, Chandler K, Lehmicke G, Bix G, Maness N, Russell-Lodrigue K, Hu T, Roy C, Blair R, Bohm R, Doyle-Meyers L, Rappaport J, Fisher T | 2022 | Nature Communications | Infectious Disease | Area Quantification | HALO |
| A novel soluble epoxide hydrolase vaccine protects murine cardiac muscle against myocardial infarction | Kitsuka T, Shiraki A, Oyama J, Nakagami H, Tanaka A, Node K | 2022 | Scientific Reports | Other | Figure Maker | HALO, HALO AI |
| C57BL/6J Mice Are Not Suitable for Modeling Severe SARS-CoV-2 Beta and Gamma Variant Infection | Currey J, Rabito F, Maness N, Blair R, Rappaport J, Qin X, Kolls J, Srivastava A | 2022 | Viruses | Infectious Disease | HALO | |
| Type I interferon regulates proteolysis by macrophages to prevent immunopathology following viral infection | Lee A, Feng E, Chew M, Balint E, Poznanski S, Giles E, Zhang A, Marzok A, Revill S, Vahedi F, Dubey A, Ayaub E, Jimenez-Saiz R, McGrath J, Ritchie T, Jordana M, Jonigk D, Ackermann M, Ask K, Miller M, Richards C, Ashkar A | 2022 | PLOS Pathogens | Infectious Disease | Area Quantification, Multiplex IHC, TMA | HALO |
| Dietary Pharmacological Zinc and Copper Enhances Voluntary Feed Intake of Nursery Pigs | DeMille C, Burrough E, Kerr B, Schweer W, Gabler N | 2022 | Frontiers in Animal Science | Other | HALO | |
| Epicardium-derived cells organize through tight junctions to replenish cardiac muscle in salamanders | Eroglu E, Yen C, Witman N, Elewa A, Araus A, Wang H, Szattler T, Umeano C, Sohlmer J, Goedel A, Simon A, Chien K | 2022 | Nature Cell Biology | Myology | HALO | |
| Sotatercept analog suppresses infammation to reverse experimental pulmonary arterial hypertension | Joshi S, Liu J, Bloom T, Atabay E, Kuo T, Lee M, Belecheva E, Spaits M, Grenha R, Maguire M, Frost J, Wang K, Briscoe S, Alaxander M, Herrin B, Castonguay R, Pearsall R, Andre P, Yu P, Kumar R, Li G | 2022 | Scientific Reports | Other | HALO | |
| Single-cell profling of human dura and meningioma reveals cellular meningeal landscape and insights into meningioma immune response | Wang A, Bowman-Kirigin J, Desai R, Kang L, Patel P, Patel B, Khan S, Bender D, Marlin M, Liu J, Osbun J, Leuthardt E, Chicoine M, Dacey Jr R, Zipfel G, Kim A, DeNardo D, Petti A, Dunn G | 2022 | Genome Medicine | Neuroscience | Area Quantification | HALO |
| Assessment of spatial transcriptomics for oncology discovery | Lyubetskaya A, Rabe B, Fisher A, Lewin A, Neuhaus I, Brett C, Brett T, Pereira E, Golhar R, Kebede S, Font-Tello A, Mosure K, Wittenberghe N, Mavrakis K, Maclsaac K, Chen B, Drokhlyansky E | 2022 | Cell Reports Methods | Oncology | Registration | HALO, HALO AI |
| Characterization and Validation of In Vitro and In Vivo Models to Investigate TNF-α-Induced Inflammation in Retinal Diseases | Weigelt C, Zippel N, Fuchs H, Rimpela A, Schonberger T, Stierstorfer B, Bakker R, Redemann N | 2022 | Translational Vision Science & Technology | Immunology, Other | HALO | |
| Maternal Western-Style Diet Impairs Bone Marrow Development and Drives a Hyperinflammatory Phenotype in Hematopoietic Stem and Progenitor Cells in Fetal Rhesus Macaques | Sureshchandra S, Chan C, Robino J, Parmelee L, Nash M, Wesolowski S, Pietras E, Friedman J, Takahashi D, Shen W, Hennebold J, Goldman D, Packwood W, Lindner J,Roberts C, Burwitz B, Messaoudi I, Varlamov O | 2022 | bioRxiv | Metabolism | Multiplex IHC | HALO |
| An in vivo accelerated developmental myelination model for testing promyelinating therapeutics | Lariosa-Willingham K, Leunoudakis D, Bragge T, Tolppanen L, Nurmi A, Flanagan M, Gibson J, Wilson D, Stratton J, Lehtimaki K, Miszczuk D | 2022 | BMC Neuroscience | Neuroscience | Area Quantification | HALO |
| Targeting breast and pancreatic cancer metastasis using a dual-cadherin antibody | Micalizzi D, Che D, Nicholson B, Edd J, Desai N, Lang E, Toner M, Maheswaran S, Ting D, Haber D | 2022 | Proceedings of the National Academy of Sciences | Oncology | HALO | |
| Discovery of antibodies and cognate surface targets for ovarian cancer by surface profiling | Schrofelbauer B, Kimes P, Hauke P, Reid C, Shao K, Hill S, Irizarry R, Hahn W | 2022 | Proceedings of the National Academy of Sciences | Oncology | Highplex FL | HALO |
| Excessive immunosuppression by regulatory T cells antagonizes T cell response to schistosome infection in PD-1-deficient mice | Lu L, Li T, Feng X, Liu Z, Liu Y, Chao T, Gu Y, Huang R, Zhang F, He L, Zhou B, Kong E, Liu Z, | 2022 | PLOS Pathogens | Immunology, Other | HALO | |
| Orchestrating the Dermal/Epidermal Tissue Ratio during Wound Healing by Controlling the Moisture Content | Tuca A, de Mattos I, Funk M, Winter R, Palackic A, Groeber-Becker F, Kruse D, Kukla F, Lemarchand T, Kamolz L | 2022 | Biomedicines | Other | Classifier | HALO |
| Restoring Pro-healing/remodeling- associated M2a/c Macrophages using ON101 Accelerates Diabetic Wound Healing | Lin C, Chen C, Huang W, Chen Y, Chen S, Chou H, Hung C, Chen W, Lu C, Nian S, Chen S, Chang H, Chang V, Liu L, Kuo M, Chang S | 2022 | JID Innovations | Other | Area Quantification, Cytonuclear | HALO |
| TGFβ1 Induces Senescence and Attenuated VEGF Production in Retinal Pericytes | Avarmovic D, Archaimbault S, Kemble A, Gruener S, Lazendic M, Westenskow P | 2022 | Biomedicines | Other | ISH/FISH | HALO |
| Prenatal di-(2-ethylhexyl_ phthalate exposure induced myocardial cytotoxicity via the regulation of the NRG1-dependent ErbB2/ErbB4-PI3K/AKT signaling pathway in fetal mice | Yu D, Zhu D, Wang X, Li B, Li J, Lu P, Ji Y, Wang X | 2022 | Ecotoxicology and Environmental Safety | Other | Multiplex IHC | HALO |
| Knockdown of ZBTB11 impedes R-loop elimination and increases the sensitivity to cisplatin by inhibiting DDX1 transcription in bladder cancer | Chen L, Liu Z, Tang H, Zhou Z, Chen J, Ma Z, Deng M, Li X, Wu Y, Zheng L, Zhou L, Zheng X, Liu Z | 2022 | Cell Proliferation | Oncology | Multiplex IHC | HALO |
| T-cell mediated targeted delivery of anti-PD-L1 nanobody overcomes poor antibody penetration and improves PD-L1 blocking at the tumor site | Pierre-Florent P, Bombart R, Desimpel P, Naulaerts S, Thouvenel L, Collet J, Van den Eynde B, Zhu J | 2022 | Cancer Immunology Research | Immuno-oncology | Area Quantification, Cytonuclear | HALO |
| Distinct Encoding of Reward and Aversion by Peptidergic BNST Inputs to the VTA | Soden M, Yee J, Cuevas B, Rastani A, Elum J, Zweifel L | 2022 | Frontiers in Neural Circuits | Neuroscience | ISH/FISH | HALO |
| Cancer-associated fibroblasts require proline synthesis by PYCR1 for the deposition of pro-tumorigenic extracellular matrix | Kay E, Paterson K, Riero-Domingo C, Sumpton D, Dabritz J, Tardito S, Boldrini C, Hernandez-Fernaud J, Athineos D, Dhayade S, Stepanova E, Gjerga E, Neilson L, Lilla S, Hedley A, Koulouras G, McGregor G, Jamieson C, Johnson R, Park M, Kirschner K, Miller C, Kamphorst J, Loayza-Puch F, Saez-Rodriguez J, Mazzone M, Blyth K, Zagnoni M, Zanivan S | 2022 | Nature Metabolism | Oncology, Metabolism | HALO | |
| Effects of Extracorporeal Shockwave Therapy on Functional Recovery and Circulating miR-375 and miR-382-5p after Subacute and Chronic Spinal Cord Contusion Injury in Rats | Ashmwe M, Posa K, Ruhrnossl A, Heinzel J, Heimel P, Mock M, Schadl B, Keibl C, Couillard-Despres S, Redl H, Mittermayr R, Hercher D | 2022 | Biomedicines | Neuroscience, Other | Classifier, Multiplex IHC | HALO |
| Exposure modality influences viral kinetics but not respiratory outcome of COVID-19 in multiple nonhuman primate species | Fears A, Beddingfield B, Chirichella N, Slisarenko N, Kileen S, Redmann R, Goff K, Spencer S, Picou B, Golden N, Midkiff C, Bush D, Branco L, Boisen M, Gao H, Montefiori D, Blair R, Doyle-Meyers L, Russel-Lodrigue K, Maness N, Roy C | 2022 | PLOS Pathogens | Infectious Disease | Highplex FL | HALO |
| Single-cell RNA sequencing reveals cellular and molecular reprograming landscape of gliomas and lung cancer brain metastases | Sun H, Li L, Lao I, Li X, Xu B, Cao Y, Jin W | 2022 | Clinical and Translational Medicine | Oncology | HALO | |
| ATG7 is a haploinsufficient repressor of tumor progression and promoter of metastasis | Long J, Kania E, McEwan D, Barthet V, Brucoli M, Ladds M, Nossing C, Ryan K | 2022 | Proceedings of the National Academy of Sciences | Oncology, Other | Area Quantification | HALO |
| Integrated single-cell analyses decode the developmental landscape of the human fetal spine | Yu H, Tang D, Wu H, Li C, Lu Y, He F, Zhang X, Yang Y, Shi W, Hu W, Zeng Z, Dai W, Ou M, Dai Y | 2022 | iScience | Other | HALO | |
| The combination of gene hyperamplification and PD-L1 expression as a biomarker for the clinical benefit of tislelizumab in gastric/gastroesophageal junction adenocarcinoma | Lu Z, Yang S, Luo X, Shi Y, Lee J, Deva S, Liu T, Chao Y, Zhang Y, Huang R, Xu Y, Shen Z, Shen L | 2022 | Gastric Cancer | Immuno-oncology | Classifier, Multiplex IHC | HALO |
| Glycosphingolipids are mediators of cancer plasticity through independent signaling pathways | Cumin C, Huang Y, Rossdam C, Ruoff F, Cespedes S, Liang C, Lombardo F, Coelho R, Rimmer N, Konantz M, Lopez M, Alam S, Schmidt A, Calabrese D, Fedier A, Vlajnic T, Itzstein M, Templin M, Buettner F, Everest-Dass A, Heinzelmann-Schwarz V, Jacob F | 2022 | Cell Reports | Oncology | Classifier | HALO |
| Sensory neurons display cell-type-specific vulnerability to loss of neuron-glia interactions | Elbaz B, Yang L, Vardy M, Isaac S, Rader B, Kawaguchi R, Traka M, Woolf C, Renthal W, Popko B | 2022 | Cell Reports | Neuroscience | HALO | |
| MMO-Net (Multi-Magnification Organ Network): A use case for Organ Identification using Multiple Magnifications in Preclinical Pathology Studies | Serna C, Romero-Palomo F, Arcadu F, Funk J, Schumacher V, Janowczyk A | 2022 | Journal of Pathology Informatics | Other | HALO | |
| Tumor-infiltrated activated B cells suppress liver metastasis of colorectal cancers | Xu Y, Wei Z, Feng M, Zhu D, Mei S, Wu Z, Feng Q, Chang W, Ji M, Liu C, Zhu Y, Shen L, Yang F, Chen Y, Feng Y, Xu J, Zhu D | 2022 | Cell Reports | Oncology, Immuno-oncology | HALO | |
| In vivo G-CSF treatment activates the GR-SOCS1 axis to suppress IFN-γ secretion by natural killer cells | Zhao X, Peng T, Cao X, Hou Y, Li R, Han T, Fan Z, Zhao M, Chang Y, Chen H, Li C, Huang X | 2022 | Cell Reports | Immunology | Highplex FL | HALO |
| Approaches to spatially resolving the tumour immune microenvironment of hepatocellular carcinoma | Marsh-Wakefield F, Ferguson A, Liu K, Santhakumar C, McCaughan G, Palendira U | 2022 | Therapeutic Advances in Medical Oncology | Review | HALO | |
| Intact HIV proviruses persist in the brain despite viral suppression with ART | Cochrane C, Angelovich T, Byrnes S, Waring E, Guanizo A, Trollope G, Zhou J, Vue J, Senior L, Wanicek E, Eddine J, Gartner M, Jenkins T, Gorry P, Brew B, Lewin S, Estes J, Roche M, Churchill M | 2022 | Annals of Neurology | Infectious Disease | HALO | |
| Isoniazid and Rifapentine Treatment effectively reduces persistent M. tuberculosis infection in macaque lungs | Sharan R, Ganatra S, Singh D, Cole J, Foreman T, Thippeshappa R, Peloquin C, Shivanna V, Gonzalez O, Day C, Gandhi N, Dick E, Hall-Ursone S, Mehra S, Schlesinger L, Rengarajan J, Kaushal D | 2022 | Journal of Clinical Investigation | Infectious Disease | HALO | |
| Radioprotective effect of X-ray abdominal FLASH irradiation: Adaptation to oxidative damage and inflammatory response may be benefiting factors | Zhu H, Xie D, Yang Y, Huang S, Gao X, Peng Y, Wang B, Wang J, Xiao D, Wu D, Li C, Li C, Qian C, Deng X | 2022 | Medical Physics | Oncology, Other | HALO | |
| Malfunction of airway basal stem cells plays a crucial role in pathophysiology of tracheobronchopathia osteoplastica | Hong Y, Shan S, Gu Y, Huang H, Zhang Q, Han Y, Dong Y, Liu Z, Huang M, Ren T | 2022 | Nature Communications | Other | HALO | |
| Chronic rhinosinusitis patients display an aberrant immune cell localisation with enhanced S. aureus biofilm metabolic activity and biomass | Shaghayegh G, Cooksley C, Bouras G, Panchatcharam B, Idrizi R, Jana M, Ellis S, Psaltis A, Wormald P, Vreugde S | 2022 | Journal of Allergy and Clinical Immunology | Immunology, Infectious Disease | Classifier, Spatial Analysis, Highplex FL | HALO |
| A survey on artificial intelligence in histopathology image analysis | Abdelsamea M, Zidan U, Senousy Z, Gaber M, Rakha E, Ilyas M | 2022 | WIREs Data Mining and Knowledge Discovery | Review | Classifier, Cytonuclear | HALO |
| Automated recognition of glomerular lesions in the kidneys of mice by using deep learning | Akatsuka A, Horai Y, Akatsuka A | 2022 | Journal of Pathology Informatics | Other | HALO, HALO AI | |
| Tau Pathology in Chronic Traumatic Encephalopathy is Primarily Neuronal | Butler M, Dixon E, Stein T, Alvarez V, Huber B, Buckland M, McKee A, Cherry J | 2022 | Journal of Neuropathology & Experimental Neurology | Neuroscience | Spatial Analysis | HALO, HALO AI |
| AKR1C3 regulated by NRF2/MAFG complex promotes proliferation via stabilizing PARP1 in hepatocellular carcinoma | Pan D, Yang W, Zeng Y, Qin H, Xu Y, Gui Y, Fan X, Tian G, Wu Y, Sun H, Ye Y, Yang S, Zhou J, Guo Q, Zhao L | 2022 | Oncogene | Oncology | HALO | |
| Two independent modes of kidney stone suppression achieved by AIM/CD5L and KIM-1 | Matsuura K, Maehara N, Hirota A, Eguchi A, Yasuda K, Taniguchi K, Nishijima A, Matsuhashi N, Shiga Y, Ishii R, Iguchi Y, Tanabe K, Arai S, Miyazaki T | 2022 | Communications Biology | Other | HALO | |
| MYC sensitises cells to apoptosis by driving energetic demand. | Edwards-Hicks J, Su H, Mangolini M, Yoneten K, Wills J, Rodriguez-Blanco G, Young C, Cho K, Barker H, Muir M, Guerrieri A, Li X, White R, Manasterski P, Mandrou E, Wills K, Chen J, Abraham E, Sateri K, Qian B, Bankhead P, Arends M, Gammoh N, von Kriegsheim A, Patti G, Sims A, Acosta J, Brunton V, Kranc K, Christophorou M, Pearce E, Ringshausen I, Finch A | 2022 | Nature Communications | Oncology, Metabolism | Classifier | HALO |
| The addition of FAIMS increases targeted proteomics sensitivity from FFPE tumor biopsies | Sweet S, Chain D, Yu W, Martin P, Rebelatto M, Chambers A, Cecchi F, Kim Y | 2022 | Scientific Reports | Other | HALO, HALO AI | |
| The Key Molecular Mechanisms of Sini Decoction Plus Ginseng Soup to Rescue Acute Liver Failure: Regulating PPARα to Reduce Hepatocyte Necroptosis? | He Y, Zhang Y, Zhang J, Hu X | 2022 | Journal of Inflammation Research | Other | Area Quantification | HALO |
| Bright-Field Multiplex Immunohistochemistry Assay for Tumor Microenvironment Evaluation in Melanoma Tissues | Ugolini F, Pasqualini E, Simi S, Baroni G, Massi D | 2022 | Cancers | Other | Multiplex IHC | HALO, HALO Link |
| Adult re-expression of IRSp53 rescues NMDA receptor function and social behavior in IRSp53-mutant mice | Noh Y, Yook C, Kang J, Lee S, Kim Y, Yang E, Kim H, Kim E | 2022 | Communications Biology | Neuroscience | ISH/FISH | HALO |
| A Beta-containing bivalent SARS-CoV-2 spike protein vaccine candidate with AS03 elicits durable and broad neutralization of variants including Omicron in macaques and confers protection in hamsters | Berry C, Pavot V, Anosova N, Kishko M, Huang D, Tibbitts T, Raillard A, Gautheron S, Cummings S, Bangari D, Kar S, Atyeo C, Deng Y, Alter G, Gutzeit C, Koutsoukos M, Chicz R, Lecouturier V | 2022 | Research Square | Infectious Disease | HALO | |
| Combined genetic deletion of GDF15 and FGF21 has modest effects on body weight, hepatic steatosis and insulin resistance in high fat fed mice | Patel S, Haider A, Alvarez-Guaita A, Bidault G, Moustafa J, Guiu-Jurado E, Tadross J, Warner J, Harrison J, Virtue S, Scurria F, Zvetkova I, Bluher M, Small K, O'Rahilly S, Savage D | 2022 | Molecular Metabolism | Metabolism | Vacuole | HALO |
| Cell graph neural networks enable the precise prediction of patient survival in gastric cancer | Wang Y, Wang Y, Hu C, Li M, Fan Y, Otter N, Sam I, Gou H, Hu Y, Kwok T, Zalcberg J, Boussioutas A, Daly R, Montufar G, Lio P, Xu D, Webb G, Song J | 2022 | Precision Oncology | Oncology | HALO | |
| In situ mass spectrometry imaging reveals heterogeneous glycogen stores in human normal and cancerous tissues | Young L, Conroy L, Clarke H, Hawkinson T, Bolton K, Sanders W, Chang J, Webb M, Alilain W, Vander Kooi C, Drake R, Andrews D, Badgett T, Wagner L, Allison D, Sun R, Gentry M | 2022 | EMBO Molecular Medicine | Oncology, Metabolism | Multiplex IHC | HALO |
| Prostate-Specific Membrane Antigen Is a Biomarker for Residual Disease following Neoadjuvant Intense Androgen Deprivation Therapy in Prostate Cancer | Bright J, Lis R, Ku A, Terrigino N, Whitlock N, Trostel S, Carrabba N, Harmon S, Turkbey B, Wilkonson S, Sowalsky A | 2022 | Journal of Urology | Oncology | Area Quantification | HALO |
| Integrated multi-omics analysis of adverse cardiac remodeling and metabolic inflexibility upon ErbB2 and ERRα deficiency | Dufour C, Xia H, B'chir W, Perry M, Kuzmanov U, Gainullina A, Dejgaard K, Scholtes C, Ouellet C, Zuo D, Sanguin-Gendreau V, Guluzian C, Smith H, Muller W, Audet-Walsh E, Sergushichev A, Emili A, Giguere V | 2022 | Communications Biology | Other | HALO | |
| Effects of hypoxia-preconditioned HucMSCs on neovascularization and follicle survival in frozen/thawed human ovarian cortex transplanted to immunodeficient mice | Cheng J, Ruan X, Li Y, Du J, Jin F, Gu M, Zhou Q, Xu X, Yang Y, Wang H, Mueck A | 2022 | Stem Cell Research & Therapy | Other | HALO | |
| Endothelial cell death after ionizing radiation does not impair vascular structure in mouse tumor models | Kaeppler J, Chen J, Buono M, Vermeer J, Kannan P, Cheng W, Voukantsis D, Thompson J, Hill M, Allen D, Gomes A, Kersemans V, Kinchesh P, Smart S, Buffa F, Nerlov C, Muschel R, Markelc B | 2022 | EMBO Reports | Oncology | HALO | |
| Loss of EMP1 promotes the metastasis of human bladder cancer cells by promoting migration and conferring resistance to ferroptosis through activation of PPAR gamma signaling | Liu S, Shi J, Wang L, Huang Y, Zhao B, Ding H, Liu Y, Wang W, Chen Z, Yang J | 2022 | Free Radical Biology and Medicine | Oncology | Area Quantification | HALO |
| Maternal Undernutrition Model of Two Generations of Rats: Changes in the Aged Retina | Laurinaviciute G, Simkunaite-Rizgeliene R, Zalgeviciene V, Bartuskiene V, Cepuliene R, Jakimaviciene E, Galgauskas S, Petroska D, Besusparis J, Tutkuviene J | 2022 | Histology and Histopathology | Other | Area Quantification, Multiplex IHC | HALO |
| Tumor cell-derived exosomes deliver TIE2 protein to macrophages to promote angiogenesis in cervical cancer | Du S, Qian J, Tan S, Li W, Liu P, Zhao J, Zeng Y, Xu L, Wang Z, Cai J | 2022 | Cancer Letters | Oncology | Area Quantification, Spatial Analysis | HALO |
| SIGLEC15 amplifies immunosuppressive properties of tumor-associated macrophages in pancreatic cancer | Li, T, Jin K, Li H, Ye L, Li P, Jiang B, Lin X, Liao Z, Zhang H, Shi S, Lin M, Fei Q, Xiao Z, Xu H, Liu L, Yu X, Wu W | 2022 | Cancer Letters | Immuno-oncology | Highplex FL | HALO |
| Positron emission tomography imaging of the sodium iodide symporter senses real-time energy stress in vivo | Dzien P, Mackintosh A, Malviya G, Johnson E, Soloviev D, Brown G, Uribe A, Nixon C, Lyons S, Maddocks O, Blyth K, Lewis D | 2022 | Research Square | Metabolism | Cytonuclear | HALO |
| Th1-involved immune infiltrates improve neoadjuvant chemoradiotherapy response of esophageal squamous cell carcinoma | Yuan J, Weng Z, Tan Z, Luo K, Zhong J, Xie X, Qu C, Lin X, Yang H, Wen J, Fu J | 2022 | Cancer Letters | Immuno-oncology | Multiplex IHC, Spatial Analysis | HALO |
| USP14 promotes tryptophan metabolism and immune suppression by stabilizing IDO1 in colorectal cancer | Shi D, Wu X, Jian Y, Wang J, Huang C, Mo S, Li Y, Li F, Zhang C, Zhang D, Zhang H, Huang H, Chen X, Wang Y, Lin C, Liu G, Song L, Liao W | 2022 | Nature Communications | Oncology, Dermatology | Cytonuclear, Highplex FL | HALO, HALO AI |
| Miz1 promotes KRAS-driven lung tumorigenesis by repressing the protocadherin Pcdh10 | Yang J, Hou C, Wang H, Perez E, Do-Umehara H, Dong H, Arunagiri V, Tong F, Scoyk M, Cho M, Liu X, Ge X, Winn R, Ridge K, Wang X, Chandel N, Liu J | 2022 | Cancer Letters | Oncology | Multiplex IHC | HALO |
| Dapagliflozin reduces the vulnerability of rats with pulmonary arterial hypertension-induced right heart failure to ventricular arrhythmia by restoring calcium handling | Wu J, Liu T, Shi S, Fan Z, Hiram R, Xiong F, Cui B, Su X, Chang R, Zhang W, Yan M, Tang Y, Huang H, Wu G, Guang C | 2022 | Cardiovascular Diabetology | Other | HALO | |
| The SGLT2i Dapagliflozin Reduces RV Mass Independent of Changes in RV Pressure Induced by Pulmonary Artery Banding | Connelly K, Wu E, Visram A, Friedberg M, Batchu S, Yeera V, Thai K, Nghiem L, Zhang Y, Kabir G, Desjardins J, Advani A, Gilbert R | 2022 | Cardiovascular Drugs and Therapy | Other | Area Quantification | HALO |
| Preclinical evaluation of FAP‑2286 for fbroblast activation protein targeted radionuclide imaging and therapy | Zboralski D, Hoehne A, Bredenbeck A, Schumann A, Nguyen M, Schneider E, Ungewiss J, Paschke M, Haase C, von Hacht J, Kwan T, Lin K, Lenore J, Harding T, Xiao J, Simmons A, Mohan A, Beindorff N, Reineke U, Smerling C, Osterkamp F | 2022 | European Journal of Nuclear Medicine and Molecular Imaging | Oncology | HALO | |
| Relaxin/insulin-like family peptide receptor 4 (Rxfp4) expressing hypothalamic neurons Q8 modulate food intake and preference in mice | Lewis J, Woodward O, Nuzzaci D, Smith C, Adriaenssens A, Billing L, Brighton C, Phillips B, Tadross J, Kinston S, Ciabatti E, Gottgens B, Tripodi M, Mornigold D, Baker D, Gribble F, Reimann F | 2022 | Molecular Metabolism | Metabolism | ISH/FISH | HALO |
| Regional epithelial cell diversity in the small intestine of pigs | Wiarda J, Becker S, Sivasankaran S, Loving C, | 2022 | Journal of Animal Science | Gastroenterology | ISH/FISH, Figure Maker | HALO |
| Pharmacological mTOR-inhibition facilitates clearance of AD-related tau aggregates in the mouse brain | Morawe M, Liao F, Amberg W, van Bergeijk J, Chang R, Gulino M, Hamilton C, Hoft C, Lumpkin C, Mastis B, McGlame E, Nuber J, Plaas C, Ravikumar B, Roy K, Schanzenbacher M, Tierno J, Lakics V, Dellovade T, Townsend M | 2022 | European Journal of Pharmacology | Neuroscience | HALO | |
| Epithelial-to-mesenchymal transition promotes immune escape by inducing CD70 in non-small cell lung cancer | Ortiz-Cuaran S, Swalduz A, Foy J, Marteau S, Morel A, Fauvet F, De Souza G, Michon L, Boussageon M, Gadot N, Godefroy M, Leon S, Tortereau A, Mourksi N, Leonce C, Albraret M, Dongre A, Vanbervliet B, Robert M, Tonon L, Pommier R, Hofman V, Attignon V, Boyault S, Audoynaud C, Auclair J, Boquet F, Wang Q, Menetrier-Caux C, Perol M, Caux C, Hofman P, Lantuejoul S, Puisieux A, Saintgny P | 2022 | European Journal of Cancer | Oncology | Cytonuclear | HALO |
| The Novel Gabapentinoid Mirogabalin Prevents Upregulation of α2δ-1 Subunit of Voltage-Gated Calcium Channels in Spinal Dorsal Horn in a Rat Model of Spinal Nerve Ligation | Domon Y, Kobayashi N, Kubota K, Kitano Y, Ueki H, Shimojo Y, Ishikawa K, Ofune Y | 2022 | Drug Research | Neuroscience | Area Quantification | HALO |
| Traumatic Brain Injury Leads to Alterations in Contusional Cortical miRNAs Involved in Dementia | Naseer S, Abelleira-Hervas L, Savani D, de Burgh R, Aleksynas R, Donat C, Syed N, Sastre M | 2022 | Biomolecules | Neuroscience | Microglia | HALO |
| Attenuation of relapsing fever neuroborreliosis in mice by IL-17A blockade | Cheng M, Xu J, Ding K, Liu H | 2022 | Proceedings of the National Academy of Sciences | Infectious Disease | Highplex FL | HALO |
| Cutaneous Lymphocyte Antigen (CLA) is a potential therapeutic target in Cutaneous T Cell Lymphoma | Peru S, Prochazkova-Carlotti M, Cherrier F, Velazquez J, Richard E, Idrissi Y, Cappellen D, Azzi-Martin L, Pham-Ledard A, Beylot-Barry M, Merlio J, Poglio S | 2022 | Journal of Investigative Dermatology | Immuno-oncology | HALO | |
| Single-cell RNA-seq transcriptomic landscape of human and mouse islets and pathological alterations of diabetes | Chen K, Zhang J, Huang Y, Tian X, Yang Y, Dong A | 2022 | iScience | Metabolism | HALO | |
| Proliferative tumor infiltrating lymphocytes abundance within microenvironment impact clinical outcome in cutaneous B-cell lymphomas | Menguy S, Prochazkova-Carolotti M, Azzi-Martin L, Ferte T, Bresson-Bepoldin L, Rey C, Vergier B, Merlio J, Beylot-Barry M, Pham-Ledard A | 2022 | Journal of Investigative Dermatology | Immuno-oncology | Classifier, Highplex FL | HALO |
| Functional Intercellular Transmission of miHTT via Extracellular Vesicles: An In Vitro Proof-of-Mechanism Study | Morais R, Sogorb-Gonzalez M, Bar C, Timmer N, Van der Bent M, Wartel M, Valles A | 2022 | Cells | Neuroscience | Area Quantification | HALO |
| Carbonic anhydrase 14 protects the liver against the cytotoxicity of bile acids in a biliary bicarbonate umbrella-related manner | Qian J, Shen Q, Zhang T, Chen J, Chen L, Dong Y, Yan R, Chen Z | 2022 | Life Sciences | Other | Multiplex IHC | HALO |
| Method To Visualize the Intratumor Distribution and Impact of Gemcitabine in Pancreatic Ductal Adenocarcinoma by Multimodal Imaging | Strittmatter N, Richards F, Race A, Ling S, Sutton D, Nilsson A, Wallez Y, Barnes J, Maglennon G, Gopinathan A, Brais R, Wong E, Serra M, Atkinson J, Smith A, Wilson J, Hamm G, Johnson T, Dunlop C, Kaistha B, Bunch J, Sansom O, Takats Z, Andren P, Lau A, Barry S, Goodwin R, Jodrell D | 2022 | Analytical Chemistry | Oncology | Classifier, Highplex FL | HALO, HALO AI |
| Single-incision cochlear implantation and hearing evaluation in piglets and minipigs | Yildiz E, Gerlitz M, Gadenstaetter A, Landegger L, Nieratschker M, Schum D, Schmied M, Haase A, Kanz F, Kramer A, Glueckert R, Staecker H, Honeder C, Arnoldner C | 2022 | Hearing Research | Neuroscience | HALO | |
| Cholesterol-Conjugated Short-Interfering RNA Silencing Tnf for the Treatment of Liver Macrophage-Mediated Acute Inflammation in Nonalcoholic Fatty Liver Disease | Craig K, Abrams M, Amiji M | 2022 | Nucleic Acid Therapeutics | Metabolism | Area Quantification | HALO |
| Booster Immunization with Ad26.COV2.S or Omicron Adapted Vaccine Enhanced Immune Responses and Efficacy Against SARS-CoV-2 Omicron in Non-Human Primates | Solforosi L, Costes L, Tolboom J, McMahan K, Anioke T, Hope D, Murdza T, Sciacca M, Bouffard E, Barrett J, Wu C, Hachmann N, Miller J, Yu J, He X, Jacob-Dolan C, Huber S, Dekking L, Chamanza R, Choi Y, Feddes-de Boer K, Barouch D, Schuitemaker H, Zahn R, Wegmann F | 2022 | Research Square | Immunology, Infectious Disease | HALO Link | |
| Histopathologic differences in granulomas of Mycobacterium bovis bacille Calmette Guérin (BCG) vaccinated and non-vaccinated cattle with bovine tuberculosis | Kanipe C, Boggiatto P, Putz E, Palmer M | 2022 | Frontiers in Microbiology | Immunology, Infectious Disease | HALO | |
| Deep learning-based quantification of NAFLD/NASH progression in human liver biopsies | Heinemann F, Gross P, Zeveleva S, Qian H, Hill J, Hofer A, Jonigk D, Diehl A, Abdelmalek M, Lenter M, Pullen S, Guarnieri P, Stierstorfer B | 2022 | Scientific Reports | Metabolism | Area Quantification | HALO, HALO AI |
| Dynamin-2 deficiency causes age- and sex-dependent neutropenia and myelodysplasia in mice | Willis A, Corey S, Murga-Zamalloa C, Karimi S, Khaddour K, Quigley J, Eklund E, Chen Y | 2022 | Blood Advances | Other | HALO | |
| Loss of functional System x-c uncouples aberrant postnatal neurogenesis from epileptogenesis in the hippocampus of Kcna1-KO mice | Aloi M, Thompson S, Quartapella N, Noebels J | 2022 | Cell Reports | Neuroscience | ISH-IHC/FISH-IF | HALO |
| Identifying the Ideal Target Vessel Size for Bariatric Embolization: Histologic Analysis of Swine and Human Gastric Fundi | Vairavamurthy J, Yuan F, Anders R, Kraitchman D, Weiss C | 2022 | Journal of Vascular and Interventional Radiology | Other | HALO | |
| Visualization of calcium channel blockers in human adrenal tissues and their possible effects on steroidogenesis in the patients with primary aldosteronism (PA) | Motomura N, Yamazaki Y, Gao X, Tezuka Y, Omata K, Ono Y, Morimoto R, Satoh F, Nakamura Y, Shim J, Choi M, Ito A, Sasano H | 2022 | The Journal of Steroid Biochemistry and Molecular Biology | Metabolism | Cytonuclear | HALO |
| Glutaminase 2 Knockdown Reduces Hyperammonemia and Associated Lethality of Urea Cycle Disorder Mouse Model | Mao X, Chen H, Lin A, Kim S, Burczynski M, Na E, Halasz G, Sleeman M, Murphy A, Okamoto H, Cheng X | 2022 | Journal of Inherited Metabolic Disease | Metabolism | Area Quantification, ISH/FISH | HALO |
| Xiaoyaosan ethyl acetate fraction alleviates depression-like behaviors in CUMS mice by promoting hippocampal neurogenesis via modulating the IGF-1Rβ/PI3K/Akt signaling pathway | Zeng J, Ji Y, Luan F, Hu J, Rui Y, Liu Y, Rao Z, Liu R, Zeng N | 2022 | Journal of Ethnopharmacology | Neuroscience | Highplex FL | HALO |
| What Happens to the Preserved Renal Parenchyma After Clamped Partial Nephrectomy? | Xiong L, Nguyen J, Peng Y, Zhou Z, Ning K, Jia N, Nie J, Wen D, Wu Z, Roversi G, Palacios D, Abramczyk E, Munoz-Lopez C, Campbell J, Cao Y, Li Wencai, Zhang X, He Z, Li X, Huang J, Shou J, Wu J, Chen M, Chen X, Zheng J, Xu C, Zhong W, Li Z, Dong W, Zhou J, Zhang H, Luo J, Liu J, Sun G, Han H, Guo S, Dong P, Zhou F, Yu C, Campbell S, Zhang Z | 2022 | European Urology | Other | HALO | |
| Micellar nanoparticles inhibit the postoperative inflammation, recurrence and pulmonary metastasis of 4T1 breast cancer by blocking NF-κB pathway and promoting MDSCs depletion | Lu Z, Ma L, Mei L, Ren K, Li M, Zhang L, Liu X, He Q | 2022 | International Journal of Pharmaceutics | Immuno-oncology | Area Quantification | HALO |
| Retrospective analysis of the efficacy of adjuvant cytokine-induced killer cell immunotherapy combined with chemotherapy in colorectal cancer patients after surgery | Li X, Zhou H, Huang W, Wang X, Meng M, Hou Z, Liao L, Tang W, Xie Y, Wang R, Yu H, Wang L, Zhu H, Wang W, Tan J, Li R | 2022 | Clinical & Translational Immunology | Oncology | HALO | |
| Defects in NLRP6, autophagy and goblet cell homeostasis are associated with reduced duodenal CRH receptor 2 expression in patients with functional dyspepsia | Bruce J, Burns G, Soh W, Nair P Sherwin S, Fan K, Dowling L, Goggins B, Koloski N, Potter M, Bollipo S, Foster R, Gan L, Veysey M, Philpott D, Girardin S, Holtmann G, Kaiko G, Walker M, Talley N, Keely S | 2022 | Brain, Behavior, and Immunity | Metabolism | Area Quantification | HALO |
| Ex vivo enzymatic treatment converts blood type A donor lungs into universal blood type lungs | Wang A, Ribeiro R, Ali A, Brambate E, Abdelnour-Berchtold E, Michaelsen V, Zhang Y, Rahfeld P, Moon H, Gokhale H, Gazzalle A, Pal P, Liu M, Waddell T, Cserti-Gadewich C, Tinckam K, Kizhakkedathu J, West L, Keshavjee S, Withers S, Cypel M | 2022 | Science Translational Medicine | Other | Area Quantification, Cytonuclear | HALO |
| Evaluating changes in GABAergic and glutamatergic pathways in early life following prenatal stress and postnatal neurosteroid supplementation | Crombie G, Palliser H, Shaw J, Hodgson D, Walkder D, Hirst J | 2022 | Psychoneuroendocrinology | Neuroscience | Multiplex IHC | HALO |
| Combined Blockade of GARP:TGF-β1 and PD-1 Increases Infiltration of T Cells and Density of Pericyte-Covered GARP+ Blood Vessels in Mouse MC38 Tumors | Bertrand C, Van Meerbeeck P, de Streel G, Vaherto-Bleeckx N, Benhaddi F, Rouaud L, Noel A, Coulie P, van Baren N, Lucas S | 2022 | Frontiers in Immunology | Immuno-oncology | Cytonuclear, Object Colocalization | HALO |
| Adolescent intermittent ethanol exposure produces Sex-Specific changes in BBB Permeability: A potential role for VEGFA | Vore A, Barney T, Deak M, Varlinskaya E, Deak T | 2022 | Brain, Behavior, and Immunity | Neuroscience | ISH/FISH | HALO |
| Association between mitochondrial and nuclear DNA damages and cellular senescence in the patients with biliary atresia undergoing Kasai portoenterostomy and liver transplantation | Nakajima Y, Yamazaki Y, Gao X, Hashimoto M, Nio M, Wada M, Fujishima F, Sasano H | 2022 | Medical Molecular Morphology | Gastroenterology | Multiplex IHC | HALO |
| Crocin alleviates cognitive impairment associated with atherosclerosis via improving neuroinflammation in LDLR−/− mice fed a high-fat/cholesterol diet | Song R, Han S, Gao H, Jiang H, Li X | 2022 | Phytotherapy Research | Neuroscience | Area Quantification | HALO |
| Bone quality and composition are influenced by egg production, layer line, and estradiol-17ß in laying hens | Eusemann B, Ulrich R, Sacnhez-Rodriquez E, Benavides-Reyes C, Dominguez-Gasca, Rodriguez-Navarro A, Petow S | 2022 | Avian Pathology | Other | Classifier | HALO |
| Inflammatory Monocytes Promote Granuloma-Mediated Control of Persistent Salmonella Infection | Bettke J, Tam J, Montoya V, Butler B, vander Velden A | 2022 | Infection and Immunity | Infectious Disease | Classifier, Area Quantification | HALO |
| Intratumoural spatial distribution of S100B + folliculostellate cells is associated with proliferation and expression of FSH and ERα in gonadotroph tumours | Ilie M, Vasiljevic A, Chanal M, Gadot N, Chinezu L, Jouanneau E, Hennino A, Raverot G, Bertolino P | 2022 | Acta Neuropathologica Communications | Oncology | Cytonuclear, Spatial Analysis | HALO |
| Anatomic and functional mapping of human uterine innervation | Pinsard M, Mouchet N, Dion L, Bessede T, Bertrand M, Darai E, Bellaud P, Loget P, Mazaud-Guittot S, Morandi X, Leveque J, Lavoue V, Duraes M, Timoh K | 2022 | Fertility and Sterility | Other | HALO | |
| DS-7300a, a DNA Topoisomerase I Inhibitor, DXd-based Antibody-Drug Conjugate 2 Targeting B7-H3 Exerts Potent Antitumor Activities in Preclinical Models | Yamato M, Hasegawa J, Maejima T, Hattori C, Kumagai K, Watanabe A, Nishiya Y, Shibutani T, Aida T, Hayakawa I, Nakada T, Abe Y, Agatsuma T | 2022 | Molecular Cancer Therapeutics | Oncology | HALO | |
| Unchecked oxidative stress in skeletal muscle prevents outgrowth of disseminated tumour cells | Crist S, Nemkov T, Dumpit R, Dai J, Tapscott S, True L, Swarbrick A, Sullivan L, Nelson P, Hansen K, Ghajar C | 2022 | Nature Cell Biology | Myology | Registration | HALO |
| In vitro cell cultures of Brunner's glands from male mouse to study GLP-1 receptor function | Voetmann L, Underwood C, Rolin B, Hansen A, Kirk R, Pyke C, Knudsen L, Frederiksen K | 2022 | Methods in Cell Physiology | Gastroenterology | Multiplex IHC | HALO |
| Reduced SARS-CoV-2 disease outcomes in Syrian hamsters receiving immune sera: Quantitative image analysis in pathologic assessments | Pieda-Mora C, Robinson S, Tostanoski L, Dayao D, Chandrashekar A, Bauer K, Wrijil L, Ducat S, Hayes T, Yu J, Bondzie E, McMahan K, Sellers D, Giffin V, Hope D, Nampanya F, Mercado N, Kar S, Andersen H, Tzipori S, Barouch D, Martinot A | 2022 | Veterinary Pathology | Infectious Disease, Other | Classifier, Multiplex IHC | HALO |
| Circulating C-Peptide Levels in Living Children and Young People and Pancreatic Beta Cell Loss in Pancreas Donors Across Type 1 Diabetes Disease Duration | Carr A, Inshaw J, Flaxman C, Leete P, Wyatt R, Russell L, Palmer M, Prasolov D, Worthington T, Hull B, Wicker L, Dunber D, Oram R, Morgan N, Toss J, Richardson S, Besser | 2022 | Diabetes | Metabolism | Classifier | HALO, HALO AI |
| GPNMB expression identifies TSC1/2/mTOR-associated and MiT family translocation-driven renal neoplasms | Salles D, Asrani K, Woo J, Vidotto T, Liu H, Vidal I, Matoso A, Netto G, Argani P, Lotan T | 2022 | The Journal of Pathology | Oncology | Membrane | HALO |
| A molecular analysis of neural olfactory placode differentiation in human pluripotent stem cells | Bricker R, Bhaskar U, Titone R, Carless M, Barberi T | 2022 | Stem Cells and Development | Other | Highplex FL, Figure Maker | HALO |
| Aberrant inflammation in rat pregnancy leads to cardiometabolic alterations in their offspring and intrauterine growth restriction in the F2 generation | Ushida T, Cotechini T, Protopapas N, Atallah A, Collyer C, Toews A, Maconald-Goodfellow S, Tse M, Winn L, Pang S, Adams M, Othman M, Kotani T, Kajiyama H, Graham C | 2022 | Journal of Developmental Origins of Health and Disease | Metabolism, Other | Multiplex IHC | HALO |
| Presence of Tim3+ and PD-1+ CD8+ T cells identifies microsatellite stable colorectal carcinomas with immune exhaustion and distinct clinicopathological features | Klapholz M, Drage M, Srivastava A, Anderson A | 2022 | The Journal of Pathology | Oncology | Multiplex IHC, Highplex FL | HALO |
| Relationship between impaired BMP signalling and clinical risk factors at early-stage vascular injury in the preterm infant | Heydarian M, Oak P, Zhang X, Kamgari N, Kindt A, Koschlig M, Pritzke T, Gonzalez-Rodriguez E, Forster K, Morty R, Hafner F, Hubener C, Flemmer A, Yildirim A, Sudheendra D, Tian X, Petrera A, Kirsten H, Ahnert P, Morrell N, Desai T, Sucre J, Spiekerkoetter E, Hilgendorff A | 2022 | Thorax | Other | ISH/FISH | HALO |
| Periostin- and podoplanin- positive cancer-associated fibroblast subtypes cooperate to shape the inflamed tumor microenvironment in aggressive pancreatic adenocarcinoma | Neuzillet C, Nicolle R, Raffenne J, Tijeras-Raballand A, Brunel A, Astorgues-Xerri L, Vacher S, Arbateraz F, Fanjul M, Hilmi M, Samain R, Klein C, Perraud A, Rebours V, Mathonnet M, Bieche I, Kocher H, Cros J, Bousquet C | 2022 | Journal of Pathology | Oncology | Area Quantification | HALO |
| The potassium channel auxiliary subunit Kvβ2 (Kcnab2) regulates Kv1 channels and dopamine neuron firing | Yee J, Rastani A, Soden M | 2022 | Journal of Neurophysiology | Neuroscience | ISH-IHC/FISH-IF | HALO |
| High-strength biodegradable zinc alloy implants with antibacterial and osteogenic properties for the treatment of MRSA-induced rat osteomyelitis | Jia B, Zhang Z, Zhuang Y, Yang H, Han Y, Wu Q, Jia X, Yin Y, Qu X, Zheng Y, Dai K | 2022 | Biomaterials | Biomaterials | Multiplex IHC | HALO |
| EBV+ tumors exploit tumor cell-intrinsic and -extrinsic mechanisms to produce regulatory T cell-recruiting chemokines CCL17 and CCL22 | Jorapur A, Marshall L, Jacobson S, Xu M, Marubayashi S, Zibinsky M, Hu D, Robles O, Jackson J, Baloche V, Busson P, Wustrow D, Brockstedt D, Talay O, Kassner P, Cutler G | 2022 | PLOS Pathogens | Oncology | ISH/FISH | HALO |
| Phenotype-genotype correlation in aldosterone-producing adenomas characterized by intracellular cholesterol metabolism | Harashima S, Yamazaki Y, Motomura N, Ono Y, Omata K, Tezuka Y, Morimoto R, Nakamura Y, Satoh F, Suzuki H, Kwon G, Choi M, Sasano H | 2022 | The Journal of Steroid Biochemistry and Molecular Biology | Oncology, Metabolism | Area Quantification, Membrane | HALO |
| Spatiotemporal expression pattern of Progesterone Receptor Component (PGRMC) 1 in endometrium from patients with or without endometriosis or adenomyosis | Thieffry C, Van Wynendaele M, Samain L, Tyteca D, Pierreux C, Marbaix E, Henriet P | 2022 | The Journal of Steroid Biochemistry and Molecular Biology | Other | Highplex FL | HALO |
| Quantitative Imaging Analysis of the Spatial Relationship between Antiretrovirals, Reverse Transcriptase Simian-Human Immunodeficiency Virus RNA, and Fibrosis in the Spleens of Nonhuman Primates | Devanathan A, White N, Desyaterik Y, De la Cruz G, Nekorchuk M, Terry M, Busman-Sahay K, Adamson L, Luciw P, Fedoriw Y, Estes J, Rosen E, Kashuba A | 2022 | Antimicrobial Agents and Chemotherapy | Infectious Disease | ISH/FISH | HALO |
| Targeted RNA editing in brainstem alleviates respiratory dysfunction in a mouse model of Rett syndrome | Sinnamon J, Jacobson M, Yung J, Mandel G | 2022 | Proceedings of the National Academy of Sciences | Neuroscience | Highplex FL | HALO |
| Autophagy-mediated NCOR1 degradation is required for brown fat maturation and thermogenesis | Sabate-Perez A, Romero M, Sanchez-Fernandez-de-Landa P, Carobbio S, Mouratidis M, Sala D, Engel P, Villena J, Virtue S, Vidal-Puig A, Palacin M, Testar X, Zorzano A | 2022 | Autophagy | Metabolism | Highplex FL | HALO, HALO AI |
| Allogeneic cord blood regulatory T cells can resolve lung inflammation | Lyu M, Huang M, Zeng K, Li L, Khoury J, Nishimoto M, Ma H, Sadeghi T, Mukherjee S, Slutsky A, Flowers C, Parmar S | 2022 | Cytotherapy | Immunology | Multiplex IHC | HALO |
| Atypical chemokine receptor 3 induces colorectal tumorigenesis in mice by promoting β-arrestin-NOLC1-fibrillarin-dependent rRNA biogenesis | Yang J, Miao R, Li Y, Pan T, Wu S, Qu X, Cui S | 2022 | Acta Pharmacologica Sinica | Oncology | Area Quantification | HALO |
| Molecular identification of spatially distinct anabolic responses to mechanical loading in murine cortical bone | Chlebek C, Moore J, Ross F, van der Meulen M | 2022 | Journal of Bone and Mineral Research | Other | ISH/FISH | HALO |
| Immunologic Gene Signature Analysis Correlates Myeloid Cells and M2 Macrophages with Time to Trabectedin Failure in Sarcoma Patients | Schroder B, Zhang Y, Smythe K, Desai P, Thomas A, Viveiros P, Alexiev B, Obeidin F, Chen E, Cranmer L, Wagner M, Jones R, Campbell J, Pierce R, He Q, Pollack S | 2022 | Cancers | Oncology | HALO | |
| Interspatial Distribution of Tumor and Immune Cells in Correlation with PD-L1 in Molecular Subtypes of Gastric Cancers | Dislich B, Mertz K, Gloor B, Langer R | 2022 | Cancers | Immuno-oncology | Multiplex IHC, Spatial Analysis, Figure Maker | HALO |
| Pilot Trial of Arginine Deprivation Plus Nivolumab and Ipilimumab in Patients with Metastatic Uveal Melanoma | Kraehenbuehl L, Holland A, Armstrong E, O'Shea S, Mangarin L, Chekalil S, Johnston A, Bomalaski J, Erinjeri J, Barker C, Francis J, Wolchok J, Merghoub T, Shoushtari A | 2022 | Cancers | Oncology | Cytonuclear, Highplex FL | HALO |
| Human Intestinal Myofibroblasts DepositED COLLAGEN VI EnhanceS Adhesiveness for T cells - A Novel Mechanism for Maintenance of Intestinal Inflammation. | Lin S, Musso A, Wang J, Mukherjee P, West G, Mao R, Lyu R, Li J, Zhao S, Elias M, Haberman Y, Denson L, Kugathasan S, Chen M, Czarnecki D, Dejanovic D, Le H, Chandra J, Lipman J, Steele S, Nguyen Q, Fiocchi C, Rieder F | 2022 | Matrix Biology | Immunology, Other | HALO | |
| Impact of Physiologically Relevant Genistein Exposure at Different Time Windows on Puberty Onset and Neuroendocrine Function in Female Rats | Xiong J, Tian Y, Ma G, Wang X, Shan S, Cheng G | 2022 | Molecular Nutrition & Food Research | Other | Area Quantification | HALO |
| Deep Learning Facilitates Distinguishing Histologic Subtypes of Pulmonary Neuroendocrine Tumors on Digital Whole-Slide Images | Ilie M, Benzaquen J, Tourniaire P, Heeke S, Ayache N, Delingette H, Long-Mira E, Lassalle S, Hamila M, Fayada J, Otto J, Cohen C, Gomez-Caro A, Berthet J, Marquette C, Hofman V, Bontoux C, Hofman P | 2022 | Cancers | Oncology | HALO, HALO AI | |
| Sex-specific effects of ethanol consumption in older Fischer 344 rats on microglial dynamics and Aβ(1-42) accumulation | Marsland P, Vore A, DaPrano E, Paluch J, Blackwell A, Varlinskaya E, Deak T | 2022 | Alcohol | Neuroscience | ISH/FISH | HALO |
| Hyperpolarized 13C-Pyruvate Metabolism as a Surrogate for Tumor Grade and Poor Outcome in Renal Cell Carcinoma—A Proof of Principle Study | Ursprung S, Woitek R, McLean M, Priest A, Crispin-Ortuzar M, Brodie C, Gill A, Gehrung M, Beer L, Riddick A, Field-Rayner J, Grist J, Deen S, Riemer F, Kaggie J, Zaccagna F, Duarte J, Locke M, Frary A, Aho T, Armitage J, Casey R, Mendichovszky I, Welsh S, Barrett T, Graves M, Eisen T, Mitchell T, Warren A, Brindle K, Sala E, Stewart G, Gallagher F | 2022 | Cancers | Oncology | Area Quantification | HALO |
| Ghrelin May Inhibit Inflammatory Response and Apoptosis During Ischemia-Reperfusion Injury | Fukunaga N, Ribeiro R, Bissoondath V, Billia F, Rao V | 2022 | Transplantation Proceedings | Other | Multiplex IHC | HALO |
| Estrogen receptor beta activity contributes to both tumor necrosis factor alpha expression in the hypothalamic paraventricular nucleus and the resistance to hypertension following angiotensin II in female mice | Woods C, Contoreggi N, Johnson M, Milner T, Wang G, Glass M, | 2022 | Neurochemistry International | Neuroscience | ISH/FISH | HALO |
| Use of High-Plex Data Reveals Novel Insights into the Tumour Microenvironment of Clear Cell Renal Cell Carcinoma | De Filippis R, Wolflein G, Um I, Caie P, Warren S, White A, Suen E, To E, Arandjelovic O, Harrison D | 2022 | Cancers | Oncology | Spatial Analysis | HALO, HALO AI |
| Mouse organoids as an in vitro tool to study the in vivo intestinal response to cytotoxicants | Jardi F, Kelly C, Teague C, Fowler-Williams H, Sevin D, Rodrigues D, Jo H, Ferreira S, Herpers B, Van Heerden M, de Kok T, Pin C, Lynch A, Duckworth C, De Jonghe S, Lammens L, Pritchard D | 2022 | Archives of Toxicology | Toxicology | Multiplex IHC | HALO |
| Low CD8 T Cell Counts Predict Benefit from Hypoxia-Modifying Therapy in Muscle-Invasive Bladder Cancer | Smith V, Mukherjee D, Tsakiroglou A, Baker A, Mistry H, Choudhury A, Hoskin P, Illidge T, West C | 2022 | Cancers | Immuno-oncology | TMA | HALO |
| Angiotensin II Infusion Results in Both Hypertension and Increased AMPA GluA1 Signaling in Hypothalamic Paraventricular Nucleus of Male but not Female Mice | Wang G, Woods C, Johnson M, Milner T, Glass M | 2022 | Neuroscience | Neuroscience | ISH/FISH | HALO |
| Gasdermin D maintains bone mass by rewiring the endo-lysosomal pathway of osteoclastic bone resorption | Li M, Yang D, Yan H, Tang Z, Jiang D, Zhang J, Chi Z, Nie W, Zhen W, Yu W, Chen S, Wang Z, Yu Q, Zhang X, Yang F, Fan S, Lin X, Wang D | 2022 | Developmental Cell | Other | Area Quantification, Multiplex IHC | HALO |
| Evolutionary trajectory of receptor binding specificity and promiscuity of the spike protein of SARS-CoV-2 | Planchais C, Reyes-Ruiz A, Lacombe R, Zarantonello A, Lecerf M, Revel M, Roumenina L, Atanasov B, Mouquet H, Dimitrov J | 2022 | Protein Science | Infectious Disease | Area Quantification | HALO |
| Novel post-acquisition image processing to attenuate red blood cell autofluorescence for quantitative image analysis | Bouffard N, Lee K, DeLance N, Clason T, Chatterjee N, Taatjes D | 2022 | Histochemistry and Cell Biology | Other | Highplex FL | HALO |
| Landscape of cancer-associated fibroblasts identifies the secreted biglycan as a protumor and immunosuppressive factor in triple-negative breast cancer | Zheng S, Zou Y, Tang Y, Yang A, Liang J, Wu L, Tian W, Xiao W, Xie X, Yang L, Xie J, Wei W, Xie X | 2022 | OncoImmunology | Immuno-oncology | HALO | |
| Angiogenesis modulation-mediated inhibitory effects of tacrolimus on hypertrophic scar formation | Shen Y, Jin R, Liang X, Deng Z, He J, Ding Y, Ding F, Lu L, Liu F, Yang J | 2022 | Microvascular Research | Dermatology | Highplex FL | HALO |
| An Fc-inert PD-L1×4-1BB bispecific antibody mediates potent anti-tumor immunity in mice by combining checkpoint inhibition and conditional 4-1BB co-stimulation | Muik A, Altintas I, Gieseke F, Schoedel K, Burm S, Toker A, Salcedo T, Verzijl, Eisel D, Grunwitz C, Kranz L, Vormehr M, Satijn D, Diken M, Kreiter S, Sasser K, Ahmadi T, Tureci O, Breij E, Jure-Kunkel M, Sahin U | 2022 | OncoImmunology | Immuno-oncology | Area Quantification, Immune, Multiplex IHC | HALO |
| Cell-specific dysregulation of iron and oxygen homeostasis as a novel pathophysiology in PSP | Lee S, Martinez-Valbuena I, de Andrea C, Villalba-Esparza M, Ilaalagan S, Couto B, Visanji N, Lang A, Kovacs G | 2022 | Annals of Neurology | Neuroscience | Area Quantification | HALO |
| The PSEN1 E280G mutation leads to increased amyloid-43 production in induced pluripotent stem cell neurons and deposition in brain tissue | Willumsen N, Arber C, Lovejoy C, Toombs J, Alatza A, Weston P, Chavez-Gutierrez L, Hardy J, Zetterberg H, Fox N, Ryan N, Lashley T, Wray S | 2022 | Brain Communications | Neuroscience | Area Quantification | HALO |
| Differential expression of CCR8 in tumors versus normal tissue allows specific depletion of tumor-infiltrating T regulatory cells by GS-1811, a novel Fc-optimized anti-CCR8 antibody | Weaver J, Stack E, Bugge J, Hu C, McGrath L, Mueller A, Wong M, Klebanov B, Rahman T, Kaufman R, Fregeau C, Spaulding V, Priess M, Legendre K, Jaffe S, Upadhyay D, Singh A, Xu C, Krukenberg K, Zhang Y, Ezzyat Y, Axe D, Kuhne M, Meehl M, Shaffer D, Weist B, Wiederschain D, Depis F, Gostissa M | 2022 | Oncoimmunology | Immuno-oncology | Cytonuclear | HALO |
| Epigallocatechin-3-gallate reduces neutrophil extracellular trap formation and tissue injury in severe acute pancreatitis | Li H, Qiao C, Zhao L, Jing Q, Xue D, Zhang Y | 2022 | Journal of Leukocyte Biology | Immunology | Highplex FL | HALO |
| Mouse fetal growth restriction through parental and fetal immune gene variation and intercellular communications cascade | Kaur G, Porter C, Ashenberg O, Lee J, Riesenfeld S, Hofree M, Aggelakopoulou M, Subramanian A, Kuttikkatte S, Attfield K, Desel C, Davies J, Evans H, Avraham-Davidi I, Nguyen L, Dionne D, Neumann A, Jensen L, Barber T, Soilleux E, Carrington M, McVean G, Rozenblatt-Rosen O, Regev A, Fugger L | 2022 | Nature Communications | Other | ISH/FISH, Multiplex IHC | HALO, HALO Link, Pharma Services |
| A noninvasive iRFP713 p53 reporter reveals dynamic p53 activity in response to irradiation and liver regeneration in vivo | Humpton T, Hock A, Kiourtis C, De Donatis, Fercoq F, Nixon C, Bryson S, Strathdee D, Carlin L, Bird T, Blyth K, Vousden K | 2022 | Science Signaling | Other | Cytonuclear | HALO |
| Soluble TREM2 induces microglia dysfunction and brain damage while cleavage-reduced TREM2 shows sustained microglia activation with enhanced remyelination in the cuprizone model | Beckmann N, Neuhaus A, Zurbruegg S, Joller S, Feuerbach D, Doelemeyer A, Schweizer T, Rudin S, Nuemann U, Berth R, Frieauff W, Gasparani F, Shimshek D | 2022 | Research Square | Neuroscience | HALO | |
| The Association of Cholesterol Uptake and Synthesis with Histology and Genotype in Cortisol-Producing Adenoma (CPA) | Motomura N, Yamazaki Y, Koga D, Harashima S, Gao X, Tezuka Y, Omata K, Ono Y, Morimoto R, Satoh F, Nakamura Y, Kwon G, Choi M, Ito A, Sasano H | 2022 | International Journal of Molecular Sciences | Oncology | Area Quantification, Cytonuclear, Membrane | HALO |
| Industrialized, Artificial Intelligence-guided Laser Microdissection for Microscaled Proteomic Analysis of the Tumor Microenvironment | Mitchell D, Hunt A, Conrads K, Hood B, Makohon-Moore S, Rojas C, Maxwell G, Bateman N, Conrads T | 2022 | JOVE | Other | Classifier | HALO |
| MGAT2 inhibitor decreases liver fibrosis and inflammation in murine NASH models and reduces body weight in human adults with obesity | Cheng D, Zinker B, Luo Y, Shipkova P, De Oliveira C, Krishna G, Brown E, Boehm S, Tirucherai G, Gu H, Ma Z, Chu C, Onorato J, Kopcho L, Ammar R, Smith J, Devasthale P, Lawrence R, Stryker S, Dierks E, Azzara A, Carayannopoulos L, Charles E, Lentz K, Gordon D | 2022 | Cell Metabolism | Metabolism | Area Quantification | HALO |
| Non-coding variants disrupting a tissue-specific regulatory element in HK1 cause congenital hyperinsulinism | Wakeling M, Owens N, Hopkinson J, Johnson M, Houghton J, Dastamani A, Flaxman C, Wyatt R, Hewat T, Hopkins J, Laver T, Van Heugten R, Weedon M, De Franco E, Patel K, Ellard S, Morgan N, Cheesman E, Banerjee I, Hattersley A, Dunne M, International Congenital Hyperinsulinism Consortium, Richardson S, Flanagan S | 2022 | Nature Genetics | Metabolism | Classifier, Highplex FL | HALO, HALO AI |
| Therapeutic impact of BET inhibitor BI 894999 treatment: backtranslation from the clinic | Tontsch-Grunt U, Traexler P, Baum A, Musa H, Marzin K, Wang S, Trapani F, Engelhardt H, Solca F | 2022 | British Journal of Cancer | Oncology | Classifier | HALO |
| Non-canonical EphA2 activation underpins PTEN-mediated metastatic migration and poor clinical outcome in prostate cancer | Sachdeva A, Hart C, Kim K, Tawadros T, Oliveira P, Shanks J, Brown M, Clarke N | 2022 | British Journal of Cancer | Oncology | HALO | |
| Impacts of neoadjuvant chemoradiotherapy on the immune landscape of esophageal squamous cell carcinoma | Wen J, Fang S, Hu Y, Xi M, Weng Z, Pan C, Luo K, Ling Y, Lai R, Xie X, Lin X, Lin T, Chen J, Liu Q, Fu J, Yang H | 2022 | EBioMedicine | Immuno-oncology | HALO | |
| Abundant co-pathologies of polyglucosan bodies, frontotemporal lobar degeneration with TDP-43 inclusions, and ageing-related tau astrogliopathy in a family with a GBE1 mutation | Uemura M, Suh E, Robinson J, Brunden K, Grossman M, Irwin D, Lee V, Trojanowski J, Lee E, Van Deerlin V | 2022 | Neuropathology and Applied Neurobiology | Neuroscience | HALO | |
| The mechanistic and structural role of von Willebrand factor in endotoxemia-enhanced deep vein thrombosis in mice | Choi S, Dwyer C, Rapkin L, Cormier M, Hindmarch C, Nesbitt K, Michels A, Hopman W, Swystun L, Lillicrap D | 2022 | Journal of Thrombosis and Haemostasis | Other | Classifier | HALO |
| Yak DEFB124 alleviates intestinal injury caused by Staphylococcus aureus infection | Zhang L, Mei Q, Wang L, Guan J, Cao W, Hong N | 2022 | International Immunopharmacology | Infectious Disease | Area Quantification | HALO |
| Spatial transcriptome of a germinal center plasmablastic burst hints at MYD88/CD79B mutants-enriched diffuse large B-cell lymphomas | L'Imperio V, Morello G, Vegliante M, Cancila V, Bertolazzi G, Mazzara S, Belmonte B, Mangogna A, Balzarini P, Corral L, Lopez G, Di Napoli A, Facchetti F, Pagni F, Tripodo C | 2022 | European Journal of Immunology | Oncology | HALO | |
| Murine fecal microbiota transfer models selectively colonize human microbes and reveal transcriptional programs associated with response to neoadjuvant checkpoint inhibitors | Shaikh F, Gills J, Mohammad F, White J, Stevens C, Ding H, Fu J, Tam A, Blosser R, Domingue J, Larman T, Chaft J, Spicer J, Reuss J, Naidoo J, Forde P, Ganguly S, Housseau F, Pardoll D, Sears C | 2022 | Cancer Immunology, Immunotherapy | Immuno-oncology | Multiplex IHC | HALO |
| Characterization of anti-CD79b/CD3 bispecific antibody, a potential therapy for B cell malignancies | Wang J, Li C, He K, Kuang Z, Lu J, Yao Y, He F, Li N, Li L, Fu F, Wu Z, Zhou S, Kang D, Qiu X, Wu M, Liu Y, Cao X, Xu M, Chen B, Wu W, Guo F | 2022 | Cancer Immunology, Immunotherapy | Immuno-oncology | Highplex FL | HALO |
| Oct4 promoted proliferation, migration, invasion, and epithelial-mesenchymal transition (EMT) in colon cancer cells by activating the SCF/c-Kit signaling pathway | Bu X, Liu Y, Wang L, Yan Z, Xin G, Su W | 2022 | Cell Cycle | Oncology | Multiplex IHC | HALO |
| Senescence-Associated Molecules and Tumor-Immune-Interactions as Prognostic Biomarkers in Colorectal Cancer | Kellers F, Fernandez A, Konykiewitz B, Schindeldecker M, Tagscherer K, Heintz A, Jesinghaus M, Roth W, Foersch S | 2022 | Frontiers in Medicine | Oncology | Classifier | HALO |
| Associations between quantitative measures of TDLU involution and breast tumor molecular subtypes among breast cancer cases in the Black Women’s Health Study: a case–case analysis | Lynn B, Lord B, Cora R, Pfeiffer R, Lawrence S, Zirpoli G, Bethea T, Palmer J, Gierach G | 2022 | Breast Cancer Research | Oncology | HALO Link | |
| Loss of ubiquitin-specific peptidase 18 destabilizes 14-3-3ζ protein and represses lung cancer metastasis | Chen Z, Zheng L, Chen Y, Liu X, Kawakami M, Mustachi L, Roszik J, Ferry-Galow K, Parchment R, Liu X, Andresson T, Duncan G, Kurie J, Rodriguez-Canales J, Liu X, Dmitrovsky E | 2022 | Cancer Biology & Therapy | Oncology | Classifier, Cytonuclear | HALO |
| An In Vivo Model of Human Macrophages in Metastatic Melanoma | Voillet V, Berger T, McKenna K, Paulson K, Tan W, Smythe K, Hunter D, Valente W, Weaver S, Campbell J, Kim T, Byrd D, Bielas J, Pierce R, Chapuis A, Gottardo R, Rongvaux | 2022 | The Journal of Immunology | Oncology, Immuno-oncology | Multiplex IHC | HALO |
| Ginkgo Biloba Extract Reduces Cardiac and Brain Inflammation in Rats Fed a HFD and Exposed to Chronic Mental Stress through NF-κB Inhibition | Zhang L, Li G, Tao S, Xia P, Chaudhry N, Kaura S, Stone S, Liu M | 2022 | Mediators of Inflammation | Immunology | HALO | |
| Immune cells in mesothelioma microenvironment simplistic marker of response to nivolumab plus ipilimumab | Disselhorst M, Lubeck Y, van der Noort V, Quispel-Janssen J, Seignette I, Sanders J, Peters D, Hooijberg E, Baas P | 2022 | Lung Cancer | Oncology | Multiplex IHC, Registration | HALO |
| TIE2-high cervical cancer cells promote tumor angiogenesis by upregulating TIE2 and VEGFR2 in endothelial cells | Tan S, Chen Y, Du S, Li W, Liu P, Zhao J, Yang P, Cai J, Gao R, Wang Z | 2022 | Translational Oncology | Oncology | Area Quantification | HALO |
| gp96 Expression in Gliomas and Its Association with Tumor Malignancy and T Cell Infiltrating Level | Li C, Wang Y, Long L, Zhang P, Zhang Y, Ji N | 2022 | Hindawi Journal of Oncology | Immuno-oncology | Spatial Analysis, Highplex FL, Figure Maker | HALO |
| Multiplex Immunohistochemical Phenotyping of T Cells in Primary Prostate Cancer | Ozbek B, Ertunc O, Erickson A, Vidal I, Gomes-Alexandre C, Guner G, Hicks J, Jones T, Taube J, Sfanos K, Yegnasubramanian S, DeMarzo A | 2022 | The Prostate | Immuno-oncology | Classifier, Serial Section, Registration, Figure Maker | HALO |
| Localization of macrophage subtypes and neutrophils in the prostate tumor microenvironment and their association with prostate cancer racial disparities | Maynard J, Godwin T, Lu J, Vidal I, Lotan T, De Marzo A, Joshu C, Sfanos K | 2022 | The Prostate | Oncology | HALO | |
| Tumor immune cell clustering and its association with survival in African American women with ovarian cancer | Wilson C, Soupir A, Thapa R, Creed J, Nguyen J, Segura C, Gerke T, Schildkraut J, Peres L, Fridley B | 2022 | PLOS Computational Biology | Immuno-oncology | HALO | |
| Comparative analysis of the immune response to RFA and cryoablation in a colon cancer mouse model | Mauda-Havakuk M, Hawken N, Owen J, Mikhail A, Saxena A, Karim B, Wakim P, Pritchard W, Karanian J, Wood B | 2022 | Scientific Reports | Oncology | Cytonuclear | HALO |
| SPOP promotes cervical cancer progress by inducing PD-1 move away from PD-L1 in spatial localization | Wu J, Wu Y, Guo Q, Chen S, Wang S, Zhu J, Wu X, Ju X | 2022 | Journal of Translational Medicine | Oncology | Spatial Analysis | HALO |
| Integrated Analysis Of Immunotherapy Treated Clear Cell Renal Cell Carcinomas: An Exploratory Study | Sobottka B, Nienhold R, Nowak M, Hench J, Haeuptle P, Frank A, Sachs M, Kahraman A, Moch H, Koelzer V, Mertz K | 2022 | Journal of Immunotherapy | Immuno-oncology | Figure Maker | HALO, HALO AI |
| The Multi-Kinase Inhibitor Lucitanib Enhances the Antitumor Activity of Coinhibitory and Costimulatory Immune Pathway Modulators in Syngeneic Models | Robillard L, Liao M, Nguyen M, Harding T, Simmons A, Dusek R | 2022 | Journal of Immunotherapy | Immuno-oncology | Cytonuclear | HALO |
| Automated Cancer Diagnostics via Analysis of Optical and Chemical Images by Deep and Shallow Learning | Isberg O, Giunchiglia V, McKenzie J, Takats Z, Jonasson J, Bodvarsdottir S, Thorsteinsdottir M, Xiang Y | 2022 | Metabolites | Oncology | HALO, HALO AI | |
| Lifetime Exposure to Cigarette Smoke and Risk of Ovarian Cancer by T Cell Tumor Immune Infiltration | Hathaway C, Wang T, Townsend M, Vinci C, Jake-Schoffman D, Saeed-Vafa D, Segura C, Nguyen J, Conejo-Garcia J, Fridley B, Tworoger S | 2022 | Cancer Epidemiology, Biomarkers & Prevention | Oncology | Highplex FL | HALO |
| Integrative Analysis of Bioinformatics and Machine Learning Algorithms Identifies a Novel Diagnostic Model Based on Costimulatory Molecule for Predicting Immune Microenvironment Status in Lung Adenocarcinoma | Zhai W, Duan F, Wang Y, Wang J, Zhao Z, Lin Y, Rao B, Chen S, Zheng L, Long H | 2022 | The American Journal of Pathology | Oncology | Multiplex IHC | HALO |
| Haploinsufficiency of the lysosomal sialidase NEU1 results in a model of pleomorphic rhabdomyosarcoma in mice | Machado E, van de Vlekkert D, Sheppard H, Perry S, Downing S, Laxton J, Ashmun R, Finkelstein D, Neale G, Hu H, Harwood F, Koo S, Grosveld G, d'Azzo A | 2022 | Communications Biology | Oncology | Membrane, Spatial Analysis | HALO |
| Impact of HPV status on immune responses in head and neck squamous cell carcinoma | Qureshi H, Zhu X, Yang G, Steadele M, Pierce R, Futran N, Lee S, Mendez E, Houghton A | 2022 | Oral Oncology | Oncology | Multiplex IHC, Spatial Analysis, Highplex FL | HALO |
| Peritumoral TIGIT+CD20+ B cell infiltration indicates poor prognosis but favorable adjuvant chemotherapeutic response in gastric cancer | Liu H, Wu J, Xu X, Wang H, Zhang C, Yin S, He Y | 2022 | International Immunopharmacology | Oncology | Spatial Analysis | HALO |
| Chemoradiation-induced alteration of programmed death-ligand 1, CD8+ tumor-infiltrating lymphocytes and mucin expression in rectal cancer | Baretti M, Zhu Q, Fu W, Meyer J, Wang H, Anders R, Azad N | 2022 | Oncotarget | Oncology | HALO | |
| CD123-directed allogeneic chimeric-antigen receptor T-cell therapy (CAR-T) in blastic plasmacytoid dendritic cell neoplasm (BPDCN): Clinicopathological insights | Pemmaraju N, Wilson N, Senapati J, Economides M, Guzman M, Neelapu S, Kazemimood R, Davis R, Jain N, Khoury J, Sugita M, Cai T, Smith J, Frattini M, Garton A, Roboz G, Konopleva M | 2022 | Leukemia Research | Immuno-oncology | ISH/FISH | HALO |
| Deep-learning-based classification of desmoplastic reaction on H&E predicts poor prognosis in oesophageal squamous cell carcinoma | Kouzu K, Nearchou I, Kajiwara Y, Tsujimoto H, Lillard K, Kishi Y, Ueno H | 2022 | Histopathology | Oncology | HALO, HALO AI | |
| Subpopulations of cancer-associated fibroblasts link the prognosis and metabolic features of pancreatic ductal adenocarcinoma | Hu B, Wu C, Mao H, Gu H, Dong H, Yan J, Qi Z, Yuan L, Dong Q, Long J | 2022 | Annals of Translational Medicine | Oncology | HALO | |
| Nuclear expression of pSTAT3Tyr705 and pSTAT3Ser727 in the stromal compartment of localized hormone-naïve prostate cancer | Marginean F, Hellsten R, Krzyanowska A, Bjartell A | 2022 | Pathology - Research and Practice | Oncology | TMA | HALO |
| P38α Deficiency in Macrophages Ameliorates Murine Experimental Colitis by Regulating Inflammation and Immune Process | Chen W Liang R, Yi Y, Chen X, Fan H, Zhu J, Zhang J | 2022 | Pathology - Research and Practice | Immunology | FISH | HALO |
| CD103 and periplakin are potential biomarkers for response of metastatic melanoma to pembrolizumab | Edmonds N, Flores S, Mahmutovic A, Young S, Mauldin I, Slingluff C | 2022 | Melanoma Research | Immuno-oncology | Highplex FL | HALO |
| Discovery of a novel ALK/ROS1/FAK inhibitor, APG-2449, in preclinical non-small cell lung cancer and ovarian cancer models | Fang D, Tao R, Wang G, Li Y, Zhang K, Xu C, Zhai G, Wang Q, Wang J, Tang C, Min P, Xiong D, Chen J, Wang S, Yang D, Zhai Y | 2022 | BMC Cancer | Oncology | HALO | |
| LP2, a cyclic angiotensin-(1−7) analog extended with an N-terminal D-lysine, impairs growth of patient-derived xenografts of colorectal carcinoma in mice | Namsolleck P, de Vries L, Moll G | 2022 | Peptides | Oncology | Multiplex IHC | HALO, HALO AI |
| Single Cell RNA-Seq Identifies Immune-Related Prognostic Model and Key Signature-SPP1 in Pancreatic Ductal Adenocarcinoma | Chen K, Wang Q, Liu X, Wang F, Ma Y, Zhang S, Shao Z, Yang Y, Tian X | 2022 | Genes | Oncology | HALO | |
| Artificial Intelligence–Powered Prediction of ALK Gene Rearrangement in Patients With Non–Small-Cell Lung Cancer | Terada Y, Takahashi T, Hayakawa T, Ono A, Kawata T, Isaka M, Muramatsu K, Tone K, Kodama H, Imai T, Notsu A, Mori K, Ohde Y, Nakajima T, Sugino T, Takahashi T | 2022 | JCO Clinical Cancer Informatics | Oncology | HALO, HALO AI | |
| A Novel Artificial Intelligence–Powered Method for Prediction of Early Recurrence of Prostate Cancer After Prostatectomy and Cancer Drivers | Huang W, Randhawa R, Jain P, Hubbard S, Eickhoff J, Kummar S, Wilding G, Basu H, Roy R | 2022 | JCO Clinical Cancer Informatics | Oncology | Classifier, Multiplex IHC, Spatial Analysis | HALO |
| The efficacy of a machine learning algorithm for assessing tumour components as a prognostic marker of surgically resected stage IA lung adenocarcinoma | Terada Y, Isaka M, Kawata T, Mizuno K, Muramatsu K, Katsumata S, Konno H, Nagata T, Muzuno T, Serizawa M, Ono A, Sugino T, Shimizu K, Ohde Y | 2022 | Japanese Journal of Clinical Oncology | Oncology | Classifier | HALO |
| Quantitative Dual-Energy Computed Tomography Image Guidance for Thermochemical Ablation: in vivo Results in the Rabbit VX2 Model | Thompson E, Fowlkes N, Jacobsen M, Layman R, Cressman E | 2022 | Journal of Vascular and Interventional Radiology | Oncology | Classifier | HALO |
| NUC-7738 regulates β-catenin signalling resulting in reduced proliferation and self-renewal of AML cells | Shahid A, Um I, Elshani M, Zhang Y, Harrison D | 2022 | PLOS One | Oncology | HALO | |
| High endothelial venules associated with better prognosis in esophageal squamous cell carcinoma | Li H, Tang L, Han X, Zhong L, Gao W, Chen Y, Huang J, Wen Z | 2022 | Annals of Diagnostic Pathology | Oncology | Object Colocalization, Spatial Analysis, Highplex FL | HALO |
| Immune cell subsets in interface cutaneous immune-related adverse events (cirAEs) associated with anti-PD-1 therapy resemble accute graft vs host disease more than licen planus | Cruz G, Kaunitz G, Stein J, Sander I, Hollmann T, Cottrell T, Taube J, Sunshine J | 2022 | Journal of Cutaneous Pathology | Immunology | HALO | |
| Different types of reactions to E7386 among colorectal cancer patient‑derived organoids and corresponding CAFs | Imai T, Naruse M, Ochiai M, Matsumoto K, Ikeda S, Kani M, Kato Y, Hirayama A, Sogo T, Hori Y, Yokoi A, Ochiai A | 2022 | Oncology Letters | Oncology | HALO | |
| Identification and validation of DPY30 as a prognostic biomarker and tumor immune microenvironment infiltration characterization in esophageal cancer | Mei P, Xiao H, Guo Q, Meng W, Wang M, Huang Q, Liao Y | 2022 | Oncology Letters | Oncology | HALO | |
| Understanding the impact of chemotherapy on the immune landscape of high-grade serous ovarian cancer | Vanguri R, Benhamida J, Young J, Li Y, Zivanovic O, Chi D, Snyder A, Hollmann T, Mager K | 2022 | Gynecologic Oncology Reports | Oncology | Classifier | HALO |
| Imaging mass cytometry reveals tissue-specific cellular immune phenotypes in the mouse knee following ACL injury | South SM, Marlin MC, Mehta-D'souza P, Stephens T, Conner T, Burt KG, Guthridge JM, Scanzello CR, Griffin TM | 2023 | Osteoarthritis and Cartilage Open | Immunology | Highplex FL | HALO |
| Beta-containing bivalent SARS-CoV-2 protein vaccine elicits durable broad neutralization in macaques and protection in hamsters | Berry C, Pavot V, Anosova N, Kishko M, Li L, Tibbitts T, Raillard A, Gautheron S, Cummings S, Bangari D, Kar S, Atyeo C, Deng Y, Alter G, Gutzeit C, Koutsoukos M, Chicz R, Lecouturier V | 2023 | Communications Medicine | Infectious Disease | Area Quantification | HALO |
| Long-Term Dysfunction of Taste Papillae in SARS-CoV-2 | Yao Q, Doyle M, Liu Q, Appleton A, O'Connell J, Weng N, Egan J | 2023 | NEJM Evidence | Infectious Disease | FISH | HALO |
| Protocol for investigating tertiary lymphoid structures in human and murine fixed tissue sections using Opal™-TSA multiplex immunohistochemistry | Quigley L, Pang L, Tavancheh E, Ernst M, Behren A, Huynh J, Da Gama Duarte J | 2023 | STAR Protocols | Other | Highplex FL | HALO |
| Interpretable histopathology-based prediction of disease relevant features in Inflammatory Bowel Disease biopsies using weakly-supervised deep learning | Mokhtari R, Hamidinekoo A, Sutton D, Lewis A, Angermann B, Gehrmann U, Lundin P, Adissu H, Cairns J, Neisen J, Khan E, Marks D, Khachapuridze N, Qaiser T, Burlutskiy N | 2023 | arXiv | Gastroenterology | HALO Link | |
| Butyrate alleviates cognitive impairment by improving gut mucosal barrier function and blocking neuroinflammatory signaling in LDLR -/- mice | Song R, Gao H, Jiang H, Zhang W, Han S | 2023 | Research Square | Neuroscience, Metabolism | Area Quantification | HALO |
| URI alleviates tyrosine kinase inhibitors-induced ferroptosis by reprogramming lipid metabolism in p53 wild-type liver cancers | Ding Z-W, Pan Y-F, Shang T, Jiang T-Y, Lin Y-K, Yang C, Pang S, Cui X-W, Wang Y, Feng X, Xu M, Pei M, Chen Y, Li X, Ding J, Tan Y-X, Wang H, Dong L-W, Wang L | 2023 | Research Square | Oncology | Area Quantification | HALO |
| Long noncoding RNA LINC01594 inhibits the CELF6-mediated splicing of oncogenic CD44 variants to promote colorectal cancer metastasis. | Liu B, Song A, Gui P, Wang J, Pan Y, Li C, Li S, Zhang Y, Jiang T, Xu Y, Huo F, Pei D, Song J | 2023 | Research Square | Oncology | ISH/FISH | HALO |
| APOBEC3B coordinates R-loop to promote replication stress and sensitize cancer cells to ATR/Chk1 inhibitors | Zong C, Zhang Z, Gao L, He J, Wang Y, Li Q, Liu X, Yang J, Chen D, Huang R, Zheng G, Jin X, Wei W, Jia R, Shen J | 2023 | Research Square | Oncology | Multiplex IHC | HALO |
| CXCL9 and CXCL13 coordinately shape the immune-activated microenvironment of endometrial cancer via tertiary lymphoid structure formation | Kodama M, Nagase Y, Aimono E, Nakamura K, Takamatsu R, Abe K, Yoshimura T, Chiyoda T, Yamagami W, Aoki D, Nishihara H | 2023 | Research Square | Immuno-oncology | Registration | HALO |
| Early Identication of High-Risk Patients with HCC Relapse: A Spatial Immune Scoring System Enabled by Articial Intelligence | Sun C, Jia G, He P, Goh D, Li F, Wee F, Sun M, Dai T, Lim J, Hao S, Liu L, Yeong J, Tian Z | 2023 | Research Square | Oncology | Highplex FL | HALO |
| Associations of breast cancer etiologic factors with stromal microenvironment of primary invasive breast cancers in the Ghana Breast Health Study | Abubaker M, Aheam T, Duggan M, Lawrence S, Adjei E, Clegg-Lamptey J, Yamey J, Wiafe-Addai B, Awuah B, Wiafe S, Nyarko K, Aitpillah F, Ansong D, Hewitt S, Brinton L, Figueroa J, Garcia-Closas M, Edusei L, Titiloye N | 2023 | Research Square | Oncology | Classifier, Multiplex IHC | HALO |
| Targeting DRP1 mediated mitochondrial metabolism as a novel treatment strategy for triple negative breast cancer (TNBC) | Wang Y, Harada-Shoji N, Kitamura N, Yamazaki Y, Ebata A, Amari M, Watanabe M, Miyashita M, Tada H, Abe T, Suzuki T, Gonda K, Ishida T | 2023 | Research Square | Oncology | Multiplex IHC | HALO |
| Somatic mutation profiling, tumor-infiltrating leukocytes, tertiary lymphoid structures and PD-L1 protein expression in HER2-amplified colorectal cancer | Liu X, Kou Z, Zhang H, Dong J, Zhang J, Peng Y, Ma S, Liang L, Meng X, Zhou Y, Yang J | 2023 | PeerJ | Immuno-oncology | Highplex FL | HALO |
| Signal-transducing adaptor protein 1 (STAP1) in microglia promotes the malignant progression of glioma | Yang X, Ji C, Qi Y, Huang J, Hu L, Zhou Y, Zou L, Xia Y, Tan F, Yao Y, Chen D | 2023 | Research Square | Oncology | Highplex FL | HALO |
| Host, reproductive, and lifestyle factors in relation to quantitative histologic metrics of the normal breast | Abubakar M, Klein A, Fan S, Lawrence S, Mutreja K, Henry J, Pfeiffer R, Duggan M, Gierach G | 2023 | Research Square | Oncology | Classifier | HALO, HALO Link |
| High expression ITGA2 affects the expression of MET,PD-L1, CD4 and CD8 with the immune microenvironment in pancreatic cancer patients | Jin L, Duan Y, Li Z, Hu J, Shi H, Su Z, Li Z, Du B, Chen Y, Tan Y | 2023 | Research Square | Oncology | Highplex FL | HALO |
| Sequential pembrolizumab cooperates with platinum/5FU to remodel the tumor immune microenvironment in advanced gastric cancer: A phase II chemoimmunotherapy trial | Klempner S, Lee J, Mehta A, An M, Min B, Heo Y, Parikh M, Bi L, Cristescu R, Lee H, Kim T, Lee S, Moon J, Park R, Strickland M, Park W, Kang W, Kim K, Kim S | 2023 | Research Square | Immuno-oncology | Classifier, Highplex FL | HALO |
| CAR T-cell design dependent remodeling of the brain tumor immune microenvironment identify macrophages as key players that inhibit or promote anti-tumor activity | Haydar D, Ibañez-Vega J, Crawford J, Chou C, Guy C, Meehl M, Yi Z, Langfitt D, Vogel P, DeRenzo C, Gottschalk S, Roussel M, Thomas P, Krenciute G, | 2023 | Research Square | Immuno-oncology | Cytonuclear | HALO |
| The Hippo-YAP signaling pathway drives CD24- mediated immune evasion in esophageal squamous cell carcinoma via macrophage phagocytosis | Yan Z, Hou J, Zhang L, Chen Z, Gao C, Ahmad N, Guo M, Wang W, Han T, Chang T, Kang X, Wang L, Liang Y, Li X, Zhou X | 2023 | Research Square | Immuno-oncology | Spatial Analysis | HALO |
| Type III interferon inhibits bladder cancer progression by reprogramming macrophage-mediated phagocytosis and orchestrating effective immune responses | Wang B, Zhou B, Chen J, Sun X, Yang W, Yang T, Yu H, Chen P, Chen K, Huang X, Fan X, He W, Huang J, Lin T | 2023 | Research Square | Immuno-oncology | Multiplex IHC | HALO, HALO AI |
| Absence of sympathetic innervation hampers the generation of tertiary lymphoid structures upon acute lung inflammation | Riffard C, Letaïef L, Azar S, Casrouge A, Brunet I, Teillaud JL, Dieu-Nosjean MC | 2023 | Research Square | Immunology | HALO, HALO AI | |
| Intratumoral Heterogeneity of Ki67 Proliferation Index Outperforms Conventional Prognostic Factors in Hormone Receptor-Positive Breast Cancer | Zilenaite-Petrulaitiene D, Rasmusson A, Besusparis J, Valkiuniene R, Augulis R, Laurinaviciene A, Plancoulaine B, Petkevicius L, Laurinavicius A | 2023 | Research Square | Oncology | Multiplex IHC, Figure Maker | HALO, HALO AI |
| Pan-Cancer Analysis Revealed ITM2A as a Predictive Biomarker of Prognosis and Immunotherapy for Kidney Renal Clear Cell Carcinoma | Zhang H, Fang J, Ruan R, Yu J, Wang S | 2023 | Research Square | Oncology | Multiplex IHC | HALO |
| Neighboring macrophage-induced alteration in the phenotype of colorectal cancer cells in the tumor budding area | Kawamura I, Ohe R, Suzuki K, Kabasawa T, Kitoaka T, Takahara D, Kono M, Uchiyama N, Musha H, Futakuchi M, Motoi F | 2023 | Research Square | Immuno-oncology | Multiplex IHC, Spatial Analysis | HALO |
| Macrophage reprogramming—rather than depletion —is efficacious in a specific subset of colorectal tumor models | Mohamed N, Amirkhah R, Lavaud X, Gilroy K, Bartolini R, Mulholland E, Garg A, Pennel K, Jackstadt R, Ridgway R, Nixon C, Hatthakarnku P, Campbell A, Leedham S, Edwards J, Dunne P, Barry S, Graham G, Sansom O | 2023 | Research Square | Immuno-oncology | Multiplex IHC, Highplex FL | HALO |
| Investigating the Effects of Stereotactic Body Radiation Therapy on Pancreatic Tumor Hypoxia and Microvasculature in an Orthotopic Mouse Model using Intravital Fluorescence Microscopy | Samuel T, Rapic S, Lindsay P, DaCosta RS | 2023 | Research Square | Oncology | Classifier, Area Quantification | HALO |
| Effects and Mechanisms of the Subtypes of Apolipoprotein E to the Immune State and Prognosis of hepatocellular carcinoma patients | Gao B, Zhou P, Wang L, Wang Z, Yi Y, Zhou J, Fan J, Qiu S, Xu Y | 2023 | Research Square | Immuno-oncology | Multiplex IHC, Highplex FL | HALO |
| The prognostic value of CD39 +CD8 + T cells as a potential surrogate marker of tumor-specific T cells in Asian triple-negative breast cancer | Meng J, Tira TJY, Joseph CR, Ye J, Lim JCT, Goh D, Yuezhen X, Lim X, Koh VCY, Wee F, Tay TKY, Chan JV, Ng CCY, Iqbal J, Lau MC, Elaine LH, Chong TH, The BT, Dent RA, Tan PH, Sheng JYP | 2023 | Research Square | Immuno-oncology | Highplex FL | HALO |
| Reversing immunosuppression in the tumor microenvironment of fibrolamellar carcinoma via PD-1 and IL-10 blockade | Daniel S, Sullivan K, Dickerson L, van den Bijgaart R, Utria A, Labadie K, Kenerson H, Jiang X, Smythe K, Campbell J, Pierce R, Kim T, Riehle K, Yeung R, Carter J, Barry K, Pillarisetty V | 2023 | Research Square | Immuno-oncology | Highplex FL | HALO |
| A phase 2 trial of peri-operative avelumab and chemotherapy for locally advanced gastroesophageal adenocarcinoma: Association of AGR2/AP-1 complex CD8 T-cells and M2-Tumour Associated Macrophages with treatment response | Ferri L, Alcindor T, Tankel J, Fiset P, Pal S, Opu T, Strasser M, Dehghani M, Bertos N, Zuo D, Mueller C, Cools-Lartigue J, Hickeson M, Marcus V, Camilleri-Broët S, Spatz A, Evaristo G, Farag M, Artho G, Elkrief A, Saleh R, Park M, Huang S, Sanwan V | 2023 | Research Square | Immuno-oncology | Spatial Analysis, Highplex FL | HALO |
| The role of human endometrial stem cells application in endometrial-factor induced infertility | Bausyte R, Vaigauskaite B, Borutinskaite V, Valatkaite E, Besusparis J, Valkiuniene R, Kazenaite E, Ramasauskaite D, Navakauskiene R | 2023 | Research Square | Other | Area Quantification | HALO |
| Microglial depletion does not impact alphasynuclein aggregation or nigrostriatal degeneration in the rat preformed fibril model | Stoll A, Kemp C, Patterson J, Kubik M, Kuhn N, Benskey M, Duffy M, Luk K, Sortwell C | 2023 | Research Square | Neuroscience | Area Quantification | HALO |
| Detection of virus in colorectal cancer and the tumor immune microenvironment in EBV-associated colorectal cancer | Lv D, Zuo Y, Bibi A, Meng T, Xu Y | 2023 | Research Square | Oncology, Infectious Disease | Multiplex IHC | HALO |
| Electrical impedance myography detects dystrophin-related muscle changes in mdx mice | Hiyoshi T, Zhao F, Baba R, Hirakawa T, Kuboki R, Suzuki K, Tomimatsu Y, O'Donnell P, Han S, Zach N, Nakashima M | 2023 | Research Square | Myology | Area Quantification, Muscle Fiber | HALO |
| Pathologist-Trained Machine Learning Classifiers Developed to Quantitate Celiac Disease Features Differentiate Endoscopic Biopsies According to Modified Marsh Score and Dietary Intervention Response | Gruver A, Lu H, Zhao X, Fulford A, Soper M, Ballard D, Hanson J, Schade A, His E, Gottlieb K. Credille K | 2023 | Research Square | Gastroenterology | Multiplex IHC | HALO, HALO AI |
| LINC01638 Sustains Human Mesenchymal Stem Cell Self-Renewal and Competency for Osteogenic Cell Fate | Gordon J, Tye C, Banerjee B, Ghule P, Wijnen A, Kabala F, Page N, Falcone M, Stein J, Stein G, Lian J | 2023 | Research Square | Other | Object Colocalization, FISH | HALO |
| Combined toxic effects of MWCNTs and ZnO nanoparticle on the liver of common carp | Gao X, Huang Y, Ren H, Li Y, Chen J, Xu R | 2023 | Research Square | Toxicology | Highplex FL | HALO |
| Regional and cellular iron deposition patterns predict clinical subtypes of multiple system atrophy | Lee S, Martinez-Valbuena I, Lang AE, Kovacs GG | 2023 | Research Square | Neuroscience | Area Quantification, Object Colocalization | HALO |
| Genetically- and spatially-defined basolateral amygdala neurons control food consumption and social interaction | Lim H, Zhang Y, Peters C, Straub T, Mayer JL, Klein R | 2023 | bioRxiv | Neuroscience | FISH | HALO |
| Entorhinal cortex vulnerability to human APP expression promotes hyperexcitability and tau pathology | Rowan M, Goettemoeller A, Banks E, McCann K, Kumar P, South K, Olah V, Ramelow C, Duong D, Seyfried N, Rangaraju S, Weinshenker D | 2023 | Research Square | Neuroscience | FISH-IF | HALO |
| Quantitative performance assessment of Ultivue multiplex panels in formalin-fixed, paraffinembedded human and murine tumor specimens | Ram S, Mojtahedzadeh S, Aguilar JK, Coskran T, Powell E, O'Neil S | 2023 | Research Square | Other | Spatial Analysis, Highplex FL | HALO |
| Intranasal mRNA-LNP vaccination protects hamsters from SARS-CoV-2 infection | Vaca G, Meyer M, Cadete A, Hsiao C, Golding A, Jeon A, Jacquinet E, Azcue E, Guan C, Sanchez-Felix X, Pietzsch C, Mire C, Hyde M, Comeaux M, Williams J, Sung J, Carfi A, Edwards D, Bukreyev A, Bahl K | 2023 | bioRxiv | Infectious Disease | Multiplex IHC | HALO |
| Extensive and Persistent Extravascular Dermal Fibrin Deposition Characterizes Systemic Sclerosis | Browning J, Bhawan J, Tseng A, Crossland N, Bujor A, Akassoglou K, Assassi S, Skaug B, Ho J | 2023 | bioRxiv | Fibrosis | Area Quantification | HALO |
| Prefrontal cortical protease TACE/ADAM17 is involved in neuroinflammation and stress-related eating alterations | Sharafeddin F, Ghaly M, Simon T, Ontiveros-Angel P, Figueroa J | 2023 | bioRxiv | Neuroscience | ISH/FISH | HALO |
| LY6E protects mice from pathogenic effects of murine coronavirus and SARS-CoV-2 | Mar K, Van Dyke M, Lopez A, Eitson J, Fan W, Hanners N, Evers B, Shelton J, Schoggins J | 2023 | bioRxiv | Infectious Disease | Multiplex IHC | HALO |
| Gold Nanoparticles for Monitoring of Mesenchymal Stem Cell–Loaded Bioresorbable Polymeric Wraps for Arteriovenous Fistulas | Barcena A, Perez J, Damasco J, Bernardino M, San Valentin E, Klusman C, Martin B, Cortes A, Canlas G, Heralde III, F, Avritscher R, Fowlkes N, Bouchard R, Cheng J, Huang S, Melancon M | 2023 | bioRxiv | Biomaterials | Highplex FL | HALO |
| Impact of aging on the immunological and microbial landscape of the lung during nontuberculous mycobacterial infection | Cinco I, Rhoades N, Napier E, Davies M, Allison D, Kohama S, Bermudez L, Winthrop K, Fuss C, Spindel E, Messaoudi I | 2023 | bioRxiv | Infectious Disease | Highplex FL | HALO |
| Endothelial Cells are Heterogeneous in Different Brain Regions and are Dramatically Altered in Alzheimer's Disease | Bryant A, Li Z, Jayakumar R, Serrano-Pozo A, Woost B, Hu M, Woodbury M, Wachter A, Lin G, Kwon T, Talanian R, Biber K, Karran E, Hyman B, Das S, Bennett R | 2023 | bioRxiv | Neuroscience | Area Quantification | HALO |
| Ubiquinone deficiency drives reverse electron transport to disrupt hepatic metabolic homeostasis in obesity | Goncalves R, Wang Z, Inouye K, Lee G, Fu X, Saksi J, Rosique C, Parlakgul G, Arruda A, Hui S, Loperena M, Burgess S, Graupera I, Hotamisligil G | 2023 | bioRxiv | Metabolism | Area Quantification | HALO |
| Radiation-induced persistent DNA damage response and late toxicity in cardiac tissue | Shigemori K, Jiang Y, Martin J, Hawkins M, Ryan A, Parkes E | 2023 | bioRxiv | Other | HALO, HALO AI | |
| Tyrosinase-induced neuromelanin accumulation triggers rapid dysregulation and degeneration of the mouse locus coeruleus | Iannitelli A, Segal A, Pare J, Mulvey B, Liles L, Sloan S, McCann K, Dougherty J, Smith Y, Weinshenker D | 2023 | bioRxiv | Neuroscience | FISH-IF | HALO |
| Inhibition of Cellular MEK/ERK Signaling Suppresses Murine Papillomavirus Type 1 Replicative Activities and Promotes Tumor Regression | Luna A, Young J, Sterk R, Bondu V, Schultz F, Kusewitt D, Kang H, Ozbun M | 2023 | bioRxiv | Oncology, Infectious Disease | Area Quantification, Cytonuclear | HALO |
| Innate immune receptor C5aR1 regulates cancer cell fate and can be targeted to improve radiotherapy in tumours with immunosuppressive microenvironments | Beach C, MacLean D, Majorova D, Melemenidis S, Nambiar D, Kim R, Valbuena G, Guglietta S, Krieg C, Darvish D, Suwa T, Eason A, Domingo E, Moon E, Jiang D, Jiang Y, Koong A, Woodruff T, Graves E, Maughan T, Buczacki S, Stucki M, Le Q-T, Leedham S, Giaccia A, Olcina M | 2023 | bioRxiv | Immuno-oncology | Classifier, Area Quantification, Highplex FL | HALO |
| Combined KRASG12C and SOS1 inhibition enhances and extends the anti-tumor response in KRASG12C-driven cancers by addressing intrinsic and acquired resistance | Thatikonda V, Lu H, Jurado S, Kostyrko K, Bristow C, Bosch K, Feng N, Gao S, Gerlach D, Gmachi M, Lieb S, Jeschko A, Machado A, Marszalek E, Mahendra M, Jaeger P, Sorokin A, Strauss S, Trapani F, Kopetz S, Vellano C, Petronczki M, Kraut N, Heffernan T, Marszalek J, Pearson M, Waizenegger I, Hofmann M | 2023 | bioRxiv | Oncology | Multiplex IHC | HALO |
| Discovery of NRG1-VII: a novel myeloid-derived class of NRG1 isoforms | Berrocal-Rubio M, Pawer Y, Dinevska M, De Paoli-Iseppi R, Widodo S, Rajab N, De Nardo W, Hallab J, Li A, Mantamadiotis T, Clark M, Wells C | 2023 | bioRxiv | Immunology | Highplex FL | HALO |
| Oncogenic KrasG12D specific non-covalent inhibitor reprograms tumor microenvironment to prevent and reverse early pre-neoplastic pancreatic lesions and in combination with immunotherapy regresses advanced PDAC in a CD8+ T cells dependent manner | Mahadevan K, McAndrews K, LeBlue V, Yang S, Lyu H, Li B, Sockwell A, Kirtley M, Morse S, Diaz B, Kim M, Feng N, Lopez A, Guerrero P, Sugimoto H, Arian K, Ying H, Barekatain Y, Kelly P, Maitra A, Heffernan T, Kalluri R | 2023 | bioRxiv | Oncology | FISH, Highplex FL | HALO |
| MYC-driven increases in mitochondrial DNA copy number occur early and persist throughout prostatic cancer progression | Chen J, Zheng Q, Hicks J, Trabzonlu L, Ozbek B, Jones T, Vaghasia A, Larman T, Wang R, Markowski M, Denmeade S, Pienta K, Hruban R, Antonaraskis E, Gupta A, Dang C, Yegnasubramanian S, De Marzo A | 2023 | bioRxiv | Oncology | Classifier, Area Quantification, Serial Section | HALO |
| Lorazepam stimulates IL-6 production and is associated with poor survival outcomes in pancreatic cancer. | Cornwell A, Tisdale A, Venkat S, Maraszek K, Alahmari A, George A, Attwood K, George M, Rempinski D, Franco-Barraza J, Parker M, Gomez E, Fountzilas C, Cukierman E, Steele N, Feigin M | 2023 | medrxiv | Oncology | FISH-IF | HALO |
| Melanotransferrin Functions as a Pro-Oncogenic WNT Agonist: A Yin-Yang Relationship in Melanoma with the WNT Antagonist and Metastasis Suppressor, NDRG1 | Paluncic J, Cholam M, Lane D, Skoda J, Park K, Chiang S, Bae D, Scolyer R, Afroz R, Babu G, Wilmott J, Loh K, Jansson P, Dharmasiviam M, Huang M, Zhao X, Kovacevic Z, Richardson D | 2023 | bioRxiv | Oncology | Highplex FL | HALO |
| Metabolic profiling stratifies colorectal cancer and reveals adenosylhomocysteinase as a therapeutic target | Voorde J, Najumudeen A, Steven R, Nikula C, Dexter A, Zeiger L, Elia E, Nasif A, Conzalez-Fernandez A, Murta T, Gillespie M, Ford C, Lannagan T, Vlahov N, Ridgeway R, Nixon C, Gilroy K, Gay D, Burton A, Yan B, Sellers K, Wu V, Xiang Y, Shokry E, Clark W, Li V, Barry S, Goodwin R, Takats Z, Maddocks O, Sumpton D, Yuneva M, Campbell A, Bunch J, Sansom O | 2023 | bioRxiv | Oncology | ISH | HALO |
| Tumour Extracellular Vesicles Induce Neutrophil Extracellular Traps To Promote Lymph Node Metastasis | Su X, Brassard A, Bartolomucci A, Dhoparee-Dooma I, Qiu Q, Tsering T, Rohanizadeh R, Koufos O, Giannias B, Bourdeau F, Feng L, Leo S, Sangwan V, Tankel J, Quail D, Spicer J, Burnier J, Bailey S, Ferri L, Cools-Lartigue J | 2023 | bioRxiv | Immuno-oncology | Area Quantification, Highplex FL | HALO |
| SRF617 Is a Potent Inhibitor of CD39 with Immunomodulatory and Antitumor Properties | Warren M, Matissek S, Rausch M, Panduro M, Hall R, Dulak A, Brennan D, Das Yekkirala S, Koseoglu S, Masia R, Yang Y, Reddy N, Prenovitz R, Strand J, Zaidi T, Devereaux E, Jacoberger Foissac C, Stagg J, Lee B, Holland P, Palombella V, Lake A | 2023 | ImmunoHorizons | Immuno-oncology | Classifier, Area Quantification, Multiplex IHC | HALO |
| Immune response after pig-to-human kidney xenotransplantation: a multimodal phenotyping study | Loupy A, Goutaudier V, Giarraputo A, Mezine F, Morgand E, Robin B, Khalil K, Mehta S, Keating B, Dandro A, Certain A, Tharaux PL, Narula N, Tissier R, Giraud S, Hauet T, Pass HI, Sannier A, Wu M, Griesemer A, Ayares D, Tatapudi V, Stern J, Lefaucheur C, Bruneval P, Mangiola M, Montgomery RA | 2023 | The Lancet | Immunology | Multiplex IHC | HALO, HALO AI |
| In-depth virological and immunological characterization of HIV-1 cure after CCR5Δ32/Δ32 allogeneic hematopoietic stem cell transplantation | Jensen B, Knops E, Cords L, Lubke N, Salgado M, Busman-Sahay K, Estes J, Huyveneers L, Perdomo-Celis F, Wittner M, Galvez C, Mummert C, Passaes C, Eberhard J, Munk C, Hauber I, Hauber J, Heger E, De Clercq J, Vandekerckhove L, Bergmann S, Dunay G, Klein F, Haussinger D, Fischer J, Nachtkamp K, Timm J, Kaiser R, Harrer T, Luedde T, Nijhuis M, Saez-Cirion A, zur Wiesch J, Wensing A, Martinez-Picado J, Kobbe G | 2023 | Nature Medicine | Infectious Disease | Figure Maker | HALO |
| Autologous T cell therapy for MAGE-A4+ solid cancers in HLA-A*02+ patients: a phase 1 trial | Hong D, Van Tine B, Biswas S, McAlpine C, Johnson M, Olszanski A, Clarke J, Araujo D, Blumenschein G, Kebriaei P, Lin Q, Tipping A, Sanderson J, Wang R, Trivedi T, Annareddy T, Bai J, Rafail S, Sun A, Fernandes L, Navenot J-M, Bushman F, Everett J, Karadeniz D, Broad R, Isabelle M, Naidoo R, Bath N, Betts G, Wolchinsky Z, Batrakou D, Van Winkle E, Elefant E, Ghobadi A, Cashen A, Grand'Maison A, McCarthy P, Fracasso P, Norry E, Williams D, Druta M, Liebner D, Odunsi K, Butler M | 2023 | Nature Medicine | Immuno-oncology | ISH/FISH, Spatial Analysis, Highplex FL | HALO |
| Combined PD-1, BRAF and MEK inhibition in BRAFV600E colorectal cancer: a phase 2 trial | Tian J, Chen J, Chao S, Pelka K, Giannakis M, Hess J, Burke K, Jorgji V, Sindurakar P, Braverman J, Mehta A, Oka T, Huang M, Lieb D, Spurrell M, Allen J, Abrams T, Clark J, Enzinger A, Enzinger P, Klempner S, McCleary N, Meyerhardt J, Ryan D, Yurgelun M, Kanter K, Van Seventer E, Baiev I, Chi G, Jarnagin J, Bradford W, Wong E, Michel A, Fetter I, Siravegna G, Gemma A, Sharpe A, Demehri S, Leary R, Campbell C, Yilmaz Om Getz G, Parikh A, Hacohen N, Corcoran R | 2023 | Nature Medicine | Oncology | Highplex FL | HALO |
| Multi-organ landscape of therapy-resistant melanoma | Liu S, Dharanipragada P, Lomeli S, Wang Y, Zhang X, Yang Z, Lim R, Dumitras C, Scumpia P, Dubinett S, Moriceau G, Johnson D, Moschos S, Lo R | 2023 | Nature Medicine | Oncology, Immuno-oncology | Highplex FL | HALO |
| Oncolytic DNX-2401 virotherapy plus pembrolizumab in recurrent glioblastoma: a phase 1/2 trial | Nassiri F, Patil V, Yefet L, Singh O, Liu J, Dang R, Yamaguchi T, Daras M, Cloughesy T, Colman H, Kumthekar P, Chen C, Aiken R, Groves M, Ong S, Ramakrishna R, Vogelbaum M, Khagi S, Kaley T, Melear J, Peereboom D, Rodriguez A, Yankelevich M, Nair S, Puduvalli V, Aldape K, Gao A, López-Janeiro Á, de Andrea C, Alonso M, Boutros P, Robbins J, Mason W, Sonabend A, Stupp R, Fueyo J, Gomez-Manzano C, Lang F, Zadeh G | 2023 | Nature Medicine | Immuno-oncology | Multiplex IHC | HALO |
| The tumor immune microenvironment of nasopharyngeal carcinoma after gemcitabine plus cisplatin treatment | Lv J, Wei Y, Yin J, Chen Y, Zhou G, Wei C, Liang X, Zhang Y, Zhang C, He S, He Q, Huang Z, Guan J, Shen J, Li X, Li J, Li W, Tang L, Mao Y, Guo R, Sun R, Zheng Y, Zhou W, Xiong K, Wang S, Jin X, Liu N, Li G, Kuang D, Sun Y, Ma J | 2023 | Nature Medicine | Oncology | Multiplex IHC, Highplex FL | HALO |
| The PD-1- and LAG-3-targeting bispecific molecule tebotelimab in solid tumors and hematologic cancers: a phase 1 trial | Luke J, Patel R, Blumenschein R, Hamilton E, Chmielowski B, Ulahannan S, Connolly R, Santa-Maria C, Wang J, Bahadur S, Weickhardt A, Asch A, Mallesara G, Clingan P, Dlugosz-Danecka M, Tomaszewska-Kiecana M, Pylypenko H, Hamad N, Kindler H, Sumrow B, Kaminker P, Chen F, Zhang X, Shah K, Smith D, De Costa A, Li J, Li H, Sun J, Moore P | 2023 | Nature Medicine | Immuno-oncology | Highplex FL | HALO |
| Spike and nsp6 are key determinants of SARS-CoV-2 Omicron BA.1 attenuation | Chen D-Y, Chin C, Kenney D, Tavares A, Khan N, Conway H, Liu G, Choudhary M, Gertje H, O'Connell A, Adams S, Kotton D, Herrmann A, Ensser A, Connor J, Bosmann M, Li J, Gack M, Baker S, Kirchdoerfer R, Kataria Y, Crossland N, Douam F, Saeed M | 2023 | Nature | Infectious Disease | Area Quantification | HALO |
| Dedifferentiation maintains melanocyte stem cells in a dynamic niche | Sun Q, Lee W, Hu H, Ogawa T, De Leon S, Katehis I, Lim C, Takeo M, Cammer M, Taketo M, Gay D, Millar S, Ito M | 2023 | Nature | Other | FISH | HALO |
| Single-cell spatial immune landscapes of primary and metastatic brain tumours | Karimi E, Yu M, Maritan S, Perus L, Rezanejad M, Sorin M, Kankner M, Fallah P, Doré S, Zuo D, Fiset B, Kloosterman D, Ramsay L, Wei Y, Lam S, Alsajjan R, Watson I, Urgoiti G, Park M, Randsma D, Senger D, Chan J, Akkari L, Petrecca K, Guiot M-C, Siegel P, Quail D, Walsh L | 2023 | Nature | Immuno-oncology | Highplex FL | HALO |
| Netrin-1 blockade inhibits tumour growth and EMT features in endometrial cancer | Cassier PA, Navaridas R, Bellina M, Rama N, Ducarouge B, Hernandez-Vargas H, Delord JP, Lengrand J, Paradisi A, Fattet L, Garin G, Gheit H, Dalban C, Pastushenko I, Neves D, Jelin R, Gadot N, Braissand N, Léon S, Degletagne C, Matias-Guiu X, Devouassoux-Shisheboran M, Mery-Lamarche EM, Allard J, Zindy E, Decaestecker C, Salmon I, Perol D, Dolcet X, Ray-Coquard I, Blanpain C, Bernet A, Mehlen P | 2023 | Nature | Oncology | Multiplex IHC | HALO |
| Epigenetic regulation during cancer transitions across 11 tumour types | Terekhanova N V, Karpova A, Liang W W, Strzalkowski A, Chen S, Li Y, Southard-Smith A N, Iglesia M D, Wendl M C, Jayasinghe R G, Liu J, Song Y, Cao S, Houston A, Liu X, Wyczalkowski M A, Lu R J, Caravan W, Shinkle A, Naser Al Deen N, Herndon J M, Mudd J, Ma C, Sarkar H, Sato K, Ibrahim O M, Mo C K, Chasnoff S E, Porta-Pardo E, Held J M, Pachynski R, Schwarz J K, Gillanders W E, Kim A H, Vij R, DiPersio J F, Puram S V, Chheda M G, Fuh K C, DeNardo D G, Fields R C, Chen F, Raphael B J, Ding L | 2023 | Nature | Oncology | Highplex FL | HALO |
| Targeting myeloid chemotaxis to reverse prostate cancer therapy resistance | Guo C, Sharp A, Gurel B, Crespo M, Figueiredo I, Jain S, Vogl U, Rekowski J, Rouhifard M, Gallagher L, Yuan W, Carreira S, Chandran K, Paschalis A, Colombo I, Stathis A, Bertan C, Seed G, Goodall J, Raynaud F, Ruddle R, Swales K, Malia J, Bogdan D, Tiu C, Caldwell R, Aversa C, Ferreira A, Neeb A, Tunariu N, Westaby D, Carmichael J, Maza M, Yap C, Matthews R, Badham H, Prout T, Turner A, Parmar M, Tovey H, Riisnaes R, Flohr P, Gil J, Waugh D, Decordova S, Schlag A, Calì B, Alimonti A, de Bono J S | 2023 | Nature | Oncology | Highplex FL | HALO, HALO AI |
| Inhibiting membrane rupture with NINJ1 antibodies limits tissue injury | Kayagaki N, Stowe I, Alegre K, Deshpande I, Wu S, Lin Z, Kornfeld O, Lee B, Zhang J, Liu J, Suto E, Lee W, Schneider K, Lin W, Seshasayee D, Bhangale T, Chalouni C, Johnson M, Joshi P, Mossemann J, Zhao S, Ali D, Goldenberg N, Sayed B, Steinberg B, Newton K, Webster J, Kelly R, Dixit V | 2023 | Nature | Other | Multiplex IHC | HALO, HALO AI |
| NLRP12-PANoptosome activates PANoptosis and pathology in response to heme and PAMPs | Sundaram B, Pandian N, Mall R, Wang Y, Sarkar R, Kim H, Malireddi R, Karki R, Janke L, Vogel P, Kanneganti T | 2023 | Cell | Immunology | HALO | |
| A pan-cancer single-cell panorama of human natural killer cells | Tang F, Li J, Qi L, Liu D, Bo Y, Qin S, Miao Y, Yu K, Hou W, Li J, Peng J, Tian Z, Zhu L, Peng H, Wang D, Zhang Z | 2023 | Cell | Immuno-oncology | Highplex FL | HALO |
| Proteogenomic analysis of chemo-refractory highgrade serous ovarian cancer | Chowdhury S, Kennedy JJ, Ivey RG, Murillo OD, Hosseini N, Song X, Petralia F, Calinawan A, Savage SR, Berry AB, Reva B, Ozbek U, Krek A, Ma W, Leprevost FdV, Ji J, Yoo S, Lin C, Voytovich UJ, Huang Y, Lee SH, Bergan L, Lorentzen TD, Mesri M, Rodriguez H, Hoofnagle AN, Herbert ZT, Nesvizhskii AI, Zhang B, Whiteaker JR, Fenyo D, McKerrow W, Wang J, Schürer SC, Stathias V, Chen XS, Barcellos-Hoff MH, Starr TK, Winterhoff BJ, Nelson AC, Mok SC, Kaufmann SH, Drescher C, Cieslik M, Wang P, Birrer MJ, Paulovich AG | 2023 | Cell | Oncology | Highplex FL | HALO, HALO Link |
| An immune cell atlas reveals the dynamics of human macrophage specification during prenatal development | Wang Z, Wu Z, Wang H, Feng R, Wang G, Li M, Wang S, Chen X, Su Y, Wang J, Zhang W, Bao Y, Lan Z, Song Z, Wang Y, Luo X, Zhao L, Hou A, Tian S, Gao H, Miao W, Liu Y, Wang H, Yin C, Ji Z, Feng M, Liu H, Diao L, Amit I, Chen Y, Zeng Y, Ginhoux F, Wu X, Zhu Y, Li H | 2023 | Cell | Immunology | Highplex FL | HALO |
| Tumor-associated macrophages trigger MAIT cell dysfunction at the HCC invasive margin | Ruf B, Bruhns M, Babaei S, Kedei N, Ma L, Revsine M, Benmebarek MR, Ma C, Heinrich B, Subramanyam V, Qi J, Wabitsch S, Green BL, Bauer KC, Myojin Y, Greten LT, McCallen JD, Huang P, Trehan R, Wang X, Nur A, Soika DQM, Pouzolles M, Evans CN, Chari R, Kleiner DE, Telford W, Dadkhah K, Ruchinskas A, Stovroff MK, Kang J, Oza K, Ruchirawat M, Kroemer A, Wang XW, Claassen M, Korangy F, Greten TF | 2023 | Cell | Immuno-oncology | Classifier, Spatial Analysis, Highplex FL, Figure Maker | HALO |
| T cell immunotherapies engage neutrophils to eliminate tumor antigen escape variants | Hirschhorn D, Budhu S, Kraehenbuehl L, Gigoux M, Schröder D, Chow A, Ricca J, Gasmi B, De Henau O, Mangarin L, Li Y, Hamadene L, Flamar A, Choi H, Cortez C, Liu C, Holland A, Schad S, Schulze I, Warner A, Hollmann T, Arora A, Panageas K, Rizzuto G, Duhen R, Weinberg A, Spencer C, Ng D, He X, Albrengues J, Redmond D, Egeblad M, Wolchok J, Merghoub T | 2023 | Cell | Immuno-oncology | Area Quantification, Highplex FL | HALO |
| Phase 1 Dose Escalation and Expansion Study of Golidocitinib, a Highly Selective JAK1 Inhibitor, in Relapsed or Refractory Peripheral T Cell Lymphomas | Song Y, Yoon D, Yang H, Cao J, Ji D, Koh Y, Jing H, Eom H, Kwak J, Lee W, Lee J, Shin H, Jin J, Wang M, Yang Q, Kim W, Zhu J | 2023 | Annals of Oncology | Immuno-oncology | Multiplex IHC | HALO |
| Neoadjuvant palbociclib plus either giredestrant or anastrozole in oestrogen receptor-positive, HER2-negative, early breast cancer (coopERA Breast Cancer): an open-label, randomised, controlled, phase 2 study | Hurvitz SA, Bardia A, Quiroga V, Park YH, Blancas I, Alonso-Romero JL, Vasiliev A, Adamchuk H, Salgado M, Yardley DA, Berzoy O, Zamora-Auñón P, Chan D, Spera G, Xue C, Ferreira E, Badovinac Crnjevic T, Pérez-Moreno PD, López-Valverde V, Steinseifer J, Fernando TM, Moore HM, Fasching PA, on behalf of the coopERA Breast Cancer study group | 2023 | The Lancet Oncology | Oncology | Multiplex IHC | HALO |
| Mitochondria-localized cGAS suppresses ferroptosis to promote cancer progression | Qiu S, Zhong X, Meng X, Li S, Qian X, Lu H, Cai J, Zhang Y, Wang M, Ye Z, Zhang H, Gao P | 2023 | Cell Research | Oncology | Multiplex IHC | HALO |
| Histological validation of atrial structural remodelling in patients with atrial fibrillation | Takahashi Y, Yamaguchi T, Otsubo T, Nakashima K, Shinzato K, Osako R, Shichida S, Kawano Y, Fukui A, Kawaguchi A, Aishima S, Saito T, Takahashi N, Node K | 2023 | European Heart Journal | Other | Area Quantification | HALO |
| Soluble CD4 effectively prevents excessive TLR activation of resident macrophages in the onset of sepsis | Zhang S, Xu Q, Shi L, Li S, Wang W, Wang Q, Lu L, Xiao H, Wang J, Li F, Liang Y, Gong S, Peng H, Zhang Z, Tang G | 2023 | Signal Transduction and Targeted Therapy | Immunology | HALO | |
| Phenotypic plasticity and reduced tissue retention of exhausted tumor-infiltrating T cells following neoadjuvant immunotherapy in head and neck cancer | Sievers C, Craveiro M, Friedman J, Robbins Y, Yang X, Bai K, Nguyen A, Redman J, Chari R, Soon-Shiong P, Schlom J, Gulley J, Allen C. | 2023 | Cancer Cell | Immuno-oncology | Classifier, Highplex FL | HALO, HALO AI |
| Transcriptional-translational conflict is a barrier to cellular transformation and cancer progression | Jana S, Brahma S, Arora S, Wladyka C, Hoang P, Blinka S, Hough R, Horn J, Liu Y, Wang L, Depeille P, Smith E, Montgomery R, Lee J, Haffner M, Vakar-Lopez F, Grivas P, Wright J, Lam H, Black P, Roose J, Ryazanov A, Subramaniam A, Henikoff S, and Hsieh A | 2023 | Cancer Cell | Oncology | Multiplex IHC, Highplex FL | HALO |
| Context-dependent activation of STING-interferon signaling by CD11b agonists enhances anti-tumor immunity | Liu X, Hogg G, Zuo C, Borcherding N, Baer J, Lander V, Kang LI, Knolhoff B, Ahmad F, Osterhout R, Galkin A, Bruey J, Carter L, Mpoy C, Vij K, Fields R, Schwarz J, Park H, Gupta V, DeNardo D | 2023 | Cancer Cell | Immuno-oncology | Area Quantification, Cytonuclear, Highplex FL | HALO |
| Clearance of senescent macrophages ameliorates tumorigenesis in KRAS-driven lung cancer | Haston S, Gonzalez-Gualda E, Morsli S, Ge J, Reen V, Calderwood A, Moutsopoulos I, Panousopoulos L, Deletic P, Carreno G, Guiho R, Manshaei S, Gonzalez-Meljem J, Lim H, Simpson D, Birch J, Pallikonda H, Chandra T, Macias D, Doherty G, Rassl D, Rintoul R, Signore M, Mohorianu I, Akbar A, Gil J, Muñoz-Espín D, Martinez-Barbera J | 2023 | Cancer Cell | Oncology | Cytonuclear | HALO |
| Apolipoprotein E induces pathogenic senescent-like myeloid cells in prostate cancer | Bancaro N, Cali B, Troiani M, Elia A, Arzola R, Attanasio G, Lai P, Crespo M, Gurel B, Pereira R, Guo C, Mosole S, Brina D, D'Ambrosio M, Pasquini E, Spataro C, Zagato E, Rinaldi A, Pedotti M, Lascio S, Meani F, Montopoli M, Ferrari M, Gallina A, Varani L, Mestre R, Bolis M, Sommer S, de Bono J, Calcinotto A, Alimonti A | 2023 | Cancer Cell | Oncology | Classifier, Highplex FL | HALO |
| Lineage tracing reveals clonal progenitors and long-term persistence of tumor-specific T cells during immune checkpoint blockade | Pai J, Hellmann M, Sauter J, Mattar M, Rizvi H, Woo H, Shah N, Nguyen E, Uddin F, Quintanal-Villalonga A, Chan J, Manoj P, Allaj V, Baine M, Bhanot U, Jain M, Linkov I, Meng F, Brown D, Chaft J, Plodkowski A, Gigoux M, Won H, Sen T, Wells D, Donoghue M, Stanchina E, Wolchok J, Loomis B, Merghoub T, Rudin C, Chow A, Satpathy A | 2023 | Cancer Cell | Immuno-oncology | Classifier | HALO |
| An immunogenic and oncogenic feature-based classification for chemotherapy plus PD-1 blockade in advanced esophageal squamous cell carcinoma | Chen Y, Wang Z, Jin Y, Zhao Q, Liu Z, Zuo Z, Ju H, Cui C, Yao J, Zhang Y, Li M, Feng J, Tian L, Xia X, Feng H, Yao S, Wang F, Li Y, Wang F, Xu R | 2023 | Cancer Cell | Immuno-oncology | Cytonuclear | HALO |
| Anti-PD-1 immunotherapy with androgen deprivation therapy induces robust immune infiltration in metastatic castration-sensitive prostate cancer | Hawley J E, Obradovic A Z, Dallos M C, Lim E A, Runcie K, Ager C R, McKiernan J, Anderson C B, Decastro G J, Weintraub J, Virk R, Lowy I, Hu J, Chaimowitz M G, Guo X V, Zhang Y, Haffner M C, Worley J, Stein M N, Califano A | 2023 | Cancer Cell | Immuno-oncology | Highplex FL | HALO |
| Integrated multi-omics profiling to dissect the spatiotemporal evolution of metastatic hepatocellular carcinoma | Sun Y, Wu P, Zhang Z, Wang Z, Zhou K, Song M, Ji Y, Zang F, Lou L, Rao K, Wang P, Gu Y, Gu J, Lu B, Chen L, Pan X, Zhao X, Peng L, Liu D, Chen X, Wu K, Lin P, Wu L, Su Y, Du M, Hou Y, Yang X, Qiu S, Shi Y, Sun H, Zhou J, Huang X, Peng D, Zhang L, Fan J | 2023 | Cancer Cell | Oncology | Classifier, Multiplex IHC, Spatial Analysis, Highplex FL | HALO |
| p38MAPKa stromal reprogramming sensitizes metastatic breast cancer to immunotherapy | Faget D, Luo X, Inkman M, Ren Q, Su X, Ding K, Waters M, Raut G, Pandey G, Dodhiawala P, Ramalho-Oliveira R, Ye J, Cole T, Murali B, Zheleznyak A, Shokeen M, Weiss K, Monahan J, DeSelm C, Lee A, Oesterreich S, Weilbaecher K, Zhang J, DeNardo D, Stewart S | 2023 | Cancer Discovery | Immuno-oncology | Area Quantification | HALO |
| Targeting intracellular oncoproteins with dimeric IgA promotes expulsion from the cytoplasm and immune-mediated control of epithelial cancers | Biswas S, Mandal G, Anadon C M, Chaurio R A, Lopez-Bailon L U, Nagy M Z, Mine J A, Hanggi K, Sprenger K B, Innamarato P, Harro C M, Powers J J, Johnson J, Fang B, Eysha M, Nan X, Li R, Perez B A, Curiel T J, Yu X, Rodriguez P C, Conejo-Garcia J R | 2023 | Immunity | Oncology | Multiplex IHC | HALO |
| The tumor-derived cytokine Chi3l1 induces neutrophil extracellular traps that promote T cell exclusion in triple-negative breast cancer | Taifour T, Attalla SS, Zuo D, Gu Y, Sanguin-Gendreau V, Proud H, Solymoss E, Bui T, Kuasne H, Papavasiliou V, Lee CG, Kamle S, Siegel PM, Elias JA, Park M, Muller WJ | 2023 | Immunity | Immuno-oncology | Multiplex IHC, Spatial Analysis, Highplex FL | HALO |
| Vascular-Parenchymal Crosstalk Promotes Lung Fibrosis Through BMPR2 Signaling | Yanagihara T, Tsubouchi K, Zhou Q, Chong M, Otsubo K, Isshiki T, Schupp J, Sato S, Scallan C, Upagupta C, Revill S, Ayoub A, Chong S, Dvorkin-Gheva A, Kaminski N, Tikkanen J, Keshavjee S, Pare G, Guignabert C, Ask K, Kolb M | 2023 | American Journal of Respiratory and Critical Care Medicine | Fibrosis | ISH, TMA | HALO |
| Fibrosis induced by resident macrophages has divergent roles in pancreas inflammatory injury and PDAC | Baer JM, Zuo C, Kang LI, Alarcon de la Lastra A, Borcherding NC, Knolhoff BL, Bogner SJ, Zhu Y, Yang L, Laurent J, Lewis MA, Zhang N, Kim KW, Fields RC, Yokoyama WM, Mills JC, Ding L, Randolph GJ, DeNardo DG | 2023 | Nature Immunology | Immunology | Multiplex IHC | HALO |
| LY6E is a pan-coronavirus restriction factor in the respiratory tract | Mar K, Wells A, Van Dyke M, Lopez A, Eitson J, Fan W, Hanners N, Evers B, Shelton J, Schoggins J | 2023 | Nature Microbiology | Infectious Disease | Multiplex IHC | HALO |
| Single-cell RNA-sequencing reveals heterogeneity and intercellular crosstalk in human tuberculosis lung | Wang, H, Wen, Z, Niu, L, Chen, X, Liu, H, Zhang, S, Xu, J, Zhu, Y, Li, H, Chen, H, Shi, L, Wan, L, Li, L, Li, M, Wong, K, Song, Y | 2023 | Journal of Infection | Immunology, Infectious Disease | Spatial Analysis, Highplex FL | HALO |
| Analysis of off-tumour toxicities of T-cell-engaging bispecific antibodies via donor-matched intestinal organoids and tumouroids | Harter MF, Recaldin T, Gerard R, Avignon B, Bollen Y, Esposito C, Guja-Jarosz K, Kromer K, Filip A, Aubert J, Schneider A, Bacac M, Bscheider M, Stokar-Regenscheit N, Piscuoglio S, Beumer J, Gjorevski N | 2023 | Nature Biomedical Engineering | Immuno-oncology | Highplex FL | HALO, HALO AI |
| Seeding the aggregation of TDP-43 requires post-fibrillization proteolytic cleavage | Kumar ST, Nazarov S, Porta S, Majarjan N, Cendrowska U, Kabani M, Finamore F, Xu Y, Lee VMY, Lashuel HA | 2023 | Nature Neuroscience | Neuroscience | Area Quantification, Highplex FL | HALO |
| Integrative multiomics enhancer activity profiling identifies therapeutic vulnerabilities in cholangiocarcinoma of different etiologies | Hong J, Yong C, Heng H, Chan J, Lau M, Chen J, Lee J, Lim A, Li Z, Guan P, Chu P, Boot A, Ng S, Yao X, Wee F, Lim J, Liu W, Wang P, Xiao R, Zeng X, Sun Y, Koh J, Kwek X, Ng C, Klanrit P, Zhang Y, Lai J, Tai D, Pairojkul C, Dima S, Popescu I, Hsieh S, Yu M, Yeong J, Kongpetch S, Jusakul A, Loilome W, Tan P, Tan J, Teh B | 2023 | Gut | Oncology | Highplex FL | HALO |
| Fucosylation of HLA-DRB1 regulates CD4+ T cell-mediated anti-melanoma immunity and enhances immunotherapy efficacy | Lester D, Burton C, Gardner A, Innamarato P, Kodumudi K, Liu Q, Adhikari E, Ming Q, Williamson D, Frederick D, Sharova T, White M, Markowitz J, Cao B, Nguyen J, Johnson J, Beatty M, Mockabee-Macias A, Mercurio M, Watson G, Chen P-L, McCarthy S, MoranSegura C, Messina J, Thomas K, Darville L, Izumi V, Koomen J, Pilon-Thomas S, Ruffell B, Luca V, Haltiwanger R, Wang X, Wargo J, Boland G, Lau E | 2023 | Nature Cancer | Immuno-oncology | Registration | HALO |
| Targeting pancreatic cancer metabolic dependencies through glutamine antagonism | Encarnación-Rosado J, Sohn A S W, Biancur D E, Lin E Y, Osorio-Vasquez V, Rodrick T, González-Baerga D, Zhao E, Yokoyama Y, Simeone D M, Jones D R, Parker S J, Wild R, Kimmelman A C | 2023 | Nature Cancer | Oncology | Highplex FL | HALO, HALO AI |
| SARS-CoV-2 infection induces DNA damage, through CHK1 degradation and impaired 53BP1 recruitment, and cellular senescence | Gioia U, Tavella S, Martinez-Orellana P, Cicio G, Colliva A, Ceccon M, Cabrini M, Henriques A, Fumagalli V, Paldino A, Presot E, Rajasekharan S, Iacomino N, Pisati F, Matti V, Sepe S, Conte M, Barozzi S, Lavagnino Z, Carletti T, Volpe M, Cavalcante P, Iannacone M, Rampazzo C, Bussani R, Tripodo C, Zacchigna S, Marcello A, di Fagagna F | 2023 | Nature Cell Biology | Infectious Disease | ISH/FISH, Highplex FL | HALO |
| Inhibition of the proline metabolism rate-limiting enzyme P5CS allows proliferation of glutamine-restricted cancer cells | Linder S, Bernasocchi T, Martínez-Pastor B, Sullivan K, Galbraith M, Lewis C, Ferrer C, Boon R, Silveira G, Cho H, Vidoudez C, Shroff S, Oliveira-Costa J, Ross K, Massri R, Matoba Y, Kim E, Rueda B, Stott S, Gottlieb E, Espinosa J, Mostoslavsky R | 2023 | Nature Metabolism | Oncology, Metabolism | Multiplex IHC, Registration | HALO |
| Spatial Transcriptomics Reveals Distinct Tissue Niches Linked with Steroid Responsiveness in Acute Gastrointestinal GVHD | Patel BK, Raabe MJ, Lang ER, Song Y, Lu C, Deshpande V, Nieman LT, Aryee MJ, Chen YB, Ting DT, DeFilipp Z | 2023 | Blood | Immunology | ISH | HALO |
| Spatial Mapping of Human Hematopoiesis at Single Cell Resolution Reveals Aging-Associated Topographic Remodeling | Sarachakov A, Varlamova A, Svelolkin V, Polyakova M, Valencia I, Unkenholz C, Pannellini T, Galkin I, Ovcharov P, Tabakov D, Postovalova E, Shin N, Sethi I, Bagaev A, Itkin T, Crane GM, Kluk MJ, Geyer JT, Inghirami GGA, Patel SS | 2023 | Blood | Other | Registration | HALO |
| Plaque Macrophage-Targeting Nanosystems with Cooperative Co-Regulation of ROS and TRAF6 for Stabilization of Atherosclerotic Plaques | Yang Q, Jiang H, Wang Y, Leng X, Wang Y, Tong J, Zhou Y, Mo C, Peng J, Gao H | 2023 | Advanced Functional Materials | Biomaterials | Highplex FL | HALO |
| Morphology-guided transcriptomic analysis of human pancreatic cancer organoids reveals microenvironmental signals that enhance invasion | Jeong Y, Knutsdottir H, Shojaeian F, Lerner M, Wissler M, Henriet E, Ng T, Datta S, Navarro-Serer B, Chianchiano P, Kinny-Koster B, Zimmerman J, Stein-O'Brien G, Gaida M, Eshleman J, Lin M, Fertig E, Ewald A, Bader J, Wood L | 2023 | The Journal of Clinical Investigation | Oncology | Multiplex IHC | HALO |
| Carcinogen exposure enhances cancer immunogenicity by blocking the development of an immunosuppressive tumor microenvironment | Huang M, Xia Y, Li K, Shao F, Feng Z, Li T, Azin M, Demehri S | 2023 | The Journal of Clinical Investigation | Immuno-oncology | Highplex FL | HALO |
| MYC is a clinically significant driver of mTOR inhibitor resistance in breast cancer | Bhin J, Yemelyanenko J, Chao X, Klarenbeek S, Opdam M, Malka Y, Hoekman L, Kruger D, Bleijerveld O, Brambillasca CS, Sprengers J, Siteur B, Annunziato S, van Haren MJ, Martin NI, van de Ven M, Peters D, Agami R, Linn SC, Boven E, Altelaar M, Jonkers J, Zingg D, Wessels LFA | 2023 | Journal of Experimental Medicine | Oncology | Multiplex IHC | HALO |
| Spatial mapping reveals granuloma diversity and histopathological superstructure in human tuberculosis | Sawyer A, Patrick E, Edwards J, Wilmott J, Fielder T, Yang Q, Barber D, Ernst J, Britton W, Palendira U, Chen X, Feng C | 2023 | Journal of Experimental Medicine | Immunology | Multiplex IHC, Spatial Analysis, Highplex FL | HALO |
| Functional specialization of short-lived and long-lived macrophage subsets in human tonsils | Alaoui L, Villar J, Leclere R, Le Gallou S, Relouzat F, Michaud H, Tarte K, Teissier N, Favier B, Roussel M, Segura E | 2023 | Journal of Experimental Medicine | Immunology | Highplex FL | HALO |
| Stromal and therapy-induced macrophage proliferation promotes PDAC progression and susceptibility to innate immunotherapy | Zuo Chong, Baer J, Knolhoff B, Belle J, Liu X, De La Lastra A, Fu C, Hogg G, Kingston N, Breden M, Dodhiawala P, Zhou D, Lander V, James C, Ding L, Lim K, Fields R, Hawkins W, Wber J, Zhao G, DeNardo D | 2023 | Journal of Experimental Medicine | Immuno-oncology | Highplex FL | HALO |
| Secreted mammalian DNases protect against systemic bacterial infection by digesting biofilms | Lacey K, Serpas L, Makita S, Wang Y, Rashidfarrokhi A, Soni C, Gonzalez S, Moreira A, Torres V, Reizis B | 2023 | Journal of Experimental Medicine | Infectious Disease | HALO, HALO AI | |
| Tumor-associated fibrosis impairs immune surveillance and response to immune checkpoint blockade in non–small cell lung cancer | Herzog B, Baer J, Borcherding N, Kingston N, Belle J, Knolhoff B, Hogg G, Ahmad F, Kang L, Petrone J, Lin C, Govindan R, Denardo D | 2023 | Science Translational Medicine | Oncology | Classifier, Multiplex IHC | HALO |
| The tumor microenvironment state associates with response to HPV therapeutic vaccination in patients with respiratory papillomatosis | NORBERG S, BAI K, SIEVERS C, ROBBINS Y, FRIEDMAN J, YANG X, KENYON M, WARD E, SCHLOM J, GULLEY J, LANKFORD A, SEMNANI R, SABZEVARI H, BROUGH D, ALLEN C | 2023 | Science Translational Medicine | Oncology | Classifier, Highplex FL | HALO |
| Tissue-specific features of the T cell repertoire after allogeneic hematopoietic cell transplantation in human and mouse | DeWolf S, Elhanati Y, Nichols K, Waters N R, Nguyen C L, Slingerland J B, Rodriguez N, Lyudovyk O, Giardina P A, Kousa A I, Andrlová H, Ceglia N, Fei T, Kappagantula R, Li Y, Aleynick N, Baez P, Murali R, Hayashi A, Lee N, Gipson B, Rangesa M, Katsamakis Z, Dai A, Blouin A G, Arcila M, Masilionis I, Chaligné R, Ponce D M, Landau H J, Politikos I, Tamari R, Hanash A M, Jenq R R, Giralt S A, Markey K A, Zhang Y, Perales M-A, Socci N D, Greenbaum B D, Iacobuzio-Donahue C A, Hollmann T J, van den Brink M R M, Peled J U | 2023 | Science Translational Medicine | Immunology | Highplex FL | HALO |
| Therapeutic neutralizing monoclonal antibody administration protects against lethal yellow fever virus infection | RICCIARDI M, RUST L, PEDREÑO-LOPEZ N, YUSOVA S, BISWAS S, WEBB G, GONZALEZ-NIETO L, VOIGT T, LOUW J, LAURINO F, DIBELLO J, RAUÉ H, BARBER-AXTHELM A, CHUN K, UTTKE S, RAPHAEL L, YRIZARRY-MEDINA A, ROSEN B, AGNOR R, GAO L, LABRIOLA C, AXTHELM M, SMEDLEY J, JULANDER J, BONALDO M, WALKER L, MESSAOUDI I, SLIFKA M, BURTON D, KALLAS E, SACHA J, WATKINS D, BURWITZ B | 2023 | Science Translational Medicine | Infectious Disease | HALO Link | |
| A microtubule stabilizer ameliorates protein pathogenesis and neurodegeneration in mouse models of repetitive traumatic brain injury | Zhao X, Zeng W, Xu H, Sun Z, Hu Y, Peng B, McBride JD, Duan J, Deng J, Zhang B, Kim SJ, Zoll B, Saito T, Sasaguri H, Saido TC, Ballatore C, Yao H, Wang Z, Trojanowski JQ, Brunden KR, Lee VMY, He Z | 2023 | Science Translational Medicine | Neuroscience | Area Quantification, Object Colocalization, Multiplex IHC | HALO |
| Lymphoid tissues contribute to plasma viral clonotypes early after antiretroviral therapy interruption in SIV-infected rhesus macaques | Solis-Leal A, Boby N, Mallick S, Cheng Y, Wu F, de la Torre G, Dufour J, Alvarez X, Shivanna V, Liu Y, Fennessey C M, Lifson J D, Li Q, Keele B F, and Ling B | 2023 | Science Translational Medicine | Infectious Disease | HALO | |
| Aberrant gene activation in synovial sarcoma relies on SSX specificity and increased PRC1.1 stability | Benabdallah NS, Dalal V, Scott RW, Marcous F, Sotiriou A, Kommoss FKF, Pejkovska A, Gaspar L, Wagner L, Sánchez-Rivera FJ, Ta M, Thornton S, Nielsen TO, Underhill TM, Banito A | 2023 | Nature Structural & Molecular Biology | Oncology | Multiplex IHC, TMA | HALO, HALO AI |
| CRISPR–Cas9-based functional interrogation of unconventional translatome reveals human cancer dependency on cryptic non-canonical open reading frames | Zheng C, Wei Y, Zhang P, Lin K, He D, Teng H, Manyam G, Zhang Z, Liu W, Lee H R L, Tang X, He W, Islam N, Jain A, Chiu Y, Cao S, Diao Y, Meyer-Gauen S, Höök M, Malovannaya A, Li W, Hu M, Wang W, Xu H, Kopetz S, Chen Y | 2023 | Nature Structural & Molecular Biology | Oncology | ISH | HALO |
| Transcriptional vulnerabilities of striatal neurons in human and rodent models of Huntington’s disease | Matsushima A, Pineda S, Crittenden J, Lee H, Galani K, Mantero J, Tombaugh G, Kellis M, Heiman M, Graybiel A | 2023 | Nature Communications | Neuroscience | Area Quantification, ISH-IHC/FISH-IF | HALO |
| MAIT cell inhibition promotes liver fibrosis regression via macrophage phenotype reprogramming | Mabire M, Hegde P, Hammoutene A, Wan J, Caër C, Al Sayegh R, Cadoux M, Allaire M, Weiss E, Thibault-Sogorb T, Lantz O, Goodhardt M, Paradis V, de la Grange P, Gilgenkrantz H, and Lotersztajn S | 2023 | Nature Communications | Gastroenterology | Area Quantification | HALO |
| Booster with Ad26.COV2.S or Omicron-adapted vaccine enhanced immunity and efficacy against SARS-CoV-2 Omicron in macaques | Solforosi L, Costes L, Tolboom J, McMahan K, Anioke T, Hope D, Murdza T, Sciacca M, Bouffard E, Barrett J, Wu C, Hachmann N, Miller J, Yu J, He X, Jacob-Dolan C, Rosendahl Huber S, Dekking L, Chamanza R, Choi Y, Feddes-de Boer K, Barouch D, Schuitemaker H, Zahn R, and Wegmann F | 2023 | Nature Communications | Infectious Disease | HALO Link | |
| Disrupting the α-synuclein-ESCRT interaction with a peptide inhibitor mitigates neurodegeneration in preclinical models of Parkinson’s disease | Nim S, O'Hara D, Corbi-Verge C, Perez-Riba A, Fujisawa K, Kapadia M, Chau H, Albanese F, Pawar G, De Snoo M, Ngana S, Kim J, El-Agnaf O, Rennella E, Kay L, Kalia S, Kalia L, Kim P | 2023 | Nature Communications | Neuroscience | Area Quantification | HALO |
| Neural mechanism of acute stress regulation by trace aminergic signalling in the lateral habenula in male mice | Yang S, Yang E, Lee J, Kim J, Yoo H, Park H, Jung J, Lee D, Chun S, Jo Y, Pyeon G, Park J, Lee H, Kim H | 2023 | Nature Communications | Neuroscience | FISH | HALO |
| Spatial metabolomics reveals glycogen as an actionable target for pulmonary fibrosis | Conroy L, Clarke H, Allison D, Valenca S, Sun Q, Hawkinson T, Young L, Ferreira J, Hammonds A, Dunne J, McDonald R, Absher K, Dong B, Bruntz R, Markussen K, Juras J, Alilain W, Liu J, Gentry M, Angel P, Waters C, Sun R | 2023 | Nature Communications | Fibrosis | Multiplex IHC, Highplex FL | HALO |
| Spatial analysis with SPIAT and spaSim to characterize and simulate tissue microenvironments | Feng Y, Yang T, Zhu J, Li M, Doyle M, Ozcoban V, Bass G, Pizzolla A, Cain L, Weng S, Pasam A, Kocovski N, Huang Y, Keam S, Speed T, Neeson P, Pearson R, Sandhu S, Goode D, Trigos A | 2023 | Nature Communications | Other | Highplex FL | HALO |
| Kv7/KCNQ potassium channels in cortical hyperexcitability and juvenile seizure-related death in Ank2-mutant mice | Oh H, Lee S, Oh Y, Kim S, Kim Y, Yang Y, Choi W, Yoo Y, Cho H, Lee S, Yang E, Koh W, Won W, Kim R, Lee C, Kim H, Kang H, Kim J, Ku T, Paik S, Kim E | 2023 | Nature Communications | Neuroscience | FISH | HALO |
| Cellular mechanisms of heterogeneity in NF2-mutant schwannoma | Chiasson-MacKenzie C, Vitte J, Liu C, Wright E, Flynn E, Stott S, Giovannini M, McClatchey A | 2023 | Nature Communications | Oncology | Classifier, Multiplex IHC, Spatial Analysis, FISH-IF | HALO |
| In vivo induction of activin A-producing alveolar macrophages supports the progression of lung cell carcinoma | Taniguchi S, Matsui T, Kimura K, Funaki S, Miyamoto Y, Uchida Y, Sudo T, Kikuta J, Hara T, Motooka D, Liu Y-C, Okuzaki D, Morii E, Emoto N, Shintani Y, Ishii M | 2023 | Nature Communications | Immuno-oncology | Multiplex IHC | HALO |
| Polycomb deficiency drives a FOXP2-high aggressive state targetable by epigenetic inhibitors | Chen F, Byrd A, Liu J, Flight R, DuCote T, Naughton K, Song X, Edgin A, Lukyanchuk A, Dixon D, Gosser C, Esoe D-P, Jayswal R, Orkin S, Moseley H, Wang C, Brainson C | 2023 | Nature Communications | Oncology | Multiplex IHC | HALO, HALO AI |
| Dissecting the immune suppressive human prostate tumor microenvironment via integrated single-cell and spatial transcriptomic analyses | Hirz T, Mei S, Sarkar H, Kfoury Y, Wu S, Verhoeven B, Subtelny A, Zlatev D, Wszolek M, Salari K, Murray E, Chen F, Macosko E, Wu C, Scadden D, Dahl D, Baryawno N, Saylor P, Kharchenko P, Sykes D | 2023 | Nature Communications | Immuno-oncology | Highplex FL | HALO |
| YBX1 integration of oncogenic PI3K/mTOR signalling regulates the fitness of malignant epithelial cells | Bai Y, Gotz C, Chincarini G, Zhao Z, Slaney C, Boath J, Furic L, Angel C, Jane S, Phillips W, Stacker S, Farah C, Darido C | 2023 | Nature Communications | Oncology | Classifier, Multiplex IHC | HALO |
| Genome-wide mapping of cancer dependency genes and genetic modifiers of chemotherapy in high-risk hepatoblastoma | Fang J, Singh S, Cheng C, Natarajan S, Sheppard H, Abu-Zaid A, Durbin A, Lee H, Wu Q, Steele J, Connelly J, Jin H, Chen W, Fan Y, Pruett-Miller S, Rehg J, Koo S, Santiago T, Emmons J, Cairo S, Wang R, Glazer E, Murphy A, Chen T, Davidoff A, Armengol C, Easton J, Chen X, Yang J | 2023 | Nature Communications | Oncology | HALO | |
| Driver gene combinations dictate cutaneous squamous cell carcinoma disease continuum progression | Bailey P, Ridgway RA, Cammareri P, Treanor-Taylor M, Bailey UM, Schoenherr C, Bone M, Schreyer D, Purdie K, Thomson J, Rickaby W, Jackstadt R, Campbell AD, Dimonitsas E, Stratigos AJ, Arron ST, Wang J, Blyth K, Proby CM, Harwood CA, Sansom OJ, Leigh IM, and Inman GJ | 2023 | Nature Communications | Oncology | Cytonuclear | HALO |
| Comprehensive analysis reveals potential therapeutic targets and an integrated risk stratification model for solitary fibrous tumors | Zhang R, Yang Y, Hu C, Huang M, Cen W, Ling D, Long Y, Yang X-H, Xu B, Peng J, Wang S, Zhu W, Wei M, Yang J, Xu Y, Zhang X, Ma J, Wang F, Zhang H, Ma P, Zhu X, Song G, Sun L-Y, Wang D-S, Wang F-H, Li Y-H, Santagata S, Li Q, Feng Y-F, Du Z | 2023 | Nature Communications | Oncology | Multiplex IHC | HALO |
| Unaltered hepatic wound healing response in male rats with ancestral liver injury | Beil J, Perner J, Pfaller L, Gérard M, Piaia A, Doelemeyer A, Wasserkrug Naor A, Martin L, Piequet A, Dubost V, Chibout S, Moggs J, Terranova R | 2023 | Nature Communications | Other | Classifier, Area Quantification | HALO, HALO AI |
| Chiral metal-organic frameworks incorporating nanozymes as neuroinflammation inhibitors for managing Parkinson’s disease | Jiang W, Li Q, Zhang R, Li J, Lin Q, Li J, Zhou X, Yan X, Fan K | 2023 | Nature Communications | Neuroscience | Area Quantification | HALO |
| Coordinated activation of c-Src and FOXM1 drives tumor cell proliferation and breast cancer progression | Nandi I, Smith H, Sanguin-Gendreau V, Ji L, Pacis A, Papavasiliou V, Zuo D, Nam S, Attala S, Kim S, Lusson S, Kuasne H, Fortier A, Savage P, Ramirez C, Park M, Katzenellenbogen J, Katzenellenbogen B, Muller W | 2023 | Journal of Clinical Investigation | Oncology | Highplex FL | HALO |
| Immune checkpoint blockade induces distinct alterations in the microenvironments of primary and metastatic brain tumors | Sun L, Kienzler JC, Reynoso JG, Lee A, Shiuan E, Li S, Kim J, Ding L, Monteleone AJ, Owens GC, Phillips JJ, Everson RG, Nathanson D, Cloughesy TF, Li G, Liau LM, Hugo W, Kim W, Prins RM | 2023 | Journal of Clinical Investigation | Immuno-oncology | Highplex FL | HALO |
| Regulation of antigen-specific T cell infiltration and spatial architecture in multiple myeloma and premalignancy | Robinson MH, Villa NY, Jaye DL, Nooka AK, Duffy A, McCachren SS, Manalo J, Switchenko JM, Barnes S, Potdar S, Azeem MI, Horvat AA, Parihar VC, Gong J, Liang Y, Smith GH, Gupta VA, Boise LH, Kaufman JL, Hofmeister CC, Joseph NS, Lonial S, Dhodapkar KM, Dhodapkar MV | 2023 | Journal of Clinical Investigation | Immuno-oncology | Highplex FL | HALO |
| Integrative multi-omics reveals two biologically distinct groups of pilocytic astrocytoma | Picard D, Felsberg J, Langini M, Stachura P, Qin N, Macas J, Reiss Y, Bartl J, Selt F, Sigaud R, Meyer FD, Stefanski A, Stühler K, Roque L, Roque R, Pandyra AA, Brozou T, Knobbe-Thomsen C, Plate KH, Roesch A, Milde T, Reifenberger G, Leprivier G, Faria CC, Remke M | 2023 | Acta Neuropathologica | Oncology | Highplex FL | HALO |
| Amyloid-β (Aβ) immunotherapy induced microhemorrhages are associated with activated perivascular macrophages and peripheral monocyte recruitment in Alzheimer’s disease mice | Taylor X, Clark I, Fitzgerald G, Oluoch H, Hole J, DeMattos R, Wang Y, Pan F | 2023 | Molecular Neurodegeneration | Immuno-oncology, Neuroscience | Area Quantification | HALO |
| Tau-RNA complexes inhibit microtubule polymerization and drive disease-relevant conformation change | McMillan P, Benbow S, Uhrich R, Saxton A, Baum M, Strovas T, Wheeler J, Baker J, Liachko N, Keene C, Latimer C, Kraemer B | 2023 | Brain | Neuroscience | Area Quantification | HALO |
| GRK2 inhibits Flt-1+ macrophage infiltration and its proangiogenic properties in rheumatoid arthritis | Yang X, Zhao Y, Wei Q, Zhu X, Wang L, Zhang W, Liu X, Kuai J, Wang F, Wei W | 2023 | Acta Pharmaceutica Sinica B | Immunology | Highplex FL | HALO |
| Distinct Involvement of the Cranial and Spinal Nerves in Progressive Supranuclear Palsy | Tanaka H, Martinez-Valbuena I, Forrest SL, Couto B, Reyes NG, Morales-Rivero A, Lee S, Li J, Karakani AM, Tang-Wai DF, Tator C, Khadadadi M, Sadia N, Tartaglia MC, Lang AE, Kovacs GG | 2023 | Brain | Neuroscience | Object Colocalization | HALO |
| Multiplex immune profiling reveals the role of serum immune proteomics in predicting response to preoperative chemotherapy of gastric cancer | Tang Z, Gu Y, Shi Z, Min L, Zhang Z, Zhou P, Luo R, Wang Ym, Cui Y, Sun Y, Wang X | 2023 | Cell Reports Medicine | Immuno-oncology | Highplex FL | HALO |
| GRP78-CAR T cell effector function against solid and brain tumors is controlled by GRP78 expression on T cells | Ibanez J, Hebbar N, Thanekar U, Yi Z, Houke H, Ward M, Nevitt C, Tian L, Mack SC, Sheppard H, Chiang J, Velasquez MP, Krenciute G | 2023 | Cell Reports Medicine | Immuno-oncology | Multiplex IHC | HALO |
| Fusion-negative rhabdomyosarcoma 3D organoids to predict effective drug combinations: A proof-ofconcept on cell death inducers | Savary C, Luciana L, Huchede´ P, Tourbez A, Coquet C, Broustal M, Gonzalez AL, Deligne C, Diot T, Naret O, Costa M, Meynard N, Barbet V, Muller K, Tonon L, Gadot N, Degletagne C, Attignon V, Le´on S, Vanbelle C, Bomane A, Rochet I, Mournetas V, Oliveira L, Rinaudo P, Bergeron C, Dutour A, Cordier-Bussat M, Roch A, Brandenberg N, El Zein S, Watson S, Orbach D, Delattre O, Dijoud F, Corradini N, Picard C, Maucort-Boulch D, Le Grand M, Pasquier E, Blay JY, Castets M, and Broutier L. | 2023 | Cell Reports Medicine | Oncology | Multiplex IHC | HALO |
| Nicotinamide N-methyltransferase sustains a core epigenetic program that promotes metastatic colonization in breast cancer | Pinto Couto J, Vulin M, Jehanno C, Coissieux M, Hamelin B, Schmidt A, Ivanek R, Sethi A, Bräutigam K, Frei A, Hager C, Manivannan M, Gómez-Miragaya J, Obradović M, Varga Z, Koelzer V, Mertz K, Bentires-Alj M | 2023 | The EMBO Journal | Oncology | Area Quantification, Multiplex IHC | HALO, HALO AI |
| Single-cell dissection of cervical cancer reveals key subsets of the tumor immune microenvironment | Cao G, Yue J, Ruan Y, Han Y, Zhi Y, Lu J, Liu M, Xu X, Wang J, Gu Q, Wen X, Gao J, Zhang Q, Kang J, Wang C, Li F | 2023 | The EMBO Journal | Immuno-oncology | Highplex FL | HALO |
| Baseline skin cytokine profiles determined by RNA in situ hybridization correlate with response to dupilumab in patients with eczematous dermatitis | Singh K, Valido K, Swallow M, Okifo K, Wang A, Cohen J, Damsky W | 2023 | Journal of the American Academy of Dermatology | Dermatology | ISH | HALO |
| Single-cell and spatial transcriptome analysis reveals the cellular heterogeneity of liver metastatic colorectal cancer | Wang F, Long J, Li L, Wu Z, Da T, Wang X, Huang C, Jiang Y, Yao X, Ma H, Lian Z, Zhao Z, Cao J | 2023 | Science Advances | Oncology | Multiplex IHC, Spatial Analysis, Highplex FL | HALO |
| Tumor-derived semaphorin 4A improves PD-1–blocking antibody efficacy by enhancing CD8+ T cell cytotoxicity and proliferation | NAITO Y, KOYAMA S, MASUHIRO K, HIRAI T, UENAMI T, INOUE T, OSA A, MACHIYAMA H, WATANABE G, SAX N, VILLA J, KINUGASA-KATAYAMA Y, NOJIMA S, YAGA M, HOSONO Y, OKUZAKI D, SATOH S, TSUDA T, NAKANISHI Y, SUGA Y, MORITA T, FUKUSHIMA K, NISHIDE M, SHIROYAMA T, MIYAKE K, IWAHORI K, HIRATA H, NAGATOMO I, YANO Y, TAMIYA M, KUMAGAI T, TAKEMOTO N, INOHARA H, YAMASAKI S, YAMASHITA K, AOSHI T, AKBAY E, HOSEN N, SHINTANI Y, TAKAMATSU H, MORI M, TAKEDA Y, KUMANOGOH A | 2023 | Science Advances | Immuno-oncology | Multiplex IHC, Highplex FL | HALO |
| Quantitative intravital imaging for real-time monitoring of pancreatic tumor cell hypoxia and stroma in an orthotopic mouse model | Samuel T, Rapic S, O'Brien C, Edson M, Zhong Y, DaCosta R | 2023 | Science Advances | Oncology | Registration | HALO |
| Patient-derived exosomes facilitate therapeutic targeting of oncogenic MET in advanced gastric cancer | Hyung S, Ko J, Heo YJ, Blum SM, Kim ST, Park SH, Park JO, Kang WK, Lim HY, Klempner SJ, Lee J | 2023 | Science Advances | Oncology | Highplex FL | HALO |
| A monoclonal antibody activating AdipoR for type 2 diabetes and nonalcoholic steatohepatitis | Asahara N, Okada-Iwabu M, Iwabu M, Wada K, Oka K, Yamauchi T, Kadowaki T | 2023 | Science Advances | Gastroenterology | Vacuole | HALO |
| A Cdh3-β-catenin-laminin signaling axis in a subset of breast tumor leader cells control leader cell polarization and directional collective migration | Hwang P, Mathur J, Cao Y, Almeida J, Ye J, Morikis V, Cornish D, Clarke M, Stewart S, Pathak A, Longmore G | 2023 | Developmental Cell | Oncology | Highplex FL, Registration | HALO |
| Outdoor air pollution and histologic composition of normal breast tissue | Ish J, Abubakar M, Fan S, Jones R, Niehoff N, Henry J, Gierach G, White A | 2023 | Environment International | Oncology | Classifier | HALO |
| Intracranial injection of natural killer cells engineered with a HER2-targeted chimeric antigen receptor in patients with recurrent glioblastoma | Burger M, Forster M, Romanski A, Straßheimer F, Macas J, Zeiner P, Steidl E, Herkt S, Weber K, Schupp J, Lun J, Strecker M, Wlotzka K, Cakmak P, Opitz C, George R, Mildenberger I, Nowakowska P, Zhang C, Röder J, Müller E, Ihrig K, Langen K, Rieger M, Herrmann E, Bonig H, Harter P, Reiss Y, Hattingen E, Rödel F, Plate K, Tonn T, Senft C, Steinbach J, Wels W | 2023 | Neuro-Oncology | Immuno-oncology | Highplex FL | HALO |
| A cellular and molecular spatial atlas of dystrophic muscle | Stec M, Su Q, Adler C, Zhang L, Golann D, Khan N, Panagis L, Villalta S, Ni M, Wei Y, Walls J, Murphy A, Yancopoulos G, Atwal G, Kleiner S, Halasz G, Sleeman M | 2023 | Proceedings of the National Academy of Sciences | Myology | ISH, Highplex FL | HALO |
| A TIAM1- TRIM28 complex mediates epigenetic silencing of protocadherins to promote migration of lung cancer cells | Ginn L, Maltas J, Baker MJ, Chaturvedi A, Wilson L, Guilbert R, Amaral FMR, Priest L, Mole H, Blackhall F, Diamantopoulou Z, Somervaille TCP, Hurlstone A, Mallairi A | 2023 | Proceedings of the National Academy of Sciences | Oncology | Multiplex IHC | HALO |
| ATR-binding lncRNA ScaRNA2 promotes cancer resistance through facilitating efficient DNA end resection during homologous recombination repair | Chen Y, Shen H, Liu T, Cao K, Wan Z, Du Z, Wang H, Yu Y, Ma S, Lu E, Zhang W, Cai J, Gao F, Yang Y | 2023 | Journal of Experimental & Clinical Cancer Research | Oncology | Highplex FL, TMA | HALO |
| Liver cancer stem cell dissemination and metastasis: uncovering the role of NRCAM in hepatocellular carcinoma | Zhou L, He L, Liu C, Qiu H, Zheng L, Sample KM, Wu Q, Li J, Xie K, Ampuero J, Li Z, Lv D, Liu M, Romero-Gómez M, Hu Y, Tang H | 2023 | Journal of Experimental & Clinical Cancer Research | Oncology | Highplex FL | HALO |
| Inulin-like polysaccharide ABWW may impede CCl4 induced hepatic stellate cell activation through mediating the FAK/PI3K/AKT signaling pathway in vitro & in vivo | Dai X, Du Z, Jin C, Tang B, Chen X, Jing X, Shen Y, He F, Wang S, Li J, Ding K, Zang Y | 2023 | Carbohydrate Polymers | Fibrosis | Area Quantification | HALO |
| Pseudoknot-targeting Cas13b combats SARSCoV-2 infection by suppressing viral replication | Yu D, Han H, Yu J, Kim J, Lee G, Yang J, Song B, Tark D, Choi B, Kang S, Heo W | 2023 | Molecular Therapy | Infectious Disease | ISH, FISH-IF | HALO |
| Data-driven identification of total RNA expression genes for estimation of RNA abundance in heterogeneous cell types highlighted in brain tissue | Huuki-Myers L, Montgomery KD, Kwon SH, Page SC, Hicks SC, Maynard KR, Collado-Torres L | 2023 | Genome Biology | Other | FISH-IF | HALO |
| Fecal microbiota transplanted from old mice promotes more colonic inflammation, proliferation, and tumor formation in azoxymethane-treated A/J mice than microbiota originating from young mice | Crossland NA, Beck S, Tan WY, Lo M, Mason JB, Zhang C, Guo W, Crott JW | 2023 | Gut Microbes | Other | Area Quantification, Highplex FL | HALO |
| Acute Influenza Infection Promotes Lung Tumor Growth by Reprogramming the Tumor Microenvironment | Garmendia I, Varthaman A, Marmier S, Angrini M, Matchoua I, Darbois-Delahousse A, Josseaume N, Foy P, Roumenina L, Naouar N, Meylan M, Siberil S, Russick J, Joubert P, Leroy K, Damotte D, Mansuet-Lupo A, Wislez M, Alifano M, Menger L, Garcia-Verdugo I, Sallenave J, Lantz O, Petitprez F, Cremer I | 2023 | Cancer Immunology Research | Oncology, Infectious Disease | Highplex FL | HALO |
| Combination IFNβ and membrane-stable CD40L maximize tumor dendritic cell activation and lymph node trafficking to elicit systemic T-cell immunity | Zheng H, Yu X, Ibrahim M, Foresman D, Xie M, Johnson J, Boyle T, Ruffell B, Perez B, Antonia S, Ready N, Saltos A, Cantwell M, Beg A | 2023 | Cancer Immunology Research | Immuno-oncology | Highplex FL | HALO |
| Targeting the IL1β Pathway for Cancer Immunotherapy Remodels the Tumor Microenvironment and Enhances Antitumor Immune Responses | Diwanji R, O'Brien N, Choi J, Nguyen B, Laszewski T, Grauel A, Yan Z, Xu X, Wu J, Ruddy D, Piquet M, Pelletier M, Savchenko A, Charette L, Rodrik-Outmezguine V, Baum J, Millholland J, Wong C, Martin A, Dranoff G, Pruteanu-Malinici I, Cremasco V, Sabatos-Peyton C, Jayaraman P | 2023 | Cancer Immunology Research | Immuno-oncology | Multiplex IHC | HALO |
| Circulating and intratumoral immune determinants of response to atezolizumab plus bevacizumab in patients with variant histology or sarcomatoid renal cell carcinoma | Saliby R, Zarif T, Bakouny Z, Shah V, Xie W, Flippot R, Denize T, Kane M, Madsen K, Ficial M, Hirsch L, Wei X, Steinarter J, Harshman L, Vaishampayan U, Severgnini M, McDermott D, Lee G, Xu W, Van Allen E, McGregor B, Signoretti S, Choueiri T, McKay R, Braun D | 2023 | Cancer Immunology Research | Immuno-oncology | Highplex FL | HALO |
| Cholesterol efflux drives the generation of immunosuppressive macrophages to promote the progression of human hepatocellular carcinoma | Li Z, Wang Y, Xing R, Zeng H, Yu X, Zhang Y, Xu J, Zheng L | 2023 | Cancer Immunology Research | Immuno-oncology | Multiplex IHC, Highplex FL | HALO |
| Combined CDK4/6 and ERK1/2 inhibition enhances anti-tumor activity in NF1-associated plexiform neurofibroma | Flint AC, Mitchell DK, Angus SP, Smith AE, Bessler W, Jiang L, Mang H, Li X, Lu Q, Rodriguez B, Sandusky GE, Masters AR, Zhang C, Dang P, Koenig J, Johnson GL, Shen W, Liu J, Aggarwal A, Donoho GP, Willard MD, Bhagwat SV, Clapp DW, Rhodes SD | 2023 | Clinical Cancer Research | Neuroscience | Cytonuclear | HALO |
| An Immune-Related Gene Expression Signature Predicts Benefit from Adding Atezolizumab to FOLFOXIRI plus Bevacizumab in Metastatic Colorectal Cancer | Antoniotti C, Boccaccino A, Seitz R, Giordano M, Catteau A, Rossini D, Pietrantonio F, Salvatore L, McGregor K, Bergamo F, Conca V, Leonetti S, Morano F, Papiani G, Tamburini E, Bensi M, Murgioni S, Ross D, Passardi A, Boquet I, Nielsen T, Galon J, Varga M, Schweitzer B, and Cremolini C | 2023 | Clinical Cancer Research | Immuno-oncology | Multiplex IHC, Spatial Analysis | HALO |
| Trackable Intratumor Microdosing and Spatial Profiling Provide Early Insights into Activity of Investigational Agents in the Intact Tumor Microenvironment | Derry J, Burns C, Frazier J, Beirne E, Grenley M, DuFort C, Killingbeck E, Leon M, Williams C, Gregory M, Houlton J, Clayburgh D, Swiecicki P, Huszar D, Berger A, Klinghoffer R | 2023 | Clinical Cancer Research | Oncology | Highplex FL | HALO, HALO AI |
| Poor outcome in postpartum breast cancer patients is associated with distinct molecular and immunological features | Lefrère H, Moore K, Floris G, Sanders J, Seignette I, Bismeijer T, Peters D, Broeks A, Hooijberg E, Van Calsteren K, Neven P, Warner E, Peccatori F, Loibl S, Maggen C, Han S, Jerzak K, Annibali D, Lambrechts D, de Visser K, Wessels L, Lenaerts L, Amant F | 2023 | Clinical Cancer Research | Oncology | Classifier, Highplex FL | HALO, HALO AI |
| Anticoagulants Enhance Molecular and Cellular Immunotherapy of Cancer by Improving Tumor Microcirculation Structure and Function and Redistributing Tumor Infiltrates | Wei F, Su Y, Quan Y, Li X, Zou Q, Zhang L, Li S, Jiang M, Lin G, Liang P, He J, Xie K | 2023 | Clinical Cancer Research | Immuno-oncology | Classifier, Multiplex IHC, Spatial Analysis, Highplex FL | HALO |
| Increased Nerve Density Adversely Affects Outcome in Oral Cancer | Perez-Pacheco C, Schmitd L, Furgal A, Bellile E, Liu M, Fattah A, Gonzalez-Maldonado L, Unsworth S, Wong S, Rozek L, Rao A, Wolf G, Taylor J, Casper K, Mierzwa M, D'Silva N | 2023 | Clinical Cancer Research | Oncology | HALO, HALO AI | |
| Phase I Study of SYNB1891, an Engineered E. coli Nissle Strain Expressing STING Agonist, with and without Atezolizumab in Advanced Malignancies | Luke J, Piha-Paul S, Medina T, Verschraegen C, Varterasian M, Brennan A, Rise R, Sokolovska A, Strauss J, Hava D, Janku F | 2023 | Clinical Cancer Research | Immuno-oncology | Area Quantification | HALO |
| Bavituximab decreases immunosuppressive myeloid-derived suppressor cells in newly diagnosed glioblastoma patients | Ly K, Richardson L, Liu M, Muzikansky A, Cardona J, Lou K, Beers A, Chang K, Brown J, Ma X, Reardon D, Arrillaga-Romany I, Forst D, Jordan J, Lee E, Dietrich J, Nayak L, Wen P, Chukwueke U, Giobbie-Hurder A, Choi B, Batchelor T, Kalpathy-Cramer J, Curry W, Gerstner E | 2023 | Clinical Cancer Research | Immuno-oncology | Highplex FL | HALO |
| Tumor Microenvironment Modifications Induced by Afatinib in Squamous Cell Carcinoma of the Head and Neck: A Window-of-Opportunity Study (EORTC-90111–24111) | Beyaert SP, Loriot AE, Huyghe ND, Goebbels RM, Mendola A, Govaerts AS, Fortpied C, Baldin P, Licitra LF, Lalami Y, Clement PM, Machiels JPH, Schmitz S | 2023 | Clinical Cancer Research | Oncology | Highplex FL | HALO |
| Characterization of immunosuppressive myeloid cells in Merkel cell carcinoma: correlation with resistance to PD-1 pathway blockade. | Tabachnick-Cherny S, Pulliam T, Rodriguez H, Fan X, Hippe D, Jones D, Moshiri A, Smythe K, Kulikauskas R, Zaba L, Paulson K, Nghiem P | 2023 | Clinical Cancer Research | Immuno-oncology | Highplex FL | HALO |
| Strategies for studying immune and non-immune human and canine mammary gland cancer tumour infiltrate | Rodríguez-Bejarano O H, Roa L, Vargas-Hernández G, Botero-Espinosa L, Parra-López C, Patarroyo M A | 2023 | Biochimica et Biophysica Acta (BBA) - Reviews on Cancer | Review | HALO | |
| Distinct Patterns of Hippocampal Pathology in Alzheimer's Disease with Transactive Response DNA-binding Protein 43 | Minogue G, Kawles A, Zouridakis A, Keszycki R, Macomber A, Lubbat V, Gill N, Mao Q, Flanagan ME, Zhang H, Castellani R, Bigio EH, Mesulam M-M, Geula C, Gefen T | 2023 | Annals of Neurology | Neuroscience | Object Colocalization | HALO |
| Endocrine therapy synergizes with SMAC mimetics to potentiate antigen presentation and tumor regression in hormone receptor-positive breast cancer | Hermida-Prado F, Xie Y, Sherman S, Nagy Z, Russo D, Akhshi T, Chu Z, Feit A, Campisi M, Chen M, Nardone A, Guarducci C, Lim K, Font-Tello A, Lee I, García-Pedrero J, Canadas I, Agudo J, Huang Y, Sella T, Jin Q, Tayob N, Mittendorf E, Tolaney S, Qiu X, Long H, Symmans W, Lin J, Santagata S, Bedrosian I, Yardley D, Mayer I, Richardson E, Oliveira G, Wu C, Schuster E, Dowsett M, Welm A, Barbie D, Metzger O, Jeselsohn R | 2023 | Cancer Research | Oncology | Multiplex IHC | HALO |
| Single-cell characterization of pulmonary nodules implicates suppression of immunosurveillance across early stages of lung adenocarcinoma | Yanagawa J, Tran L, Salehi-Rad R, Lim R, Dumitras C, Fung E, Wallace W, Prosper A, Fishbein G, Shea C, Hong R, Kahangi B, Deng J, Gower A, Liu B, Campbell J, Mazzilli S, Beane J, Kadara H, Lenburg M, Spira A, Aberle D, Krysan K, Dubinett S | 2023 | Cancer Research | Immuno-oncology | Highplex FL | HALO |
| Targeting the metabolic enzyme PGAM2 overcomes enzalutamide resistance in castration-resistant prostate cancer by inhibiting BCL2 signaling | Li Z, Ning K, Zhao D, Zhou Z, Zhao J, Long X, Yang Z, Chen D, Cai X, Hong L, Zhang L, Zhou F, Wang J, Li Y | 2023 | Cancer Research | Oncology | Multiplex IHC | HALO |
| Bi-allelic mutation in SEC16B alters collagen trafficking and increases ER stress | El-Gazzar A, Voraberger B, Rauch F, Mairhofer M, Schmidt K, Guillemyn B, Mitulovic G, Reiterer V, Haun M, Mayr M, Mayr J, Kimeswenger S, Drews O, Saraff V, Shaw N, Fratzl-Zelman N, Symoens S, Farhan H, Hogler W | 2023 | EMBO Molecular Medicine | Other | Area Quantification, Highplex FL | HALO |
| ACE2-independent SARS-CoV-2 virus entry through cell surface GRP78 on monocytes – evidence from a translational clinical and experimental approach | Han B, Lv Y, Moser D, Zhou X, Woehrle T, Han L, Osterman A, Rudelius M, Choukér A, Lei P | 2023 | EBioMedicine | Infectious Disease | Highplex FL | HALO |
| Immunoscore immune checkpoint using spatial quantitative analysis of CD8 and PD-L1 markers is predictive of the efficacy of anti- PD1/PD-L1 immunotherapy in non-small cell lung cancer | Ghiringhelli F, Bibeau F, Greillier L, Fumet J, Ilie A, Monville F, Laugé C, Catteau A, Boquet I, Majdi A, Morgand E, Oulkhouir Y, Brandone N, Adam J, Sbarrato T, Kassambara A, Fieschi J, Garcia S, Lepage A, Tomasini P, Galon J | 2023 | EBioMedicine | Immuno-oncology | Multiplex IHC, Spatial Analysis | HALO |
| Construction and Mechanism of IL-15-based Co-Activated Polymeric Micelles for NK Cell Immunotherapy | Shao D, Bai T, Zhu B, Guo X, Dong K, Shi J, Huang Q, Kong J | 2023 | Advanced Healthcare Materials | Immuno-oncology | Highplex FL | HALO |
| Detection of IL12/23p40 via PET Visualizes Inflammatory Bowel Disease | Rezazadeh F, Ramos N, Saliganan A, Al-Hallak N, Chen K, Mohamad B, Wiesend W, Viola N | 2023 | Journal of Nuclear Medicine | Immunology | ISH | HALO |
| Remodeling Tumor Immune Microenvironment by Using Polymer-Lipid-Manganese Dioxide Nanoparticles with Radiation Therapy to Boost Immune Response of Castration-Resistant Prostate Cancer | Zetrini AE, Lip H, Abbasi AZ, Alradwan I, Ahmed T, He C, Henderson JT, Rauth AM, Wu XY | 2023 | Research | Immuno-oncology, Biomaterials | Highplex FL | HALO |
| Desialylated platelet clearance in the liver is a novel mechanism of systemic immunosuppression | Li J, Karakas D, Xue F, Chen Y, Zhu G, Ycel Y, MacParland S, Zhang H, Semple J, Freedman J, Shi Q, Ni H | 2023 | Research | Immunology | Area Quantification | HALO |
| Dissecting tumor lymphocyte infiltration to predict benefit from immune-checkpoint inhibitors in metastatic colorectal cancer: lessons from the AtezoTRIBE study | Moretto R, Rossini D, Catteau A, Antoniotti C, Giordano M, Boccaccino A, Ugolini C, Proietti A, Conca V, Kassambara A, Pietrantonio F, Salvatore L, Lonardi S, Tamberi S, Tamburini E, Poma A, Fieschi J, Fontanini G, Masi G, Galon J, Cremolini C | 2023 | Journal for ImmunoTherapy of Cancer | Immuno-oncology | Multiplex IHC, Spatial Analysis | HALO |
| Synergistic therapeutic combination with a CAF inhibitor enhances CAR-NK-mediated cytotoxicity via reduction of CAF-released IL-6 | Lee Y, Go G, Koh E, Yoon H, Seo M, Hong S, Jeong J, Kim J, Cho D, Kim T, Kim S, Jun E, Jang M | 2023 | Journal for ImmunoTherapy of Cancer | Immuno-oncology | Area Quantification | HALO |
| Spatial multi-omics revealed the impact of tumor ecosystem heterogeneity on immunotherapy efficacy in patients with advanced non-small cell lung cancer treated with bispecific antibody | Song X, Xiong A, Wu F, Li X, Wang J, Jiang T, Chen P, Zhang X, Zhao Z, Liu H, Cheng L, Zhao C, Wang Z, Pan C, Cui X, Xu T, Luo H, Zhou C | 2023 | Journal for ImmunoTherapy of Cancer | Immuno-oncology | Highplex FL | HALO |
| High tumor mutational burden predicts favorable response to anti-PD-(L)1 therapy in patients with solid tumor: a real-world pan-tumor analysis | Jung J, Heo Y, Park S | 2023 | Journal for ImmunoTherapy of Cancer | Immuno-oncology | Spatial Analysis, Highplex FL | HALO |
| Immune and pathologic responses in patients with localized prostate cancer who received daratumumab (anti-CD38) or edicotinib (CSF-1R inhibitor) | Siddiqui B, Chapin B, Jindal S, Duan F, Basu S, Yadav S, Gu A, Espejo A, Kinder M, Pettaway C, Ward J, Tidwell R, Troncoso P, Corn P, Logothetis C, Knoblauch R, Hutnick N, Gottardis M, Drake C, Sharma P, Subudhi S | 2023 | Journal for ImmunoTherapy of Cancer | Immuno-oncology | Multiplex IHC, Figure Maker | HALO |
| Cancer cell genotype associated tumor immune microenvironment exhibits differential response to therapeutic STING pathway activation in high-grade serous ovarian cancer | Shakfa N, Li D, Conseil G, Lightbody E, Wilson-Sanchez J, Hamade A, Chenard S, Jawa N, Laight B, Afriyie-Asante A, Tyryshkin K, Koebel M, and Koti M | 2023 | Journal for ImmunoTherapy of Cancer | Oncology | Highplex FL | HALO, HALO Link |
| Geospatial characterization of immune cell distributions and dynamics across the microenvironment in clear cell renal cell carcinoma | Chakiryan N, Kim Y, Berglund A, Chang A, Kimmel G, Hajiran A, Nguyen J, Moran-Segura C, Saeed-Vafa D, Katende E, Lopez-Blanco N, Chahoud J, Rappold P, Spiess P, Fournier M, Jeong D, Wang L, Teer J, Dhillon J, Kuo F, Hakimi A, Altrock P, Mulé J, Manley B | 2023 | Journal for ImmunoTherapy of Cancer | Immuno-oncology | Highplex FL | HALO |
| Characterization of intratumoral tertiary lymphoid structures in pancreatic ductal adenocarcinoma: cellular properties and prognostic significance | Zou X, Lin X, Cheng H, Chen Y, Wang R, Ma M, Liu Y, Dai Z, Tasiheng Y, Yan Y, Hou Q, Ding F, Chen H, Yu X, Wang X, Liu C | 2023 | Journal for ImmunoTherapy of Cancer | Immuno-oncology | Highplex FL | HALO, HALO AI |
| Low molecular weight heparin synergistically enhances the efficacy of adoptive and anti-PD-1-based immunotherapy by increasing lymphocyte infiltration in colorectal cancer | Quan Y, He J, Zou Q, Zhang L, Sun Q, Huang H, Li W, Xie K, Wie F | 2023 | Journal for ImmunoTherapy of Cancer | Immuno-oncology | Classifier, Multiplex IHC, Highplex FL | HALO |
| Classification of the tumor immune microenvironment and associations with outcomes in patients with metastatic melanoma treated with immunotherapies | Adegoke N, Gide T, Mao Y, Quek C, Patrick E, Carlino M, Lo S, Menzies A, da Silva P, Vergara I, Long G, Scolyer R, Wilmott J | 2023 | Journal for ImmunoTherapy of Cancer | Immuno-oncology | Classifier, Highplex FL | HALO |
| Immune microenvironment of basal cell carcinoma and tumor regression following combined PD-1/LAG-3 blockade | Deutsch JS, Lai J, Schenk KM, Soni A, Will EM, Engle LL, Xu H, Ogurtsova A, Madan V, Chong JK, Wang D, Green BF, Nguyen P, Schollenberger MD, Lipson EJ, Taube JM | 2023 | Journal for ImmunoTherapy of Cancer | Immuno-oncology | Multiplex IHC | HALO |
| NADK-mediated de novo NADP(H) synthesis is a metabolic adaptation essential for breast cancer metastasis | Ilter D, Drapela S, Schild T, Ward N, Adhikari E, Low V, Asara J, Oskarsson T, Lau E, DeNicola G, McReynolds M, Gomes A | 2023 | Redox Biology | Oncology, Metabolism | Classifier, Highplex FL, TMA | HALO |
| In vitro and In vivo evidence demonstrating chronic absence of Ref-1 Cysteine 65 impacts Ref-1 folding configuration, redox signaling, proliferation and metastasis in pancreatic cancer | Mijit M, Kpenu E, Chowdhury N, Gampala S, Wireman R, Liu S, Babb O, Georgiadis M, Wan J, Fishel M, Kelley M | 2023 | Redox Biology | Oncology | Classifier | HALO |
| Sustained delivery of a heterodimer bone morphogenetic protein-2/7 via a collagen hydroxyapatite scaffold accelerates and improves critical femoral defect healing | Liu Y, Puthia M, Sheehy E, Ambite I, Petrlova J, Prithviraj S, Oxborg M, Sebastian S, Vater C, Zwingenberger S, Struglics A, Bourgine P, O'Brien F, Raina D | 2023 | Acta Biomaterialia | Biomaterials | Area Quantification, Figure Maker | HALO |
| Nucleolin mediates SARS-CoV-2 replication and viral-induced apoptosis of host cells | Merino V, Yan Y, Ordonez A, Bullen C, Lee A, Saeki H, Ray K, Huang T, Jain S, Pomper M | 2023 | Antiviral Research | Infectious Disease | Area Quantification | HALO |
| The antiviral effects of a MEK1/2 inhibitor promote tumor regression in a preclinical model of human papillomavirus infection-induced tumorigenesis | Luna A, Young J, Sterk R, Bondu V, Schultz F, Kusewitt D, Kang H, Ozbun M | 2023 | Antiviral Research | Oncology, Infectious Disease | Area Quantification, Cytonuclear | HALO |
| ASK1 inhibitors are potential pan-antiviral drugs, which dampen replication of diverse viruses including SARS-CoV2 | Demian W, Jacob R, Cormier O, Nazli A, Melki M, Asavajaru A, Baid K, Zhang A, Miller M, Kaushic C, Banerjee A, Mossman K | 2023 | Antiviral Research | Infectious Disease | Area Quantification | HALO |
| An international multi-institutional validation study of the algorithm for prostate cancer detection and Gleason grading | Tolkach Y, Ovtcharov V, Pryalukhin A, Eich ML, Gaisa NT, Braun M, Radzhabov A, Quaas A, Hammerer P, Dellmann A, Hulla W, Haffner MC, Reis H, Fahoum I, Samarska I, Borbat A, Pham H, Heidenreich A, Klein S, Netto G, Caie P, Buettner R | 2023 | Precision Oncology | Oncology | HALO, HALO AI | |
| Tumor‐derived Vimentin as a novel biomarker for distinct subtypes predicting adjuvant chemotherapy resistance and T‐cell‐inflamed phenotype in small cell lung cancer | Deng C, Wang Y, Fu F, Li D, Zheng Q, Jin Y, Li Y, Chen H, Zhang Y | 2023 | MedComm | Oncology | Highplex FL | HALO |
| Deep radiomics-based fusion model for prediction of bevacizumab treatment response and outcome in patients with colorectal cancer liver metastases: a multicentre cohort study | Zhou S, Sun D, Mao W, Liu Y, Cen W, Ye L, Liang F, Xu J, Shi H, Ji Y, Wang L, Chang W | 2023 | eClinicalMedicine | Oncology | Classifier, Multiplex IHC | HALO |
| Genetic models of cleavage-reduced and soluble TREM2 reveal distinct effects on myelination and microglia function in the cuprizone model | Beckmann N, Neuhaus A, Zurbruegg S, volkmer P, Patino C, Joller S, Feuerbach D, Doelemeyer A, Schweizer T, Rudin S, Nuemann U, Berth R, Frieauff W, Gasparani F, Shimshek D | 2023 | Journal of Neuroinflammation | Neuroscience | Area Quantification | HALO |
| Cannabinoids modulate the microbiota–gut–brain axis in HIV/SIV infection by reducing neuroinflammation and dysbiosis while concurrently elevating endocannabinoid and indole-3-propionate levels | McDew-White M, Lee E, Premadasa L, Alvarez X, Okeoma C, Mohan M | 2023 | Journal of Neuroinflammation | Neuroscience, Infectious Disease | Area Quantification | HALO |
| Atorvastatin rescues hyperhomocysteinemia-induced cognitive deficits and neuroinflammatory gene changes | Weekman E, Johnson S, Rogers C, Sudduth T, Xie K, Qiao Q, Fardo D, Bottiglieri T, Wilcock D | 2023 | Journal of Neuroinflammation | Neuroscience | Object Colocalization | HALO |
| Mucin 4 is a cellular biomarker of necrotizing bronchiolitis in influenza A virus infection | Arruda B, Kanefsky R, Hau S, Janzen G, Anderson T, Baker A | 2023 | Microbes and Infection | Infectious Disease | Area Quantification | HALO |
| Inhibition of indoleamine dioxygenase leads to better control of tuberculosis adjunctive to chemotherapy | Singh B, Moodley C, Singh D, Escobedo R, Sharan R, Arora G, Ganatra S, Shivanna V, Gonzalez O, Hall-Ursone S, Dick Jr. E, Kaushal D, Alvarez X, Mehra S | 2023 | JCI Insight | Infectious Disease, Fibrosis | Area Quantification, Highplex FL | HALO |
| IL13RA2 downregulation in fibroblast promotes keloid fibrosis via JAK/STAT6 activation | Chao H, Zheng L, Hsu P, He J, Wu R, Xu S, Zeng R, Zhou Y, Ma H, Liu H, Tang Q | 2023 | JCI Insight | Fibrosis | Multiplex IHC | HALO |
| Cannabinoid enhancement of lncRNA MMP25-AS1/MMP25 interaction reduces neutrophil infiltration and intestinal epithelial injury in HIV/SIV infection | Premadasa L, Lee E, McDew-White M, Alvarez X, Jayakumar S, Ling B, Okeoma C, Byrareddy S, Kulkarni S, and Mohan M | 2023 | JCI Insight | Infectious Disease | Area Quantification, Highplex FL | HALO |
| CNS-dominant human FMRP isoform rescues seizures, fear, and sleep abnormalities in Fmr1-KO mice | Wong H, Hooper A, Kang H, Lee S, Zhao J, Sadhu C, Rawat S, Gray S, Hampson D | 2023 | JCI Insight | Neuroscience | Area Quantification | HALO |
| HIF-1 regulates pathogenic cytotoxic T cells in lupus skin disease | Little A, Chen P, Vesely M, Khan R, Fiedler J, Garritano J, Maisha F, McNiff J, Craft J | 2023 | JCI Insight | Immunology, Dermatology | FISH-IF | HALO, HALO AI |
| Skeletal phenotype amelioration in Mucopolysaccharidosis VI requires intervention at the earliest stages of postnatal development | Hwang-Wong E, Amar G, Das N, Zhang X, Aaron N, Gale K, Rothman N, Fante M, Baik A, Bhargava A, Fricker A, McAlister M, Rabinowitz J, Lees-Shepard J, Nannuru K, Economides AN, Cygnar KD | 2023 | JCI Insight | Other | Vacuole | HALO |
| Donor IL-17 receptor A regulates LPS-potentiated acute and chronic murine lung allograft rejection | Watanabe T, Juvet SC, Berra G, Havlin J, Zhong W, Boonstra K, Daigneault T, Horie M, Konoeda C, Teskey G, Guan Z, Hwang DM, Liu M, Keshavjee S, Martinu T | 2023 | JCI Insight | Immunology, Fibrosis | Area Quantification | HALO |
| Single-cell profiling reveals pathogenic role and differentiation trajectory of granzyme K+ CD8+T cells in primary Sjögren’s syndrome | Xu T, Zhu H, Ma J, Li X, Luo P, Li Y, Lian Z, Gao C | 2023 | JCI Insight | Immunology | Highplex FL | HALO |
| TSLP/dendritic cell axis promotes CD4+ T cell tolerance to the gut microbiome | Messerschmidt J, Azin M, Dempsey K, Demehri S | 2023 | JCI Insight | Immunology | Highplex FL | HALO |
| Intratumoral aluminum hydroxide–anchored IL-12 drives potent antitumor activity by remodeling the tumor microenvironment | Battula S, Papastoitsis G, Kaufman HL, Wittrup KD, Schmidt MM | 2023 | JCI Insight | Oncology | Multiplex IHC | HALO |
| Single cell G-protein coupled receptor profiling of activated kidney fibroblasts expressing transcription factor 21 | Kaur H, Yerra VG, Batchu SN, Tran DT, Kabir MDG, Liu Y, Advani SL, Sedrak P, Geldenhuys L, Tennankore KK, Poyah P, Siddiqi FS, Advani A | 2023 | British Journal of Pharmacology | Fibrosis | Area Quantification | HALO |
| A proteome-wide screen identifies the calcium binding proteins, S100A8/S100A9, as clinically relevant therapeutic targets in aortic dissection | Jiang H, Zhao Y, Su M, Sun L, Chen M, Zhang Z, Ilyas I, Wang Z, Little P J, Wang L, Weng J, Ge J, Xu S | 2023 | Pharmacological Research | Other | HALO | |
| Berberine inhibits high fat diet-associated colorectal cancer through modulation of the gut microbiota-mediated lysophosphatidylcholine | Chen H, Ye C, Wu C, Zhang J, Xu L, Wang X, Xu C, Zhang J, Guo Y, Yao Q | 2023 | International Journal of Biological Sciences | Oncology, Metabolism | Multiplex IHC | HALO |
| Exploration of spatial heterogeneity of tumor microenvironment in nasopharyngeal carcinoma via transcriptional digital spatial profiling | Wang L, Wang D, Zeng X, Zhang Q, Wu H, Liu J, Wang Y, Liu G, Poan Y | 2023 | International Journal of Biological Sciences | Oncology | Area Quantification | HALO |
| Development of a deep pathomics score for predicting hepatocellular carcinoma recurrence after liver transplantation | Qu W, Tian M, Lu H, Zhou Y, Liu W, Tang Z, Yao Z, Huang R, Zhu G, Jiang X, Tao C, Fang Y, Gao J, Wu X, Chen J, Zhao Q, Yang R, Chu T, Zhou J, Fan J, Yu J, Shi Y | 2023 | Hepatology International | Oncology | Spatial Analysis, Highplex FL | HALO |
| Activation of IGFBP4 via unconventional mechanism of miRNA attenuates metastasis of intrahepatic cholangiocarcinoma | Tao L, Wang Y, Shen Z, Cai J, Zheng J, Xia S, Lin Z, Wan Z, Qi H, Jin R, Wang L, Xu J, Liang X | 2023 | Hepatology International | Oncology | Highplex FL | HALO |
| Donor Batf3 inhibits murine lung allograft rejection and airway fibrosis | Watanabe T, Lam C, Oliver J, Oishi H, Teskey G, Beber S, Boonstra K, Mauricio J, Buhari H, Joe B, Guan Z, Horie M, Keshavjee S, Martinu T, Juvet S | 2023 | Mucosal Immunology | Other, Fibrosis | Highplex FL | HALO |
| Notch3 regulates Mybl2 via HeyL to limit proliferation and tumor initiation in breast cancer | Brahim S, Negulescu A, Geneste C, Schott T, Lin S, Morel L, Rama N, Gadot N, Treilleux I, Mehlen P, Meurette O | 2023 | Cell Death & Disease | Oncology | Multiplex IHC | HALO |
| Inhibition of mitochondrial fission activates glycogen synthesis to support cell survival in colon cancer | Hasani S, Young LEA, Van Nort W, Banerjee M, Rivas DR, Kim J, Xiong X, Sun RC, Gentry MS, Sesaki H, Gao T | 2023 | Cell Death & Disease | Oncology | Multiplex IHC | HALO |
| Endosomal Escape Vehicle Platform Enhances the Delivery of Oligonucleotides in Preclinical Models of Neuromuscular Disorders | Li X, Kheirabadi M, Dougherty P, Kamer K, Shen X, Estrella N, Peddigari S, Pathak A, Blake S, Sizensky E, del Genio C, Gaur A, Dhanabal M, Girgenrath M, Sethuraman N, Qian Z | 2023 | Molecular Therapy: Nucleic Acids | Neuroscience | Multiplex IHC | HALO |
| mRNA Vaccine Trafficking and Resulting Protein Expression After Intramuscular Administration | Hassett KJ, Rajilic IL, Bahl K, White R, Cowens K, Jacquinet E, Burke KE | 2023 | Molecular Therapy: Nucleic Acids | Other | ISH, Multiplex IHC | HALO |
| Phase I/II sequencing study of azacitidine, epacadostat, and pembrolizumab in advanced solid tumors | Luke J, Fakih M, Schneider C, Chiorean E, Bendell J, Kristeleit R, Kurzrock R, Blagden S, Brana I, Goff L, O'Hayer K, Geschwindt R, Smith M, Zhou F, Naing A | 2023 | British Journal of Cancer | Immuno-oncology | Multiplex IHC | HALO, HALO AI |
| Tumor microenvironment-mediated immune profiles and efficacy of anti-PD-L1 antibody plus chemotherapy stratified by DLL3 expression in small-cell lung cancer | Shirasawa M, Yoshida T, Shiraishi K, Goto N, Yagishita S, Imabayashi T, Matsumoto Y, Masuda K, Shinno Y, Okuma Y, Goto Y, Horinouchi H, Yotsukura M, Yoshida Y, Nakagawa K, Naoki K, Tsuchida T, Hamamoto R, Yamamoto N, Motoi N, Kohno T, Watanabe SI, Ohe Y | 2023 | British Journal of Cancer | Immuno-oncology | Multiplex IHC | HALO |
| Enlarged tumour-draining lymph node with immune-activated profile predict favourable survival in non-metastatic colorectal cancer | Guan X, Cheng P, Wei R, Li J, Jiao S, Zhao Z, Chen H, Liu Z, Jiang Z, Zheng Z, Zou S, Wang X | 2023 | British Journal of Cancer | Oncology | Multiplex IHC | HALO |
| An Fc-muted bispecific antibody targeting PD-L1 and 4-1BB induces antitumor immune activity in colorectal cancer without systemic toxicity | Cheng L, Zhu M, Gao Y, Liu W, Yin W, Zhou P, Zhu Z, Niu L, Zeng X, Zhang D, Fang Q, Wang F, Zhao Q, Zhang Y, Shen G | 2023 | Cellular and Molecular Biology Letters | Immuno-oncology | Multiplex IHC, Highplex FL | HALO |
| Co-enrichment of CD8-positive T cells and macrophages is associated with clinical benefit of tislelizumab in solid tumors | Ye D, Desai J, Shi J, Liu S, Shen W, Liu T, Shi Y, Wang D, Liang L, Yang S, Ma X, Jin W, Zhang P, Huang R, Shen Z, Zhang Y, Wu Y | 2023 | Biomarker Research | Immuno-oncology | Spatial Analysis, Highplex FL | HALO |
| Differential expression of CD8 defines phenotypically distinct cytotoxic T cells in cancer and multiple sclerosis | Burkard T, Herrero San Juan M, Dreis C, Kiprina A, Namgaladze D, Siebenbrodt K, Luger S, Foerch C, Pfeilschifter J, Weigert A, Radeke H | 2023 | Clinical and Translational Medicine | Oncology, Immunology | Classifier, Spatial Analysis, Highplex FL, TMA | HALO |
| RFX6 facilitates aerobic glycolysis‐mediated growth and metastasis of hepatocellular carcinoma through targeting PGAM1 | Qiu Z, Wang C, Huang P, Yuan Y, Shi Y, Lin Z, Huang Z, Zuo D, Qiu J, He W, Shen J, Niu Y, Yuan Y, Li B | 2023 | Clinical and Translational Medicine | Oncology | Multiplex IHC | HALO |
| IL17A mRNA staining distinguishes palmoplantar psoriasis from hyperkeratotic palmoplantar eczema in diagnostic skin biopsies | Chen J, Murphy M, Singh K, Wang A, Chow R, Kim S, Cohen J, Ko C, Damsky W | 2023 | JID Innovations | Dermatology | ISH | HALO |
| Clinical, histopathological and molecular features of dedifferentiated melanomas: An EORTC Melanoma Group Retrospective Analysis | Hench J, Mihic-Probst D, Agaimy A, Frank S, Meyer P, Hultschig C, Simi S, Alos L, Balamurugan T, Blokx W, Bosisio F, Cappellesso R, Griewank K, Hadaschik E, van Kempen LC, Kempf W, Lentini M, Mazzucchelli L, Rinaldi G, Rutkowski P, and Massi D | 2023 | European Journal of Cancer | Oncology | HALO Link | |
| Impact of second opinion pathology review in the diagnosis and management of atypical melanocytic lesions: A prospective study of the Italian Melanoma Intergroup (IMI) and EORTC Melanoma Group | Massi D, Szumera-Ciećkiewicz A, Alos L, Simi S, Ugolini F, Palmieri G, Stanganelli I, Cook M, Mandalà M | 2023 | European Journal of Cancer | Oncology | HALO Link | |
| Antimicrobial activity of yak beta-defensin 116 against Staphylococcus aureus and its role in gut homeostasis | Li B, Zhang L, Wang L, Wei Y, Guan J, Mei Q, Hao N | 2023 | International Journal of Biological Macromolecules | Infectious Disease | Area Quantification | HALO |
| Effects of a long-acting secretin peptide analog alone and in combination with a GLP-1R agonist in a diet-induced obesity mouse model | Loeffler M, Klepac K, Baljuls A, Hamilton B, Mayer-Wrangowski S, Haebel P, Zimmermann T | 2023 | Molecular Metabolism | Metabolism | Multiplex IHC | HALO |
| Immunomodulatory amnion-derived mesenchymal stromal cells preserve muscle function in a mouse model of Duchenne muscular dystrophy | Nitahara-Kasahara Y, Nakayama S, Kimura K, Yamaguchi S, Kakiuchi Y, Nito C, Hayashi M, Nakaishi T, Ueda Y, Okada T | 2023 | Stem Cell Research & Therapy | Myology | Area Quantification | HALO |
| An intestinal Th17 subset is associated with inflammation in Crohn’s Disease and activated by adherent-invasive Escherichia coli (AIEC) | Paroni M, Leccese G, Ranzani V, Moschetti G, Chiara M, Perillo F, Ferri S, Clemente F, Noviello D, Conforti FS, Ferrero S, Karnani B, Bosotti R, Vasco C, Curti S, Crosti MC, Gruarin P, Rossetti G, Conte MP, Vecchi M, Pagani M, Landini P, Facciotti F, Abrignani S, Caprioli F, Geginat J | 2023 | Journal of Crohn's and Colitis | Immunology | Highplex FL | HALO |
| GREB1 isoform 4 is specifically transcribed by MITF and required for melanoma proliferation | Shinzawa K, Matsumoto S, Sada R, Harada A, Saitoh K, Kato K, Ikeda S, Hirayama A, Yokoi K, Tanemura A, Nimura K, Ikawa M, Soga T, Kikuchi A | 2023 | Oncogene | Oncology | Multiplex IHC | HALO |
| Tertiary lymphoid structures in desmoplastic melanoma have increased lymphocyte density, lymphocyte proliferation, and immune cross talk with tumor when compared to non-desmoplastic melanomas | Edmonds N, Gradecki S, Katyal P, Lynch K, Stowman A, Gru A, Engelhard V, Slingluff Jr. C, Mauldin I | 2023 | OncoImmunology | Immuno-oncology | Highplex FL | HALO |
| Stem cell-like T cell depletion in the recurrent head and neck cancer immune microenvironment | Chen L, Lee N, Sarkar R, Katabi N, Li Y, Morris L, Wong R, Sherman E, Reis-Filho J, Hollmann T, Riaz N | 2023 | OncoImmunology | Immuno-oncology | Spatial Analysis, Highplex FL | HALO |
| Exocrine pancreas in type 1 and type 2 diabetes: different patterns of fibrosis, metaplasia, angiopathy, and adiposity | Wright J, Eskaros A, Windon A, Bottino R, Jenkins R, Bradley A, Aramandla R, Philips S, Kang H, Saunders D, Brissova M, Powers A | 2023 | Diabetes | Gastroenterology | Classifier, Highplex FL | HALO |
| Loss of Peroxiredoxin IV Protects Mice from Azoxymethane/Dextran Sulfate Sodium-Induced Colorectal Cancer Development | Thapa P, Jiang H, Ding N, Hao Y, Alshahrani A, Lee E, Fujii J, Wei Q | 2023 | Antioxidants | Oncology | Multiplex IHC | HALO |
| The localization of molecularly distinct microglia populations to Alzheimer's disease pathologies using QUIVER | Shahidehpour R, Nelson A, Sanders L, Embry C, Nelson P, Bachstetter A | 2023 | Acta Neuropathologica Communications | Neuroscience | Area Quantification, Object Colocalization, Spatial Analysis, Registration | HALO |
| ApoER2-Dab1 disruption as the origin of pTau-associated neurodegeneration in sporadic Alzheimer’s disease | Ramsden C, Zamora D, Horowitz M, Jahanipour J, Calzada E, Li X, Keyes G, Murray H, Curtis M, Faull R, Sedlock A, Maric D | 2023 | Acta Neuropathologica Communications | Neuroscience | Area Quantification, Object Colocalization | HALO |
| Single-cell analysis reveals changes in BCG vaccine-injected mice modeling tuberculous meningitis brain infection | Zhang X, Zhao Z, Wu Q, Wang L, Li L, Wang M, Ren Y, Pan L, Tang H, Li F | 2023 | Cell Reports | Infectious Disease | Multiplex IHC, Highplex FL | HALO |
| Defective extracellular matrix remodeling in brown adipose tissue is associated with fibro-inflammation and reduced diet-induced thermogenesis | Pellegrinelli V, Figueroa-Juárez E, Samuelson I, U-Din M, Rodriguez-Fdez S, Virtue S, Leggat J, Çubuk C, Peirce V, Niemi T, Campbell M, Rodriguez-Cuenca S, Dopazo Blázquez J, Carobbio S, Virtanen K, Vidal-Puig A | 2023 | Cell Reports | Metabolism | Classifier, Area Quantification, Vacuole | HALO |
| Multiplex Immunohistochemistry and Immunofluorescence: A Practical Update for Pathologists | Harms P, Frankel T, Moutafi M, Rao A, Rimm D, Taube J, Thomas D, Chang M, Pantanowitz L | 2023 | Modern Pathology | Review | Spatial Analysis, Highplex FL | HALO |
| Irreversible cell cycle exit associated with senescence is mediated by constitutive MYC degradation | Afifi M, Crncec A, Cornwell J, Cataisson C, Paul D, Ghorab L, Hernandez M, Wong M, Kedei N, Cappell S | 2023 | Cell Reports | Other | Cytonuclear | HALO, HALO AI |
| Differential effects of PGAM5 knockout on high fat high fructose diet and methionine choline-deficient diet induced non-alcoholic steatohepatitis (NASH) in mice | Li L, Guo C, Yu Y, Tie L, Lu G, Liu F, Han X, Ji L, Zou X | 2023 | Cell & Bioscience | Metabolism | Area Quantification | HALO |
| Effects of total flavones of Abelmoschus manihot (L.) on the treatment of diabetic nephropathy via the activation of solute carriers in renal tubular epithelial cells | Yu H, Tang H, Wang M, Xu Q, Yu J, Ge H, Qiang L, Tang W, Gu HF | 2023 | Biomedicine & Pharmacotherapy | Other | Multiplex IHC | HALO |
| Rosmarinic acid alleviate CORT-induced depressive-like behavior by promoting neurogenesis and regulating BDNF/TrkB/PI3K signaling axis | Zeng J, Xie Z, Chen L, Peng X, Luan F, Hu J, Xie H, Liu R, Zeng N | 2023 | Biomedicine & Pharmacotherapy | Neuroscience | Highplex FL | HALO |
| Single-cell RNA sequencing identifies a population of human liver-type ILC1s | Kramer B, Nalin A, Ma F, Eickoff S, Lutz P, Leonardelli S, Foeser F, Finnemann C, Hack G, Raabe J, ToVinh M, Ahmad S, Hoffmeister C, Kaiser K, Manekeller S, Branchi V, Bald T, Holzel M, Huneburg R, Nischalke H, Semaan A, Langhans B, Kaczmarek D, Benner B, Lordo M, Kowalski J, Gerhardt A, Timm J, Toma M, Mohr R, Turler A, Charpentier A, van Bremen T, Felmann G, Sattler A, Kotsch K, Abdallah A, Strassburg C, Spengler U, Carson W, Mundy-Bosse B, Pellegrini M, O'Sullivan T, Greud A, Nattermann J | 2023 | Cell Reports | Immunology | Highplex FL | HALO |
| TGF-β in the microenvironment induces a physiologically occurring immune-suppressive senescent state | Matsuda S, Revandkar A, Dubash T, Ravi A, Wittner B, Lin M, Morris R, Burr R, Guo H, Seeger K, Szabolcs A, Che D, Nieman L, Getz G, Ting D, Lawrence M, Gainor J, Haber D, Maheswaran S | 2023 | Cell Reports | Oncology | Area Quantification | HALO |
| The CD73 is induced by TGF-β1 triggered by nutrient deprivation and highly expressed in dedifferentiated human melanoma | Giraulo C, Turiello R, Orlando L, Leonardelli S, Landsberg J, Belvedere R, Rolshoven G, Muller C, Holzel M, Morello S | 2023 | Biomedicine & Pharmacotherapy | Oncology | Highplex FL, TMA | HALO, HALO AI |
| FOXC2 promotes vasculogenic mimicry and resistance to anti-angiogenic therapy | Cannell IG, Sawicka K, Pearsall I, Wild SA, Deighton L, Pearsall SM, Lerda G, Joud F, Khan S, Bruna A, Simpson KL, Mulvey CM, Nugent F, Qosaj F, Bressan D, Team6 C, Dive C, Caldas C, Hannon GJ | 2023 | Cell Reports | Oncology | Cytonuclear | HALO |
| Integration of peripheral blood- and tissue-based biomarkers of response to immune checkpoint blockade in urothelial carcinoma | Vanguri RS, Smithy JW, Li Y, Zhuang M, Maher CA, Aleynick N, Peng X, Al-Ahmadie H, Funt SA, Rosenberg JE, Iyer G, Bajorin D, Mathews JC, Nadeem S, Panageas KS, Shen R, Callahan MK, Hollmann TJ | 2023 | Journal of Pathology | Immuno-oncology | Highplex FL | HALO, HALO AI |
| High-resolution and quantitative spatial analysis reveal intra-ductal phenotypic and functional diversification in pancreatic cancer | Michiels E, Madhloum H, Lint S, Messaoudi N, Kunda R, Martens S, Giron P, Olsen C, Lefesvre P, Dusetti N, Mohajer L, Tomasini R, Hawinkels L J, Ahsayni F, Nicolle R, Arsenijevic T, Bouchart C, Laethem J L, Rooman I | 2023 | Journal of Pathology | Oncology | Spatial Analysis, FISH-IF | HALO |
| New insight on the correlation of immune landscapes with immune markers expression in different risk classification of gastrointestinal stromal tumors | Zhang Q, Sun X, Hou Y, Gao X, Shen K, Qin X | 2023 | Journal of Gastroenterology | Immuno-oncology | Highplex FL | HALO |
| Chronic immune activation and gut barrier dysfunction is associated with neuroinflammation in ART-suppressed SIV+ rhesus macaques | Byrnes S, Busman-Sahay K, Angelovich T, Younger S, Taylor-Brill S, Nekorchuk M, Bondoc S, Dannay R, Terry M, Cochrane C, Jenkins T, Roche M, Deleage C, Bosinger S, Paiardini M, Brew B, Estes J, Churchill M | 2023 | PLOS Pathogens | Infectious Disease | Area Quantification, Object Colocalization, ISH, Highplex FL | HALO |
| Reciprocal Interaction of Cancer Stem Cells of Cholangiocarcinoma with Macrophage | Wang X, Golino J, Hawk N, Xie C | 2023 | Stem Cell Reviews and Reports | Oncology | Area Quantification | HALO |
| Guidelines for visualization and analysis of DC in tissues using multiparameter fluorescence microscopy imaging methods | Bayer F, Bejarano D, Bartacchi G, Doffin A-C, Gobbini E, Hubert M, Li L, Meiser P, Pedde A-M, Posch W, Rupp L, Schlitzer A, Schmitz M, Schraml B, Uderhardt S, Balladeau-Guilemond J, Wilflingseder D, Zaderer V, Bottcher J | 2023 | European Journal of Immunology | Other | Highplex FL | HALO |
| Icariside II potentiates the anti-PD-1 antitumor effect by reducing chemotactic infiltration of myeloid-derived suppressor cells into the tumor microenvironment via ROS-mediated inactivation of the SRC/ERK/STAT3 signaling pathways | Kong Q, Ma M, Zhang L, Liu S, He S, Wu J, Liu B, Dong J | 2023 | Phytomedicine | Immuno-oncology | Multiplex IHC | HALO |
| High-plex spatial transcriptomic profiling reveals distinct immune components and the HLA class I/DNMT3A/CD8 modulatory axis in mismatch repair-deficient endometrial cancer | Guo J, Tang B, Fu J, Zhu X, Xie W, Wang N, Ding Z, Song Z, Yang Y, Xu G, Xiao X | 2023 | Cellular Oncology | Immuno-oncology | Highplex FL, Figure Maker | HALO |
| Plasminogen deficiency suppresses pancreatic ductal adenocarcinoma disease progression | Chowdhury NN, Yang Y, Dutta A, Luo M, Wei Z, Abrahams SR, Revenko AS, Shah F, Miles LA, Parmer RJ, de Laat B, Wolberg AS, Luyendyk JP, Fishel ML, Flick MJ | 2023 | Molecular Oncology | Oncology | HALO | |
| Prognostic Value of CD8+ Lymphocytes in Hepatocellular Carcinoma and Perineoplastic Parenchyma Assessed by Interface Density Profiles in Liver Resection Samples | Stulpinas R, Zilenaite-Petrulaitiene D, Rasmusson A, Gulla A, Grigonyte A, Strupas K, Laurinavicius A | 2023 | Cancers | Oncology | Multiplex IHC | HALO, HALO AI |
| CD8+ Cell Density Gradient across the Tumor Epithelium–Stromal Interface of Non-Muscle Invasive Papillary Urothelial Carcinoma Predicts Recurrence-Free Survival after BCG Immunotherapy | Drachneris J, Rasmusson A, Morkunas M, Fabijonavicius M, Cekauskas A, Jankevicius F, Laurinavicius A | 2023 | Cancers | Immuno-oncology | Multiplex IHC, Spatial Analysis | HALO, HALO AI |
| Oncolytic BHV-1 Is Sufficient to Induce Immunogenic Cell Death and Synergizes with Low-Dose Chemotherapy to Dampen Immunosuppressive T Regulatory Cells | Davola M, Cormier O, Vito A, El-Sayes N, Collins S, Salem O, Revill S, Ask K, Wan Y, Mossman K | 2023 | Cancers | Oncology | Multiplex IHC | HALO |
| PD-1+CD8+ T Cells Proximal to PD-L1+CD68+ Macrophages Are Associated with Poor Prognosis in Pancreatic Ductal Adenocarcinoma Patients | Yang X, Wang G, Song Y, Zhuang T, Li Y, Xie Y, Fei X, Zhao Y, Xu D, Hu Y | 2023 | Cancers | Oncology, Immuno-oncology | Classifier, Spatial Analysis, Highplex FL, Registration | HALO |
| Immune Checkpoint Neuropilins as Novel Biomarkers and Therapeutic Targets for Pancreatic Cancer | He L, Zhang X, Lao M, Zhang H, Yang H, Bai X | 2023 | Cancers | Immuno-oncology | Highplex FL | HALO |
| Improving HCC Prognostic Models after Liver Resection by AI-Extracted Tissue Fiber Framework Analytics | Stulpinas R, Morkunas M, Rasmusson A, Drachneris J, Augulis R, Gulla A, Strupas K, Laurinavicius A | 2023 | Cancers | Oncology | HALO, HALO AI | |
| Fibroblast inhibition by tocilizumab enabled gemcitabine/nab-paclitaxel rechallenge for pancreatic cancer | Mitsunaga S, Ikeda M, Imaoka H, Sasaki M, Watanabe K, Sato A, Aoki K, Ochiai A, Makakawa M, Nishidate M, Yamaguchi K Terao K, Sawada N, Fujitomo T, Fujii E, Kato A, Tsunoda H | 2023 | Cancer Science | Immuno-oncology | Cytonuclear | HALO |
| Modifying antibody-FcRn interactions to increase the transport of antibodies through the blood-brain barrier | Tien J, Leonoudakis D, Petrova R, Trinh V, Taura T, Sengupta D, Jo L, Sho A, Yun Y, Doan E, Jamin A, Hallak H, Wilson D, Stratton J | 2023 | mAbs | Neuroscience | Classifier, Area Quantification, Object Colocalization | HALO |
| ABCC2 brush-border expression predicts outcome in papillary renal cell carcinoma: a multi-institutional study of 254 cases | Castillo VF, Masoomian M, Trpkov K, Downes M, Brimo F, van der Kwast T, Yousef GM, Zakhary A, Rotondo F, Saad G, Nguyen V, Kidanewold W, Streutker C, Rowsell C, Hamdani M, Saleeb RM | 2023 | Histopathology | Oncology | ISH | HALO |
| Telomere dysfunction in Tert knockout mice delays BrafV600E-induced melanoma development | Zhang J, Zhang F, Porter KI, Dakup PP, Wang S, Robertson GP, Gaddameedhi S, Zhu J | 2023 | International Journal of Cancer | Oncology | Multiplex IHC | HALO |
| Key Residue in the Precursor Region of M Protein Contributes to the Neurovirulence and Neuroinvasiveness of the African Lineage of Zika Virus | He M, Wang H, Yan X, Lou Y, Song G, Li R, Zhu Z, Zhang R, Qin C, Li X | 2023 | Journal of Virology | Infectious Disease | Highplex FL | HALO |
| ProNGF Expression and Targeting in Glioblastoma Multiforme | Marsland M, Dowdell A, Faulkner S, Jobling P, Rush R, Gedye C, Lynam J, Griffin C, Baker M, Marsland J, Jiang C, Hondermarck H | 2023 | International Journal of Molecular Sciences | Oncology | Cytonuclear | HALO |
| CD47-Dependent Regulation of Immune Checkpoint Gene Expression and MYCN mRNA Splicing in Murine CD8 and Jurkat T Cells | Kaur S, Awad D, Finney R, Meyer T, Singh S, Cam M, Karim B, Warner A, Roberts D | 2023 | International Journal of Molecular Sciences | Immuno-oncology | ISH/FISH | HALO |
| SMAD4 and KCNQ3 alterations are associated with lymph node metastases in oesophageal adenocarcinoma | Foley K, Shorthouse D, Rahrmann E, Zhuang L, Devonshire G, Gilbertson R, OCCAMS consortium, Fitzgerald R, Hall B | 2023 | Biochimica et Biophysica Acta (BBA) - Molecular Basis of Disease | Oncology | Multiplex IHC | HALO |
| Integrated FET sensing microsystem for specific detection of pancreatic cancer exosomal miRNA10b | Yu Y, Liang C, Wan QQ, Jin D, Liu X, Zhang Z, Sun ZY, Zhang GJ | 2023 | Analytica Chimica Acta | Oncology | Highplex FL | HALO |
| A five-protein prognostic signature with GBP2 functioning in immune cell infiltration of clear cell renal cell carcinoma | Meng K, Li Y, Liu D, Hu L, Pan Y, Zhang C, He Q | 2023 | Computational and Structural Biotechnology Journal | Oncology | Highplex FL | HALO |
| Soluble TNF mediates amyloid-independent, diet-induced alterations to immune and neuronal functions in an Alzheimer's disease mouse model | MacPherson K, Eidson L, Houser M, Weiss B, Gollihue J, Herrick M, Rodrigues M, Sniffen L, Weekman E, Hamilton A, Kelly S, Oliver D, Yang Y, Chang J, Sampson T, Norris C, Tansey M | 2023 | Frontiers in Cellular Neuroscience | Neuroscience | Object Colocalization | HALO |
| Dual truncation of tau by caspase-2 accelerates its CHIP-mediated degradation | Reinhardt L, Musacchio F, Bichmann M, Behrendt A, Ercan-Herbst E, Stein J, Becher I, Haberkant P, Mader J, Schöndorf D, Schmitt M, Korffmann J, Reinhardt P, Pohl C, Savitski M, Klein C, Gasparini L, Fuhrmann M, Ehrnhoefer D | 2023 | Neurobiology of Disease | Neuroscience | Area Quantification | HALO |
| Comparing the peri-implantation endometrial T-bet/GATA3 ratio between control fertile women and patients with recurrent miscarriage: establishment and application of a reference range Get access Arrow | Yu S, Diao L, Lian R, Chen C, Huang C, Li X, Li Y, Zeng Y | 2023 | Human Reproduction | Other | Classifier, Multiplex IHC | HALO |
| Prognostic value of tumor immune microenvironment factors in patients with stage I lung adenocarcinoma | Xue Q, Wang Y, Zheng Q, Chen L, Lin Y, Jin Y, Shen X, Li Y | 2023 | American Journal of Cancer Research | Oncology | Classifier, Multiplex IHC, Highplex FL | HALO |
| A novel 4-1BB/HER2 bispecific antibody shows potent antitumor activities by increasing and activating tumor-infiltrating T cells | Shen A, Liu W, Wang H, Zeng X, Wang M, Zhang D, Zhao Q, Fang Q, Wang F, Cheng L, Shen G, Li Y | 2023 | American Journal of Cancer Research | Immuno-oncology | Multiplex IHC | HALO |
| Spatial transcriptomics analysis of zone-dependent hepatic ischemia-reperfusion injury murine model | Xin J, Yang T, Wu X, Wu Y, Liu Y, Liu X, Jiang M, Gao W | 2023 | Communications Biology | Gastroenterology | Highplex FL | HALO |
| Decreased left heart flow in fetal lambs causes left heart hypoplasia and pro-fibrotic tissue remodeling | Reuter MS, Sokolowski DJ, Diaz-Mejia JJ, Keunen J, de Vrijer B, Chan C, Wang L, Ryan G, Chiasson DA, Ketela T, Scherer SW, Wilson MD, Jaeggi E, and Chaturvedi RR | 2023 | Communications Biology | Other | Area Quantification | HALO |
| COVID-19 and influenza infections mediate distinct pulmonary cellular and transcriptomic changes | Wang C, Khatun M S, Zhang Z, Allen M J, Chen Z, Ellsworth C R, Currey J M, Dai G, Tian D, Bach K, Yin X-M, Traina-Dorge V, Rappaport J, Maness N J, Blair R V, Kolls J K, Pociask D A, Qin X | 2023 | Communications Biology | Infectious Disease | Area Quantification, Highplex FL, Figure Maker | HALO, HALO AI |
| Combining the AKT inhibitor capivasertib and SERD fulvestrant is effective in palbociclib-resistant ER+ breast cancer preclinical models | Hopcroft L, Wigmore EM, Williamson SC, Ros S, Eberlein C, Moss JI, Urosevic J, Carnevalli LS, Talbot S, Bradshaw L, Blaker C, Gunda S, Owenson V, Hoffmann S, Sutton D, Jones S, Goodwin RJAG, Willis BS, Rooney C, DeBruin E, Barry ST | 2023 | npj Breast Cancer | Oncology | Multiplex IHC | HALO, HALO AI |
| Myeloid-specific deletion of activating transcription factor 6 alpha increases CD11b+ macrophage subpopulations and aggravates lung fibrosis | Mekhael O, Revill S, Hayat A, Cass S, MacDonald K, Vierhout M, Ayoub A, Reihani A, Padwal M, Imani J, Ayaub E, Yousof T, Dvorkin-Gheva A, Rullo A, Hirota J, Richards C, Bridgewater D, Stämpfli M, Hambly N, Naqvi A, Kolb M, Ask K | 2023 | Immunology and Cell Biology | Immunology, Fibrosis | Classifier, Area Quantification, FISH, Multiplex IHC | HALO |
| Targeting XBP1 mRNA splicing sensitizes glioblastoma to chemotherapy | Dowdell A, Marsland M, Faulkner S, Gedye C, Lynam J, Griffin C, Marsland J, Jiang C, Hondermarck H | 2023 | FASEB BioAdvances | Oncology | Cytonuclear | HALO |
| Induction of cancer neoantigens facilitates development of clinically relevant models for the study of pancreatic cancer immunobiology | Panni U, Chen M, Zhang F, Cullinan D, Li L, James C, Zhang X, Rogers S, Alarcon A, Baer JM, Zhang D, Gao F, Miller CA, Gong Q, Lim KH, DeNardo DG, Goedegebuure SP, Gillanders WE, and Hawkins WG | 2023 | Cancer Immunology, Immunotherapy | Immuno-oncology | Multiplex IHC | HALO |
| Comprehensive analysis of immune subtypes reveals the prognostic value of cytotoxicity and FAP+ fibroblasts in stomach adenocarcinoma | Wang X, Hui S, Tan C, Deng Z, Wang X, Weng W, Zhang M, Ni S, Wang L, Huang D, Wang W, Xu M, Sheng W | 2023 | Cancer Immunology, Immunotherapy | Immuno-oncology | Highplex FL | HALO |
| It is not all about the alpha: elevated expression of p53β variants is associated with lower probability of survival in a retrospective melanoma cohort | Groen K, Reinhardt LS, Bourdon JC, Avery-Keijda KA | 2023 | Cancer Cell International | Oncology | Cytonuclear | HALO |
| Loss of Hepatic Leucine-Rich RepeatContaining G-Protein Coupled Receptors 4 and 5 Promotes Nonalcoholic Fatty Liver Disease | Saponara E, Penno C, Orsini V, Wang Z, Fischer A, Aebi A, Matadamas-Guzman M, Brun V, Fischer B, Brousseau M, O'Donnell P, Turner J, Meyer A, Bollepalli L, d'Ario G, Roma G, Carbone W, Annunziato S, Obrecht M, Beckmann N, Saravanan C, Osmont A, Tropberger P, Richards S, Genoud C, Ley S, Ksiazek I, Nigsch F, Terracciano L, Schadt H, Bouwmeester T, Tchorz J, Ruffner H | 2023 | The American Journal of Pathology | Gastroenterology | Highplex FL | HALO |
| A Spatial Atlas of Wnt Receptors in Adult Mouse Liver | Gayden J, Hu S, Joseph P, Delgado E, Liu S, Bell A, Puig S, Monga S, Freyberg Z | 2023 | The American Journal of Pathology | Gastroenterology | FISH | HALO |
| Specific Polo-Like Kinase 1 Expression in Nodular Lymphocyte-Predominant Hodgkin Lymphoma Suggests an Intact Immune Surveillance Program | Weiss J, Gibbons K, Ehyaee V, Perez-Silos V, Zevallos A, Maienschein-Cline M, Brister E, Sverdlov M, Shah E, Balakrishna J, Symes E, Frederiksen J K, Gann P H, Post R, Lopez-Hisijos N, Reneau J, Venkataraman G, Bailey N, Brown N A, Xu M L, Murga-Zamalloa C | 2023 | The American Journal of Pathology | Oncology | Area Quantification, Spatial Analysis | HALO |
| Gys1 Antisense Therapy Prevents Disease-Driving Aggregates and Epileptiform Discharges in a Lafora Disease Mouse Model | Donohue K, Fitzsimmons B, Bruntz R, Markussen K, Young L, Clarke H, Coburn P, Griffith L, Sanders W, Klier J, Burke S, Maurer A, Minassian B, Sun R, Kordasiewisz H, Gentry M | 2023 | Neurotherapeutics | Neuroscience | Area Quantification | HALO |
| Preclinical Evaluation of 9MW2821, a Site-Specific Monomethyl Auristatin E-based Antibody-Drug Conjugate for treatment of Nectin-4-expressing Cancers | Zhou W, Fang P, Yu D, Ren H, You M, Yin L, Mei F, Zhu H, Wang Z, Xu H, Cao Y, Sun X, Xu X, Bi J, Wang J, Ma L, Wang X, Chen L, Zhang Y, Cen X, Zhu X, Lou L, Liu D, Tan X, Yang J, Meng T, Shen J | 2023 | Molecular Cancer Therapeutics | Oncology | Multiplex IHC | HALO |
| An antibody-drug conjugate directed to tissue factor shows preclinical anti-tumor activity in head and neck cancer as a single agent and in combination with chemoradiotherapy | Bakema J E, Stigter-van Walsum M, Harris J R, Ganzevles S H, Muthuswamy A, Houtkamp M, Plantinga T S, Bloemena E, Brakenhoff R H, Breij E C W, van de Ven R | 2023 | Molecular Cancer Therapeutics | Oncology | Area Quantification | HALO |
| Amelioration of Tumor-Promoting Microenvironment via Vascular Remodeling and CAF Suppression using E7130: Biomarker Analysis by Multi-modal Imaging Modalities | Ito K, Yamaguchi M, Semba T, Tabata K, Tamura M, Aoyama M, Abe T, Asano O, Terada Y, Funashashi Y, Fujii H | 2023 | Molecular Cancer Therapeutics | Oncology | Area Quantification, Object Colocalization | HALO |
| Unlocking the Hidden Depths: Multi-Modal Integration of Imaging Mass Spectrometry-Based and Molecular Imaging Techniques | Akbari B, Huber BR, Sherman JH | 2023 | Critical Reviews in Analytical Chemistry | Review | Highplex FL | HALO, HALO AI, HALO Link, HALO AP |
| Size and depth of residual tumor after neoadjuvant chemoradiotherapy in rectal cancer – implications for the development of new imaging modalities for response assessment | van der Stel SD, van den Berg JG, Snaebjornsson PS, Seignette IM, Witteveen M, Grotenhuis BA, Beets GL, Post AL, Ruers TJM | 2023 | Frontiers in Oncology | Oncology | HALO, HALO AI | |
| Novel read through agent: ZKN-0013 demonstrates efficacy in APCmin model of familial adenomatous polyposis | Graf M, Apte S, Terzo E, Padhye S, Shi S, Cox M, Clark R, Modur V, Badarinarayana V | 2023 | Journal of Molecular Medicine | Oncology | Area Quantification | HALO |
| Evaluation of the efficacy of Abelmoschus manihot (L.) on diabetic nephropathy by analyzing biomarkers in the glomeruli and proximal and distal convoluted tubules of the kidneys | Yu H, Wang M, Yu J, Tang H, Xu Q, Cheng N, Luo X, Wang Y, Ge H, Qiang L, Tang W, Gu H | 2023 | Frontiers in Pharmacology | Gastroenterology | Multiplex IHC | HALO |
| Single-cell analysis of the miRNA activities in tuberculous meningitis (TBM) model mice injected with the BCG vaccine | Zhang X, Pan L, Zhang P, Wang L, Shen Y, Xu P, Ren Y, Huang W, Liu P, Wu Q, Li F | 2023 | International Immunopharmacology | Infectious Disease | FISH | HALO |
| Orthotopic model of pancreatic cancer using CD34+ humanized mice and generation of tumor organoids from humanized tumors | Jeong J, Park S, Lee S, Kim Y, Shim I, Jeong S, Choi E, Kim J, Jun E | 2023 | International Immunopharmacology | Immuno-oncology | Area Quantification | HALO |
| Immune profiling and RNA-seq uncover the cause of partial unexplained recurrent implantation failure | Fan X, Zhao Q, Li Y, Chen Z, Liao J, Chen H, Meng F, Lu G, Lin G, Gong F | 2023 | International Immunopharmacology | Immunology | Classifier, Multiplex IHC | HALO |
| The role of BATF2 deficiency in immune microenvironment rearrangement in cervical cancer – New biomarker benefiting from combination of radiotherapy and immunotherapy | Zong Y, Chang Y, Huang K, Liu J, Zhao Y | 2023 | International Immunopharmacology | Immuno-oncology | Cytonuclear | HALO |
| Neoadjuvant chemotherapy is linked to an amended anti-tumorigenic microenvironment in gastric cancer | Huan X, Zou K, Zhang P, Ding H, Luo C, Xiang C, Xu S, Zhuang Y, Wu C, Wang Y, Wu X, Chen C, Zhang J, Yao X, Liu F, Liu S, Wu Z | 2023 | International Immunopharmacology | Immuno-oncology | Spatial Analysis, Highplex FL | HALO |
| Effects of electroacupuncture on the kisspeptin-gonadotropin-releasing hormone (GnRH) /luteinizing hormone (LH) neural circuit abnormalities and androgen receptor expression of kisspeptin/neurokinin B/dynorphin neurons in PCOS rats. | Xu G, Zhao X, Li Z, Hu J, Li X, Li J, Chen Y | 2023 | Journal of Ovarian Research | Other | Highplex FL | HALO |
| IFN-γ in ovarian tumor microenvironment upregulates HLA-E expression and predicts a poor prognosis | Zheng H, Guan X, Meng X, Tong Y, Wang Y, Xie S, Guo L, Lu R | 2023 | Journal of Ovarian Research | Oncology | Highplex FL | HALO |
| Cutting Edge: TLR2 Signaling in B Cells Promotes Autoreactivity to DNA via IL-6 Secretion | Soni C, Makita S, Eichinger A, Serpas L, Sisirak V, Reizis B | 2023 | The Journal of Immunology | Immunology | HALO, HALO AI | |
| Modified Bushen Yiqi Formula mitigates pulmonary inflammation and airway remodeling by inhibiting neutrophils chemotaxis and IL17 signaling pathway in rats with COPD | Kong Q, Wang B, Zhong Y, Chen W, Sun J, Liu B, Dong J | 2023 | Journal of Ethnopharmacology | Other | Multiplex IHC | HALO |
| Modified Bushen Yiqi formula enhances antitumor immunity by reducing the chemotactic recruitment of M2-TAMs and PMN-MDSCs in Lewis lung cancer-bearing mice | Kong Q, Zhu H, Gong W, Deng X, Liu B, Dong J | 2023 | Journal of Ethnopharmacology | Immuno-oncology | Multiplex IHC, Highplex FL | HALO |
| Immune microenvironment of intimal sarcomas: Adaptive immune resistance with potential therapeutic implications | Birkness-Gartman JE, Thomas II DL, Engle LL, Voltaggio L, Thompson ED | 2023 | American Journal of Clinical Pathology | Immuno-oncology | Immune | HALO |
| Free fatty acids induce coronary microvascular dysfunction via inhibition of the AMPK/KLF2/eNOS signaling pathway | Zhang Y, Zhao J, Ren C, Hu B, Ding R, He Z, Liang C | 2023 | International Journal of Molecular Medicine | Other | Multiplex IHC | HALO |
| Targeting the ATF6-mediated ER stress response and autophagy blocks integrin-driven prostate cancer progression | Macke A, Pachikov A, Divita T, Morris M, LaGrange C, Holzapfel M, Kubyshkin A, Zyablitskaya E, Makalish T, Eremenko S, Qiu H, Riethoven J, Hemstreet G, Petrosyan A | 2023 | Molecular Cancer Research | Oncology | Classifier, Area Quantification, Multiplex IHC, TMA | HALO |
| The apelin‑apelin receptor signaling pathway in fibroblasts is involved in tumor growth via p53 expression of cancer cells | Saiki H, Hayashi Y, Yoshii S, Kimura E, Nakagawa K, Kato M, Uema R, Inoue T, Sakatani A, Yoshihara T, Tsujii Y, Shinzaki S, Iijima H, Takehara T | 2023 | International Journal of Oncology | Oncology | Area Quantification | HALO |
| Telomerase Upregulation Induces Progression of Mouse BrafV600E-Driven Thyroid Cancers and Triggers Nontelomeric Effects | Landa I, Thornton C, Xu B, Haase J, Krishnamoorthy G, Hao J, Knauf J, Herbert Z, Martinez P, Blasco M, Ghossein R, Fagin J | 2023 | Molecular Cancer Research | Oncology | HALO | |
| Early immune changes support signet ring cell dormancy in CDH1-driven hereditary diffuse gastric carcinogenesis | Green BL, Gamble LA, Diggs LP, Nousome D, Patterson JC, Joughin BA, Gasmi B, Lux SC, Samaranayake SG, Miettinen M, Quezado M, Hernandez JM, Yaffe MB, Davis JL | 2023 | Molecular Cancer Research | Oncology | Cytonuclear | HALO |
| Prednisolone and rapamycin reduce the plasma cell gene signature and may improve AAV gene therapy in cynomolgus macaques | Kistner A, Chichester J A, Wang L, Calcedo R, Greig J A, Cardwell L N, Wright M C, Couthouis J, Sethi S, McIntosh B E, McKeever K, Wadsworth S, Wilson J M, Kakkis E, Sullivan B A | 2023 | Gene Therapy | Other | FISH-IF | HALO |
| Gastric tubular adenocarcinoma with diffuse neutrophils infiltrating: characteristics and probable treatment strategy | Wang B, Zhu Y, Wang S, Li Z, Wang L, Rao W, Cheng N, Chen R, Ying J, Xue L | 2023 | Gastric Cancer | Oncology | Multiplex IHC, Spatial Analysis, Registration | HALO |
| DNA Damage-Induced, S-Phase Specific Phosphorylation of Orc6 is Critical for the Maintenance of Genome Stability | Lin Y, Liu D, Chakraborty A, Macias V, Brister E, Sonalkar J, Shen L, Mitra J, Ha T, Kajdacsy-Balla A, Prasanth K, Prasanth S | 2023 | Molecular and Cellular Biology | Other | Multiplex IHC | HALO, HALO AI |
| Standardized pathology screening of mature Tertiary Lymphoid Structures in cancers | Vanhersecke L, Bougouin A, Crombe A, Brunet M, Sofeu C, Parrens M, Pierron H, Bonhomme B, Lembege N, Rey C, Velasco V, Soubeyran I, Begueret H, Bessede A, Bellera C, Scoazec J-Y, Italiano A, Fridman C, Fridman W, Le Loarer F | 2023 | Laboratory Investigation | Other | Highplex FL, Registration | HALO |
| The Defenders of the Alveolus Succumb in COVID-19 Pneumonia to SARS-CoV-2 and Necroptosis, Pyroptosis and Panoptosis | Schifanella L, Anderson J, Wieking G, Southern P, Antinori S, Galli M, Corbellino M, Lai A, Klatt N, Schacker T, Haase A | 2023 | The Journal of Infectious Diseases | Infectious Disease | Area Quantification | HALO |
| Whole-Slide Imaging, Mutual Information Registration for Multiplex Immunohistochemistry and Immunofluorescence | Doyle J, Green B, Eminizer M, Jimenez-Sanchez D, Lu S, Engle E, Xu H, Ogurtsova A, Lai J, Soto-Diaz S, Roskes J, Deutsch J, Taube J, Sunshine J, Szalay A | 2023 | Laboratory Investigation | Other | Multiplex IHC, Registration | HALO |
| Using artificial intelligence to identify tumor microenvironment heterogeneity in non-small cell lung cancers | DuCote T, Naughton K, Skaggs E, Bocklage T, Allison D, Brainson C | 2023 | Laboratory Investigation | Oncology | Multiplex IHC | HALO, HALO AI |
| Spatial Proximity and Relative Distribution of Tumor-Infiltrating Lymphocytes and Macrophages Predict Survival in Melanoma | De Logu F, Ugolini F, Iannone L F, Simi S, Maio V, de Giorgi V, di Giacomo A M, Miracco C, Cossu A, Palmieri G, Mandalà M, Massi D | 2023 | Laboratory Investigation | Oncology | Multiplex IHC | HALO, HALO Link |
| CD15 Is a Risk Predictor and a Novel Target in Clear Cell Renal Cell Carcinoma | Stenzela PJ, Schindeldeckera MS, Seidmanna L, Herpel E, Hohenfellnere M, Hatiboglue G, Foerscha S, Porubskya S, Macher-Goeppingera S, Rotha W, Tagscherer KE | 2023 | Pathobiology | Oncology | Multiplex IHC, TMA | HALO |
| Localization of unlabelled bepirovirsen antisense oligonucleotide in murine tissues using in situ hybridization and CARS imaging | Spencer-Dene B, Mukherjee P, Alex A, Bera K, Tseng W, Shi J, Chaney E, Spillman Jr. D, Marjanovic B, Miranda E, Boppart S, Hood S | 2023 | RNA | Other | ISH | HALO, HALO AI |
| Long-Term Fate and Efficacy of a Biomimetic (Sr)-Apatite-Coated Carbon Patch Used for Bone Reconstruction | Olivier F, Drouet C, Marsan O, Sarou-Kanian V, Rekima S, Gautier N, Fayon F, Bonnamy S, Rochet N | 2023 | Journal of Functional Biomaterials | Biomaterials | Classifier | HALO |
| Pioglitazone restores mitochondrial function but does not spare cortical tissue following mild brain contusion | Hubbard W, Vekaria H, Kalimon O, Spry M, Brown E, Kobaugh T, Sullivan P | 2023 | Brain Communications | Neuroscience | Area Quantification | HALO |
| Mapping the individual human cortex using multidimensional MRI and unsupervised learning | Kundu S, Barsoum S, Ariza J, Nolan A, Latimer C, Keene C, Basser P, Benjamini D | 2023 | Brain Communications | Neuroscience | HALO, HALO AI | |
| A modified mouse model of Friedreich's ataxia with conditional Fxn allele homozygosity delays onset of cardiomyopathy | Perfitt TL, Huichalaf C, Gooch R, Kuperman A, Ahn Y, Chen X, Ullas S, Hirenallur-Shanthappa D, Zhan Y, Otis D, Whiteley LO, Bulawa C, Martelli A | 2023 | American Journal of Physiology-Heart and Circulatory Physiology | Other | Classifier, Area Quantification | HALO |
| Tumor cell HLA class I expression and pathologic response following neoadjuvant immunotherapy for newly diagnosed head and neck cancer | Robbins Y, Friedman J, Redman J, Sievers C, Lassoued W, Gulley J, Allen C | 2023 | Oral Oncology | Immuno-oncology | Classifier, Spatial Analysis, Highplex FL | HALO |
| TRβ Agonism Induces Tumor Suppression and Enhances Drug Efficacy in Anaplastic Thyroid Cancer in Female Mice | Gillis NE, Cozzens LM, Wilson ER, Smith NM, Tomczak JE, Bolf EL, Carr FE | 2023 | Endocrinology | Oncology | Highplex FL | HALO |
| Altered MANF Expression in Pancreatic Acinar and Ductal Cells in Chronic Alcoholic Pancreatitis: A Cross-Sectional Study | Caldwell N, Li H, Bellizzi A, Luo J | 2023 | Biomedicines | Gastroenterology | Area Quantification, Cytonuclear | HALO |
| Empowering Renal Cancer Management with AI and Digital Pathology: Pathology, Diagnostics and Prognosis | Ivanova E, Fayzullin A, Grinin V, Ermilov D, Arutyunyan A, Timashev P, Shekhter A | 2023 | Biomedicines | Review | Classifier, Area Quantification, Cytonuclear, Object Colocalization | HALO, HALO AI |
| Molecular determinants of clinical outcomes of pembrolizumab in recurrent ovarian cancer: Exploratory analysis of KEYNOTE-100 | Ledermann JA, Shapira-Frommer R, Santin AD, Lisyanskaya AS, Pignata S, Vergote I, Raspagliesi F, Sonke GS, Birrer M, Provencher DM, Sehouli J, Colombo N, González-Martín A, Oaknin A, Ottevanger PB, Rudaitis V, Kobie J, Nebozhyn M, Edmondson M, Sun Y, Cristescu R, Jelinic P, Keefe SM, Matulonis UA | 2023 | Gynecologic Oncology | Immuno-oncology | Classifier, Highplex FL | HALO |
| The Expression of the Alpha7 Nicotinic Acetylcholine Receptor and the Effect of Smoking in Curdlan-Administered SKG Mice | Kim YE, Lee JH, Lee EJ, Kim DH, Jeong MR, Hong S, Lee CK, Yoo B, Youn J, Chang EJ, Kim YG | 2023 | Biomedicines | Immunology | Highplex FL | HALO |
| Bioinformatics Prediction and Experimental Validation of the Role of Macrophage Polarization and Ferroptosis in Gestational Diabetes Mellitus | Chen C, Yang Z, Qiu Z | 2023 | Journal of Inflammation Research | Immunology | Highplex FL | HALO |
| Somatostatin slows Aβ plaque deposition in aged APPNL-F/NL-F mice by blocking Aβ aggregation | Williams D, Yan B, Wang H, Negm L, Sackmann C, Verkuyl C, Rezai-Stevens V, Eid S, Vediya N, Sato C, Watts J, Wille H, Schmitt-Ulms G | 2023 | Scientific Reports | Neuroscience | Object Colocalization | HALO |
| Repertoire of P-glycoprotein drug transporters in the zoonotic nematode Toxocara canis | Chelladurai J, Martin K, Vardaxis P, Reinemeyer C, Vijayapalani P, Robertson A, Brewer M | 2023 | Scientific Reports | Infectious Disease | Area Quantification | HALO |
| Therapeutic effects of axitinib, an anti-angiogenic tyrosine kinase inhibitor, on interstitial cystitis | Shin J, Ryu C, Yu H, Park Y, Shin D, Choo M | 2023 | Scientific Reports | Other | Area Quantification | HALO |
| D-serine availability modulates prefrontal cortex inhibitory interneuron development and circuit maturation | Folorunso O, Brown S, Baruah J, Harvey T, Jami S, Radzishevsky I, Wolosker H, McNally J, Gray J, Vasudevan A, Balu D | 2023 | Scientific Reports | Neuroscience | ISH | HALO |
| Disease pathology signatures in a mouse model of Mucopolysaccharidosis type IIIB | Petrova R, Patil AR, Trinh V, McElroy KE, Bhakta M, Tien J, Wilson DS, Warren L, Stratton JR | 2023 | Scientific Reports | Neuroscience, Metabolism | Classifier, Area Quantification, Object Colocalization | HALO |
| Intratracheally Administered Peptide-Modified Lipid Admixture Containing Fasudil and/or DETA NONOate Ameliorates Various Pathologies of Pulmonary Arterial Hypertension | Sarkar T, Moinuddin SM, Isbatan A, Chen J, Mann D, Ahsan F | 2023 | Pharmaceuticals | Other | Area Quantification | HALO, HALO Link |
| A machine learning approach toward automating spatial identification of LAG3+/CD3+ cells in ulcerative colitis | Bonnevie ED, Dobrzynski E, Steiner D, Hildebrand D, Monslow J, Singh M, Decman V, Krull DL | 2023 | Scientific Reports | Gastroenterology | Highplex FL, Registration | HALO, HALO AI |
| Cancer-associated fibroblasts are the main contributors to epithelial-to-mesenchymal signatures in the tumor microenvironment | Szabo P, Vajdi A, Kumar N, Tolstorukov M, Chen B, Edwards R, Ligon K, Chasalow S, Chow K, Shetty A, Bolisetty M, Holloway J, Golhar R, Kidd B, Hull P, Houser J, Vlach L, Siemers N, Saha S | 2023 | Scientific Reports | Oncology | Area Quantification | HALO |
| HX009, a novel BsAb dual targeting PD1 x CD47, demonstrates potent anti-lymphoma activity in preclinical models | Ke H, Zhang F, Wang J, Xiong L, An X, Tu X, Chen C, Wang Y, Mao B, Guo S, Ju C, He X, Sun R, Zhang L, O'Connor O, Li Q | 2023 | Scientific Reports | Immuno-oncology | Multiplex IHC | HALO |
| A novel retinoic acid receptor-γ agonist antagonizes immune checkpoint resistance in lung cancers by altering the tumor immune microenvironment | Wei CH, Huang L, Kreh B, Liu X, Tyutyunyk-Massey L, Kawakami M, Chen Z, Shi M, Kozlov S, Chan KC, Andresson T, Carrington M, Vuligonda V, Sanders ME, Horowitz A, Hwu P, Peng W, Dmitrovsky E, Liu X | 2023 | Scientific Reports | Immuno-oncology | Area Quantification, Cytonuclear | HALO, HALO AI |
| A neutrophil extracellular traps-related classification predicts prognosis and response to immunotherapy in colon cancer | Feng C, Li Y, Tai Y, Zhang W, Wang H, Lian S, Jin-si-han E, Liu Y, Li X, Chen Q, He M, Lu Z | 2023 | Scientific Reports | Immuno-oncology | Spatial Analysis, Highplex FL, Figure Maker | HALO |
| Effect of microbial muramidase supplementation in diets formulated with different fiber profiles for broiler chickens raised under various coccidiosis management programs | Bortoluzzi C, Perez-Calvo E, Olsen P B, van der Vaart S, van Eerden E, Schmeisser J, Eising I, Segobola P, Sorbara J-O B | 2023 | Poultry Science | Infectious Disease | Multiplex IHC | HALO |
| Adrenal cortex size and homeostasis are regulated by gonadal hormones via androgen receptor/β-catenin signaling crosstalk | Lyraki R, Grabek A, Tison A, Weerasinghe-Arachchige L, Peitzsch M, Bechman N, Youssef S, de Bruin A, Bakker E, Claessens F, Chaboissier M, Schedl A | 2023 | Disease Models & Mechanisms | Other | FISH, Highplex FL | HALO |
| Altered expression, but small contribution, of the histone demethylase KDM6A in obstructive uropathy in mice | Hong LYQ, Yeung ESH, Tran DT, Yerra VGY, Kaur HK, Kabir MDG, Advani SL, Liu Y, Batchu SN, Advani A | 2023 | Disease Models & Mechanisms | Gastroenterology | Area Quantification, Object Colocalization | HALO |
| Mesenchymal cells support the early retention of primary alveolar type 2 cells on acellular mouse lung scaffolds | Taniguchi D, Ahmadipour M, Eiliazadeh A, Duchesneau P, Nagayasu T, Haykal S, Karoubi G, Waddell T | 2023 | Regenerative Therapy | Other | Area Quantification | HALO |
| Mouse-Adapted SARS-CoV-2 MA10 Strain Displays Differential Pulmonary Tropism and Accelerated Viral Replication, Neurodissemination, and Pulmonary Host Responses in K18-hACE2 Mice | Thieulent C, Dittmar W, Balasuriya U, Crossland N, Wen X, Richt J, Carossino M | 2023 | mSphere | Infectious Disease | Area Quantification | HALO |
| The Effects of Acute Ethanol Intoxication on Spinal Cord Injury Outcomes in Female Mice | Glaser E, Stewart A, Jagielo-Miller J, Bailey C, Prendergast M, Gensel J | 2023 | Journal of Neurotrauma | Neuroscience | Area Quantification | HALO |
| Parvalbumin in the metabolic pathway of glutamate and γ-aminobutyric acid: Influence on expression of GAD65 and GAD67 | Zeng C, Lei D, Lu Y, Huang Q, Wu Y, Yang S, Wu Y | 2023 | Archives of Biochemistry and Biophysics | Neuroscience | Area Quantification | HALO |
| Osteoprogenitor recruitment and differentiation during intracortical bone remodeling of adolescent humans | Christiansen PvD, Andreasen CM, El-Masri BM, Laursen KS, Delaisse JM, Andersen TL | 2023 | Bone | Other | FISH | HALO, HALO AI |
| Anatomical distribution of Fyn kinase in the human brain in Parkinson's disease | Guglietti B, Mustafa S, Corrigan F, Collins-Praino LE | 2023 | Parkinsonism & Related Disorders | Neuroscience | Microglia | HALO |
| Measurement of ovarian tumor immune profiles by multiplex immunohistochemistry: implications for epidemiologic studies | Hathaway C, Conejo-Garcia J, Fridley B, Rosner B, Saeed-Vafa D, Segura C, Nguyen J, Hecht J, Sasamoto N, Terry K, Tworoger S, Townsend M | 2023 | Cancer Epidemiology, Biomarkers & Prevention | Immuno-oncology | Highplex FL | HALO |
| Apolipoprotein A-IV of diabetic-foot patients upregulates tumor necrosis factor α expression in microfluidic arterial models | Ji J, Zhao X, Huang J, Wu X, Xie F, Li L, Wang T, Mi S | 2023 | Experimental Biology and Medicine | Other | Multiplex IHC | HALO |
| Perspectives for immunotherapy of EBV-associated GLELC: A relatively “hot” tumor microenvironment | Lei Y, Cao P, Zheng X, Wi J, Cheng M, Liu M | 2023 | Cancer Medicine | Oncology | Highplex FL | HALO |
| Histological spatial analysis on the induction of PD-L1+ macrophages by CD8+ T cells at the marginal microenvironment of triple-negative breast cancer | Suzuki K, Ohe R, Kabasawa T, Kitaoka T, Kawai M, Motoi F, Futakuchi M | 2023 | Breast Cancer | Oncology | Multiplex IHC, Spatial Analysis | HALO |
| Components of the tumor immune microenvironment based on m-IHC correlate with prognosis and subtype of triple-negative breast cancer | Lin L, Li H, Wang X, Wang Z, Su G, Zhou J, Sun S, Ma X, Chen Y, You C, Gu Y | 2023 | Cancer Medicine | Immuno-oncology | Classifier, Spatial Analysis, Highplex FL | HALO |
| Establishment of reference intervals of endometrial immune cells during the mid-luteal phase | Yu S, Huang C, Lian R, Diao L, Zhang X, Cai S, Wei H, Chen C, Li Y, Zeng Y | 2023 | Journal of Reproductive Immunology | Immunology | Classifier, Multiplex IHC | HALO |
| FGF18 promotes human lung branching morphogenesis through regulating mesenchymal progenitor cells | Danopoulos S, Belgacemi R, Hein R, Miller A, Deutsch G, Glass I, Spence J, Al Alam D | 2023 | American Journal of Physiology - Lung Cellular and Molecular Physiology | Other | FISH | HALO |
| Complex Urban Atmospheres alters Alveolar Stem Cells Niche Properties and drives Lung Fibrosis | Belgacemi R, Baptista BR, Justeau G, Toigo M, Frauenpreis A, Yilmaz R, Der Vartanian A, Cazaunau M, Pangui E, Bergé A, Gratien A, Macias Rodriguez JC, Bellusci S, Derumeaux G, Boczkowski J, Al Alam D, Coll P, Lanone S, Boyer L | 2023 | American Journal of Physiology - Lung Cellular and Molecular Physiology | Fibrosis | Classifier, Area Quantification, Highplex FL | HALO |
| Influence of multi-walled carbon nanotubes on the toxicity of ZnO nanoparticles in the intestinal histopathology, apoptosis, and microbial community of common carp | Gao X, Ren H, Huang Y, Li Y, Shen J | 2023 | Comparative Biochemistry and Physiology Part C: Toxicology & Pharmacology | Toxicology | HALO | |
| In situ microwave fixation provides an instantaneous snapshot of the brain metabolome | Juras J, Webb M, Young L, Markussen K, Hawkinson T, Buoncristiani M, Bolton K, Coburn P, Williams M, Sun L, Sanders W, Bruntz R, Conroy L, Wang C, Gentry M, Smith B, Sun R | 2023 | Cell Reports Methods | Other | Area Quantification | HALO |
| Early Detection of Genotoxic Hepatocarcinogens in Rats Using γH2AX and Ki-67: Prediction by Machine Learning | Michiba A, Gi M, Yokohira M, Sakurai E, Teramoto A, Kiriyama Y, Yamada S, Wanibuchi H, Tsukamoto T | 2023 | Toxicological Sciences | Oncology | Multiplex IHC, Highplex FL | HALO |
| Mass spectrometry quantifies target engagement for a KRASG12C inhibitor in FFPE tumor tissue | Chambers AG, Chain DC, Sweet SM, Song Z, Martin PL, Ellis MJ, Rooney C, Kim YJ | 2023 | Clinical Proteomics | Oncology | HALO, HALO AI | |
| Comprehensive prognostic and immune analysis of a glycosylation related risk model in pancreatic cancer | Liu XA, Shi J, Tian L, Xiao B, Zhang K, Zhu Y, Zhang YF, Jiang KR, Zhu Y, Yuan H | 2023 | BMC Cancer | Oncology | Highplex FL | HALO |
| Parishin treatment alleviates cardiac aging in naturally aged mice | Zhou S, Zhao X, Wu L, Yan R, Sun L, Zhang Q, Gong C, Liu Y, Xiang L, Li S, Wang P, Yang Y, Ren W, Jiang J, Yang Y | 2023 | Heliyon | Other | Area Quantification | HALO |
| Effects of KMT2D mutation and its exon 39 mutation on the immune microenvironment and drug sensitivity in colorectal adenocarcinoma | Liu C, Jin Y, Zhang H, Yan J, Guo Y, Bao X, Zhao P | 2023 | Heliyon | Oncology | Highplex FL | HALO |
| Early chronic suppression of microglial p38α in a model of Alzheimer’s disease does not significantly alter amyloid-associated neuropathology | Braun D, Frazier H, Davis V, Coleman M, Rogers C, Van Eldik L | 2023 | PLOS One | Neuroscience | Object Colocalization | HALO |
| Rosmarinic acid alleviates intestinal inflammatory damage and inhibits endoplasmic reticulum stress and smooth muscle contraction abnormalities in intestinal tissues by regulating gut microbiota | Li K, Wu J, Xu S, Li X, Zhang Y, Gao X | 2023 | Microbiology Spectrum | Infectious Disease | Area Quantification | HALO |
| Reanalysis of single-cell data reveals macrophage subsets associated with the immunotherapy response and prognosis of patients with endometrial cancer | Wu Q, Jiang G, Sun Y, Li B | 2023 | Experimental Cell Research | Immuno-oncology | Multiplex IHC | HALO |
| Pretreatment with 3-methyladenine ameliorated Pseudomonas aeruginosa-induced acute pneumonia by inhibiting cell death of neutrophils in a mouse infection model | Yue L, Qi J, Yuan J, Wang X, Wang Y, Shan B, Ke H, Li H, Luan N, Liu C | 2023 | International Journal of Medical Microbiology | Infectious Disease | Multiplex IHC | HALO |
| Jing-Fang powder ethyl acetate extracts attenuate atopic dermatitis by modulating T-cell activity | Zhao G, Tong Y, Xu J, Zhu W, Zeng J, Liu R, Luan F, Zeng N | 2023 | Molecular Immunology | Immunology, Dermatology | Multiplex IHC | HALO |
| Intrauterine perfusion of dexamethasone improves pregnancy outcomes in recurrent reproductive failure patients with elevated uterine natural killer cells. A retrospective cohort study | Zhang F, Wang Z, Lian R, Diao L, Li Y, Wu Y, Yin T, Huang C | 2023 | American Journal of Reproductive Immunology | Other | Multiplex IHC | HALO |
| TIPE2 Inhibits MGD Inflammation by Regulating Macrophage Polarization | Zhao S, Shen Y, Wu S, Shao Y, Shi R, Yan Y, Zhao H | 2023 | Journal of Personalized Medicine | Immunology | Area Quantification, Highplex FL | HALO |
| SMRT Sequencing Enables High-Throughput Identification of Novel AAVs from Capsid Shuffling and Directed Evolution | Widler Casy, Garza IT, Chen X, Dong T, Hu Y, Kanchwala M, Trygg CB, Shyng C, Xing C, Bunnell BA, Braun SE, Gray SJ | 2023 | Genes | Other | Area Quantification | HALO |
| A novel porous hydroxyapatite scaffold (pHAMG) enhances angiogenesis and osteogenesis around dental implants by regulating the immune microenvironment | Li P, Zhou X, Xun Q, Zheng J, Mu Y, Liao J | 2023 | Clinical Oral Investigations | Other | Area Quantification | HALO |
| Intrinsic BMP inhibitor Gremlin regulates alveolar epithelial type II cell proliferation and differentiation | Yanagihara T, Zhou Q, Tsubouchi K, Revill S, Ayoub A, Gholiof M, Chong S, Dvorkin-Gheva A, Ask K, Shi W, Kolb M | 2023 | Biochemical and Biophysical Research Communications | Other | ISH, TMA | HALO |
| Positive regulatory loop of platelet-derived growth factor DD-induced STAT3 activation is associated with poor prognosis in advanced urothelial carcinoma | Ando K, Kurashina R, Motoi N, Iizuka T, Inoue M, Maruyama R, Mitani K, Takenobu H, Haruta M, Onuki R, Matsuoka Y, Kamijo T, Kageyama Y | 2023 | Biochemical and Biophysical Research Communications | Oncology | Multiplex IHC, TMA | HALO |
| Role of CD44 expressed in renal tubules during maladaptive repair in renal fibrogenesis in an allopurinol-induced rat model of chronic kidney disease | Matsushita K, Toyoda T, Akane H, Morikawa T, Ogawa K | 2023 | Journal of Applied Toxicology | Toxicology | Classifier | HALO |
| Pathologic, Immunologic, and Clinical Analysis of the Microsatellite Instability Phenotype in Endometrial Carcinoma | Mackinnon Jr. A, Johnson C, Robin A, Christiansen L, Hanbazazh M, Summey R, Chandrashaker D, Harada S, Bradley W | 2023 | Human Pathology | Oncology | Cytonuclear | HALO |
| Unbiased differential proteomic profiling between cancerassociated fibroblasts and cancer cell lines | Lau R, Yu L, Roumeliotis T, Stewart A, Pickard L, Riisanes R, Gurel B, de Bono J, Choudhary J, Banerji U | 2023 | Journal of Proteomics | Oncology | Multiplex IHC | HALO |
| Analysis of several common APOBEC-type mutations in bladder tumors suggests links to viral infection | Rao N, Starrett G, Piaskowski M, Butler K, Golubeva Y, Yan W, Lawrence S, Dean M, Garcia-Closas M, Baris D, Johnson A, Schwenn M, Malats N, Real F, Kogevinas M, Rothman N, Silverman D, Dyrskjøt L, Buck C, Koutros S, Prokunina-Olsson L | 2023 | Cancer Prevention Research | Oncology | Classifier, Immune | HALO |
| A phase I, first-in-human study of TAK-164, an antibody–drug conjugate, in patients with advanced gastrointestinal cancers expressing guanylyl cyclase C | Kim R, Leal A, Parikh A, Ryan D, Wang S, Bahamon B, Gupta N, Moss A, Pye J, Miao H, Inguilizian H, Cleary J | 2023 | Cancer Chemotherapy and Pharmacology | Oncology | HALO | |
| FSCN1 and epithelial mesenchymal transformation transcription factor expression in human pancreatic intraepithelial neoplasia and ductal adenocarcinoma | Morris HT, Bamlet WR, Razidlo GL, Machesky LM | 2023 | Pathology - Research and Practice | Oncology | Cytonuclear, TMA | HALO |
| A Comparative Study on the Distribution Pattern of Endocrine Cells in the Gastrointestinal Tract of Two Small Alpine Mammals, Plateau Zokor (Eospalax baileyi) and Plateau Pika (Ochotona curzoniae) | Cai X, Bao D, Hua R, Cai B Wang L, Dong R, Hua L | 2023 | Animals | Gastroenterology | Area Quantification | HALO |
| Epitope Lability of Phosphorylated Biomarkers of the DNA Damage Response Pathway Results in Increased Vulnerability to Effects of Delayed or Incomplete Formalin Fixation | Wiseman E, Moss J, Atkinson J, Baakza H, Hayes E, Willis S, Waring P, Canales J, Jones G | 2023 | Journal of Histochemistry & Cytochemistry | Other | Classifier, Cytonuclear, Spatial Analysis | HALO |
| Vascular injury is associated with repetitive head impacts and tau pathology in chronic traumatic encephalopathy | Kirsch D, Shah A, Dixon E, Kelley H, Cherry J, Xia W, Daley S, Aytan N, Cormier K, Kubilus C, Mathias R, Alvarez V, Huber B, McKee A, Stein T | 2023 | Journal of Neuropathology & Experimental Neurology | Neuroscience | Area Quantification | HALO |
| Association between APOE genotype and microglial cell morphology | Kloske C, Gearon M, Weekman E, Rogers C, Patel E, Bachstetter A, Nelson P, Wilcock D | 2023 | Journal of Neuropathology & Experimental Neurology | Neuroscience | Object Colocalization, Microglia | HALO |
| Electroacupuncture Zusanli (ST36) Relieves Somatic Pain in Colitis Rats by Inhibiting Dorsal Root Ganglion Sympathetic-Sensory Coupling and Neurogenic Inflammation | Wang Y, Zhu H, Lv X, Ren X, Peng Y, Qu J, Shen X, Sun R, Xiao M, Zhang H, Chen Z, Cong P | 2023 | Neural Plasticity | Neuroscience | Multiplex IHC | HALO |
| Spinal Cord Stimulation Increases Chemoefficacy and Prevents Paclitaxel-Induced Pain via CX3CL1 | Sivanesan E, Sanchez K, Zhang C, He S, Linderoth B, Stephens K, Raja S, Guan Y | 2023 | Neuromodulation: Technology at the Neural Interface | Oncology | Multiplex IHC | HALO |
| Feasibility of [18F]FSPG PET for Early Response Assessment to Combined Blockade of EGFR and Glutamine Metabolism in Wild-Type KRAS Colorectal Cancer | Bae S, Wang J, Georgiou D, Wen X, Cohen A, Geng L, Tantawy M, Manning H | 2023 | Tomography | Oncology | Area Quantification | HALO |
| Rotator cuff muscle fibrosis can be assessed using ultrashort echo time magnetization transfer MRI with fat suppression | Chang EY, Suprana A, Tang Q, Cheng X, Fu E, Orozco E, Jerban S, Shah S, Du J, Ma Y | 2023 | NMR in Biomedicine | Fibrosis | Muscle Fiber | HALO |
| Electroacupuncture at Sensitized Acupoints Relieves Somatic Referred Pain in Colitis Rats by Inhibiting Sympathetic-Sensory Coupling to Interfere with 5-HT Signaling Pathway | Yang Y, Qu J, Guo H, Zhou H, Ruan X, Peng Y, Shen X, Xiong J, Wang Y. | 2023 | Chinese Journal of Integrative Medicine | Gastroenterology | Area Quantification | HALO |
| Enterococcus faecium inhibits NF-κB / NLRP3 / Caspase-1 signaling pathway to antagonize enterotoxigenic Escherichia coli-mediated inflammatory response | Zheng H, Pu S, Liu J, Yang F, Chen D | 2023 | Canadian Journal of Microbiology | Infectious Disease | Area Quantification | HALO |
| Effects of the purified dry extract of fermented ginseng BST204 on muscle fiber regeneration | Jo S, Park Y, Chang Y, Moon J, Lee S, Lee H, Kim M, Kim D, Bae S, Park S, Yun H, You J, Im M, Han H, Kim S, Jin D | 2023 | Biochemistry and Biophysics Reports | Myology | Muscle Fiber | HALO |
| Effects of estradiol, progesterone or cAMP on expression of PGRMC1 and progesterone receptor in a xenograft model of human endometrium and in endometrial cell culture | Van Wynendaele M, Thieffry C, Samain L, Pierreux C, Tyteca D, Marbaix E, Henriet P | 2023 | Steroids | Other | Highplex FL | HALO |
| A2ML1 Inhibits Esophageal Squamous Cell Carcinoma Progression and Serves as a Novel Prognostic Biomarker | Zhang X, Tang C, Lian J, Jiang Y | 2023 | Canadian Journal of Gastroenterology and Hepatology | Oncology | Area Quantification | HALO |
| PI3K inhibition circumvents resistance to SHP2 blockade in metastatic triple-negative breast cancer | Amante RJ, Jehanno C, De Silva D, Coissieux M, Ackerknecht M, Romanet V, Sethi A, Hamelin B, Preca B, Piscuoglio S, Ng C, Mohseni M, Bentires-Alj M | 2023 | Journal of Mammary Gland Biology and Neoplasia | Oncology | Area Quantification | HALO |
| Feasibility and Impact of Immunohistochemistry-based Molecular Subtyping for Muscle-invasive Bladder Cancer in Patients Treated with Radiation-based Therapy | Hesswani C, Jackson CL, Marcq G, Hardy C, Kool R, Mansure JJ, Brimo F, Berman DM, Kassouf W | 2023 | European Urology Open Science | Oncology | Multiplex IHC | HALO |
| Induction of double-strand breaks with the non-steroidal androgen receptor ligand flutamide in patients on androgen suppression: a study protocol for a randomized, double-blind prospective trial | Lee E, Coulter J, Mishra A, Caramella-Pereira F, Demarzo A, Rudek M, Hu C, Han M, DeWeese TL, Yegnasubramanian S, Song DY | 2023 | Trials | Oncology | HALO | |
| Hepatic proinflammatory myeloid phenotypes are a hallmark of Ebola virus Kikwit pathogenesis in rhesus monkeys | Tseng A, Carossino M, Gertje H, O'Connell A, Gummuluru S, Kolachalama V, Balasuriya U, Connor J, Bennett R, Liu D, Hensley L, Crossland N | 2023 | Veterinary Pathology | Infectious Disease | Area Quantification, Highplex FL | HALO |
| Characterization of Traumatic Brain Injury in a Gyrencephalic Ferret Model Using the Novel Closed Head Injury Model of Engineered Rotational Acceleration (CHIMERA) | Krieg J, Leonard A, Tuner R, Corrigan F | 2023 | Neurotrauma Reports | Neuroscience | Microglia | HALO |
| Protein Disulfide Isomerase A2 Is Correlated with Immune Infiltrates and Is a Novel Prognostic Biomarker in Glioma Patients | Ma Z, Liu Y, Zou N, Huang Z, Wang M, Li T, Zhou J, Chen L | 2023 | Current Medical Science | Oncology | HALO | |
| Pan-tumor T-lymphocyte detection using deep neural networks: Recommendations for transfer learning in immunohistochemistry | Wilm F, Ihling C, Méhes G, Terracciano L, Puget C, Klopfleisch R, Schüffler P, Aubreville M, Maier A, Mrowiec T, Breininger K | 2023 | Journal of Pathology Informatics | Oncology | HALO, HALO AI | |
| Digital analysis of the prostate tumor microenvironment with high-order chromogenic multiplexing | Rajendran R, Beck RC, Waskasi MM, Kelly BD, Bauer DR | 2023 | Journal of Pathology Informatics | Oncology | Highplex FL | HALO, HALO AI |
| Chondrocyte Apoptosis as a Potential Mechanism in Ostrich Limb and Toe Disorders: A Pathological Investigation | Xian M, Duan B, Tang L, Zhou H, Wang L, Wang R, Chen Z, Fang J, Huang C, Liu W, Geng Y, OuYang P, Guo H, Deng H, Lai W | 2023 | Pakistan Veterinary Journal | Other | Highplex FL | HALO |
| Clinical validation of an elastin-derived trifunctional peptide for skin regeneration | Abraham JD, Vaissière A, Desouches C, Thiery G, Bertrand B, Alfandari B, Courtois I, Azencot A, Casoli V, Haen P, Colson T, Hornebeck W, Ritter D | 2023 | American Journal of Translational Research | Dermatology | Highplex FL | HALO |
| Diagnosis and monitoring denosumab therapy of giant cell tumors of bone: radiologic-pathologic correlation | Lejoly M, Van Den Berghe T, Creytens D, Huysse W, Lapeire L, Sys G, Verstraete K | 2023 | Skeletal Radiology | Immuno-oncology | HALO, HALO AI | |
| Single-cell profiling uncovers a Muc4-expressing metaplastic gastric cell type sustained by Helicobacter pylori-driven inflammation | O'Brien VP, Kang Y, Shenoy MK, Finak G, Young WC, Dubrulle J, Koch L, Rodriguez Martinez AE, Williams J, Donato E, Batra SK, Yeung CCS, Grady WM, Koch MA, Gottardo R, Salama NR | 2023 | Cancer Research Communications | Oncology, Infectious Disease | Highplex FL | HALO |
| Tanshinone IIA alleviates early brain injury after subarachnoid hemorrhage in rats by inhibiting the activation of NF-κB/NLRP3 inflammasome | Yang F, Ma N, Li S, Chen F, Huang X, Zhao L, Cao L | 2023 | Biological and Pharmaceutical Bulletin | Neuroscience | Highplex FL | HALO |
| Tumor-infiltrating leukocyte profiling defines three immune subtypes of NSCLC with distinct signaling pathways and genetic alterations | Aoki K, Nishito Y, Motoi N, Arai Y, Hiraoka N, Shibata T, Sonobe Y, Kayukawa Y, Hashimoto E, Takahashi M, Fujii E, Nishizawa T, Fukuda H, Ohashi K, Arai K, Mizoguchi Y, Yoshida Y, Watanabe S, Yamashita M, Kitano S, Sakamoto H, Nagata Y, Mitsumori R, Ozaki K, Niida S, Kanai Y, Hirayama A, Soga T, Maruyama T, Tsukada K, Yabuki N, Shimada M, Kitazawa T, Natori O, Sawada N, Kato A, Yoshida T, Yasuda K, Mizuno H, Tsunoda H, Ochiai A | 2023 | Cancer Research Communications | Immuno-oncology | Area Quantification, Cytonuclear | HALO |
| HER2-Selective and Reversible Tyrosine Kinase Inhibitor Tucatinib Potentiates the Activity of T-DM1 in Preclinical Models of HER2-positive Breast Cancer | Olson D, Taylor J, Willis K, Hensley K, Allred S, Zaval M, Farr L, Thurman R, Jain N, Hein R, Ulrich M, Peterson S, Kulukian A | 2023 | Cancer Research Communications | Oncology | Classifier, Multiplex IHC | HALO |
| Concurrent targeting of HDAC and PI3K to overcome phenotypic heterogeneity of castration-resistant and neuroendocrine prostate cancers | Zhang A, Lau N, Wong A, Brown L, Coleman I, Sarkar N, Li D, DeLucia D, Labrecque M, Nguyen H, Conner J, Dumpit R, True L, Lin D, Corey E, Alumkal J, Nelson P, Morrissey C, Lee J | 2023 | Cancer Research Communications | Oncology | Figure Maker | HALO |
| A Pilot Study of Neoadjuvant Nivolumab, Ipilimumab, and Intralesional Oncolytic Virotherapy for HER2-negative Breast Cancer | Nguyen V, Campbell K, Nowicki T, Elumalai N, Medina E, Baselga-Carretero I, DiNome M, Chang H, Oseguera D, Ribas A, Glaspy J | 2023 | Cancer Research Communications | Immuno-oncology | Highplex FL | HALO |
| CAR T-cell design-dependent remodeling of the brain tumor-immune microenvironment modulates tumor-associated macrophages and anti-glioma activity | Haydar D, Ibañez-Vega J, Crawford J C, Chou C-H, Guy C S, Meehl M, Yi Z, Perry S, Laxton J, Cunningham T, Langfitt D, Vogel P, DeRenzo C, Gottschalk S, Roussel M F, Thomas P G, Krenciute G | 2023 | Cancer Research Communications | Immuno-oncology | Cytonuclear | HALO |
| Coptisine modulates the pharmacokinetics of florfenicol by targeting CYP1A2, CYP2C11 and CYP3A1 in the liver and P-gp in the jejunum of rats: a pilot study | Li S, Zhang M, Wang B, Li X, Liang G | 2023 | Xenobiotica | Gastroenterology | Area Quantification | HALO |
| Impact of tectoridin on the pharmacokinetics of florfenicol via targeting cytochrome P450 and P-glycoprotein of rats | Zhang M, Wang B, Li X, Yin Q, Liang G, Li S | 2023 | Xenobiotica | Other | Area Quantification | HALO |
| Effect of Dupilumab on Type 2 Biomarkers in Chronic Rhinosinusitis With Nasal Polyps: SINUS-52 Study Results | Bachert C, Laidlaw T, Cho S, Mullol J, Swanson B, Naimi S, Classe M, Harel S, Jagerschmidt A, Laws E, Ruddy M, Praestgaard A, Amin N, Mannent L | 2023 | Annals of Otology, Rhinology & Laryngology | Other | Area Quantification | HALO, HALO AI |
| Lymph Node Metastases in Papillary Thyroid Carcinoma can be Predicted by a Convolutional Neural Network: a Multi-Institution Study | Esce A, Redemann J, Olson G, Hanson J, Agarwal S, Yenwongfai L, Ferreira J, Boyd N, Bocklage T, Martin D | 2023 | Annals of Otology, Rhinology & Laryngology | Oncology | HALO, HALO AI | |
| Characterization of expression and prognostic implications of transforming growth factor beta, programmed death-ligand 1, and T regulatory cells in canine histiocytic sarcoma | Murphy J, Shiomitsu K, Milner R, Lejeune A, Ossiboff R, Gell J, Axiak-Bechtel S | 2023 | Veterinary Immunology and Immunopathology | Oncology | ISH | HALO |
| Characterization of expression and prognostic implications of GD2 and GD3 synthase in canine histiocytic sarcoma | Murphy J, Axiak-Bechtel S, Milner R, Lejeune A, Ossiboff R, Castellanos Gell J, Shiomitsu K | 2023 | Veterinary Immunology and Immunopathology | Oncology | ISH | HALO |
| The function role of HIGD1A in nonalcoholic steatohepatitis from chronic hepatitis B | Li M, Li J, Wang D, Li T, Ye L, Liang X, Zhang H, Liu Z, Zhang X, Li J, Liu Y, Pan C Q, Dai E | 2023 | Scandinavian Journal of Gastroenterology | Gastroenterology | Highplex FL | HALO |
| Prognostic significance of tumor microenvironment assessed by machine learning algorithm in surgically resected non-small cell lung cancer | Terada Y, Isaka M, Ono A, Kawata T, Serizawa M, Mori K, Muramatsu K, Tone K, Kenmotsu H, Ohshima K, Urakami K, Nagashima T, Kusuhara M, Akiyama Y, Sugino T, Takahashi T, Ohde Y | 2023 | Cancer Reports | Oncology | Multiplex IHC | HALO |
| Combination of pathological, biochemical and behavioral evaluations for peripheral neurotoxicity assessment in isoniazid-treated rats | Kashimura A, Nishikawa S, Ozawa Y, Hibino Y, Tateoka T, Mizukawa M, Nishina H, Sakairi T, Shiga T, Aihara N, Kamiie J | 2023 | Journal of Toxicologic Pathology | Toxicology | Axon | HALO |
| CD44 expression in renal tubular epithelial cells in the kidneys of rats with cyclosporine-induced chronic kidney disease | Matsushita K, Toyoda T, Akane H, Morikawa T, Ogawa K | 2023 | Journal of Toxicologic Pathology | Toxicology | Classifier | HALO |
| Expression and Correlation of Complement C3 and C4 in Serum and Maternal-Fetal Interface in Patients with Unexplained Recurrent Spontaneous Abortion: A Prospective Cohort Study | Zhou Z, Xie H, Liu M, Li R, Jiang W, Zheng Y, Lv Q | 2023 | Clinical and Experimental Obstetrics & Gynecology | Other | Multiplex IHC | HALO |
| RNAscope dual ISH–IHC technology to study angiogenesis in difuse large B‑cell lymphomas | Annese T, Tamma R, De Giorgis M, Ruggieri S, Maiorano E, Specchia G, Ribatti D | 2019 | Histochemistry and Cell Biology | |||
| Implementing Digital Pathology into Veterinary Academics and Research | Jones-Hall Y, Skelton J, Adams L. | 2021 | Journal of Veterinary Medical Education | Other | HALO | |
| Implications of dysregulated endogenous cannabinoid family members in the pathophysiology of endometriosis | Lingegowda H, Miller J, McCallion A, Childs T, Lessey B, Koti M, Tayade C | 2021 | F&S Science | Other | HALO | |
| Analysis of gene expression of prostaglandin EP4 receptor in canine osteosarcoma | Musser M, Viall A, Phillips R, Hostetter J, Johannes C | 2021 | Canadian Journal of Veterinary Research | Oncology | HALO | |
| Introduction to Digital Pathology from Historical Perspectives to Emerging Pathomics | Gupta R, Kurc T, Saltz J | 2021 | Whole Slide Imaging | Review | HALO | |
| Narrative online guides for the interpretation of digital-pathology images and tissue-atlas data | Rashid R, Chen Y, Hoffer J, Muhlich J, Lin J, Krueger R, Pfister H, Mitchell R, Santagata S, Sorger P | 2021 | Nature Biomedical Engineering | Review | HALO | |
| Whole Slide Imaging | Editor: Parwani A | 2021 | NA | Review | HALO | |
| Astrocytic laminin-211 drives disseminated breast tumor cell dormancy in brain | Dai J, Cimino P, Gouin III K, Grzelak C, Barrett A, Lim A, Long A, Weaver S, Saldin L, Uzamere A, Schulte V, Nigel C, Pisarsky L, Lyden D, Bissell M, Knott S, Welm A, Bielas J, Hansen K, Winkler F, Holland E, Ghajar | 2021 | Nature Cancer | Oncology | HALO | |
| Bystander effects induced by the interaction between urothelial cancer cells and irradiated adipose tissue-derived stromal cells in urothelial carcinoma | Kawasaki M, Nagase K, Aoki S, Udo K, Tobu S, Rikitake-Yamamoto M, Kubota M, Narita T, Noguchi M | 2022 | Human Cell | Oncology | Multiplex IHC | HALO |
| Thick Data Analytics for Small Training Samples Using Siamese Neural Network and Image Augmentation | Fiaidhi J, Sawyer D, Mohammed S | 2022 | LISS 2021 | Other | HALO | |
| Efficient recovery of potent tumour-infiltrating lymphocytes through quantitative immunomagnetic cell sorting | Wang Z, Ahmed S, Labib M, Wang H, Hu X, Wei J, Yao Y, Moffat J, Sargent E, Kelley S | 2022 | Nature Biomedical Engineering | Immuno-oncology | Classifier, Cytonuclear | HALO |
| Assessing the Accuracy of Bioluminescence Image-Guided Stereotactic Body Radiation Therapy of Orthotopic Pancreatic Tumors Using a Small Animal Irradiator | Rapic S, Samuel T, Lindsay P, Ansell S, Weersink R, DaCosta R | 2022 | Radiation Research | Oncology | HALO | |
| ICOS-Positive Regulatory T Cells in Hepatocellular Carcinoma: The Perspective from Digital Pathology Analysis | Lu L, Deantonio C, Palu C, Lee Y, Mitchell L, Cowan M, Corser M, Sherry L, Cheng A, Quaratino S, Shao Y, Sainson R, Hsu C | 2022 | Karger | Oncology | Multiplex IHC, Spatial Analysis | HALO |
| Semi-Quantitative Determination of Dopaminergic Neuron Density in the Substantia Nigra of Rodent Models using Automated Image Analysis | O'Hara D, Kapadia M, Ping S, Kalia S, Kalia L | 2021 | JoVE | Neuroscience | Cytonuclear | HALO |
| Cell signaling activation and extracellular matrix remodeling underpin glioma tumor microenvironment heterogeneity and organization | Dinevska M, Widodo S, Furst L, Cuzcano L, Fang Y, Mangiola S, Neeson P, Darcy P, Ramsay R, Hutchinson R, MacKay F, Christie M, Stylli S, Mantamadiotis T | 2022 | Cellular Oncology | Oncology | Classifier, Highplex FL, Registration | HALO |
| CAV1 Impacts the Tumor Immune Microenvironment and Has Potential Value of Predicting Response to Immunotherapy in Esophageal Cancer | Zhang R, Wang H, Xiao J, Lu J, Li M, Zhou Y, Sun H, Liu L, Huang T, Zhao Q | 2023 | DNA and Cell Biology | Immuno-oncology | Multiplex IHC | HALO |
| Microenvironmental elements singularity synergistically regulate the behavior and chemosensitivity of endometrioid carcinoma | Morito S, Kawasaki M, Nishiyama M, Sakumoto T, Hashiguchi M, Narita T, Kawaguchi A, Toda S, Aoki S | 2023 | Human Cell | Oncology | HALO | |
| Isolation of tumour-reactive lymphocytes from peripheral blood via microfluidic immunomagnetic cell sorting | Wang Z, Ahmed S, Labib M, Wang H, Wu L, Bavaghar-Zaeimi F, Shokri N, Blanco S, Karim S, Czarnecka-Kujawa K, Sargent E, McGray A, de Perrot M, Kelley S | 2023 | Nature Biomedical Engineering | Oncology | HALO | |
| Intestinal microbiota controls graft-versus-host disease independent of donor-host genetic disparity | Koyama M, Hippe DS, Srinivasan S, Proll SC, Miltiadous O, Li N, Zhang P, Ensbey KS, Hoffman NG, Schmidt CR, Yeh AC, Minnie SA, Strenk SM, Fiedler TL, Hattangady N, Kowalsky J, Grady WM, Degli-Esposti MA, Varelias A, Clouston AD, van den Brink MRM, Dey N, Randolph TW, Markey KA, Fredricks DN, Hill GR | 2023 | Immunity | Immunology | HALO | |
| Bromodomain Proteins Epigenetically Regulate the Mitotically Associated lncRNA MANCR in Triple Negative Breast Cancer Cells | Tracy K, Prior S, Trowbridge W, Boyd J, Ghule P, Frietze S, Stein J, Stein G, Lian J | 2023 | Critical Reviews in Eukaryotic Gene Expression | Oncology | HALO | |
| KRASG12D inhibition reprograms the microenvironment of early and advanced pancreatic cancer to promote FAS-mediated killing by CD8+ T cells | Mahadevan KK, McAndrews KM, LeBleu VS, Yang S, Lyu H, Li B, Sockwell AM, Kirtley ML, Morse SJ, Moreno Diaz BA, Kim MP, Feng N, Lopez AM, Guerrero PA, Paradiso F, Sugimoto H, Arian KA, Ying H, Barekatain Y, Sthanam LK, Kelly PJ, Maitra A, Heffernan TP, Kalluri R | 2023 | Cancer Cell | Immuno-oncology | HALO | |
| Rosuvastatin-Eluting Gold-Nanoparticle-Loaded Perivascular Wrap for Enhanced Arteriovenous Fistula Maturation in a Murine Model | Klusman C, Martin B, Perez JVD, Barcena AJR, Bernardino MR, San Valentin EMD, Damasco JA, Del Mundo HC, Court KA, Godin B, Canlas GM, Fowlkes N, Bouchard R, Cheng J, Huang SY, Melancon MP | 2023 | Advanced Fiber Materials | Biomaterials | HALO | |
| IL-2Rα-biased agonist enhances antitumor immunity by invigorating tumor-infiltrating CD25+CD8+ T cells | Wu W, Chia T, Lu J, Li X, Guan J, Li Y, Fu F, Zhou S, Feng Y, Deng J, Zou J, Sun J, Yao Y, Ling X, Wu Z, Zhang Y, Xu J, Wang F, Liang X, Wu M, Liu H, Chen B, He K | 2023 | Nature Cancer | Immuno-oncology | HALO | |
| Ablation of dual specificity phosphatase 6 protects against non-alcoholic fatty liver disease via CYP4A and MAPK | Jiang C, Saiki Y, Hirota S, Iwata K, Wang X, Ito Y, Murakami K, Imura T, Inoue J, Masamune A, Hirayama A, Goto M, Furukawa T | 2023 | The American Journal of Pathology | Gastroenterology | HALO | |
| Balancing safety and efficacy to determine the most suitable size of imaging-visible embolic microspheres for bariatric arterial embolization in a preclinical model | Fu Y, Abiola G, Tunacao J, Vairavamurthy J, Nwoke F, Dreher M, Shin E, Anders R, Kraitchman D, Weiss C | 2023 | Journal of Vascular and Interventional Radiology | Other | HALO | |
| Targeting doublecortin-like kinase 1 reveals a novel strategy to circumvent chemoresistance and metastasis in ovarian cancer | Dogra S, Elayapillai SP, Qu D, Pitts K, Filatenkov A, Houchen CW, Berry WL, Moxley K, Hannafon B | 2023 | Cancer Letters | Oncology | HALO | |
| Mitochondrial transplantation inhibits cholangiocarcinoma cells growth by balancing oxidative stress tolerance through PTEN/PI3K/AKT signaling pathway | Liu X, Zhang Y, Yang X, Zhang Y, Liu Y, Wang L, Yi T, Yuan J, Wen W, Jian Y | 2023 | Tissue and Cell | Oncology | HALO | |
| The bone transcription factor Osterix controls extracellular matrix- and node of Ranvier-related gene expression in oligodendrocytes | Elbaz B, Darwish A, Vardy M, Isaac S, Tokars HM, Dzhashiashvili Y, Korshunov K, Prakriya M, Eden A, Popko B | 2023 | Neuron | Neuroscience | HALO | |
| Predicting nodal metastases in squamous cell carcinoma of the oral tongue using artificial intelligence | Esce A R, Baca A L, Redemann J P, Rebbe R W, Schultz F, Agarwal S, Hanson J A, Olson G T, Martin D R, Boyd N H | 2023 | American Journal of Otolaryngology | Oncology | HALO, HALO AI | |
| Inosine monophosphate dehydrogenase intranuclear inclusions are markers of aging and neuronal stress in the human substantia nigra | Woulfe J, Munoz DG, Gray DA, Jinnah HA, Ivanova A | 2023 | Neurobiology of Aging | Neuroscience | Highplex FL | HALO |
| Spatial multimodal analysis revealed tertiary lymphoid structures as a risk stratification indicator in combined hepatocellular-cholangiocarcinoma | Gan X, Dong W, You W, Ding D, Yang Y, Sun D, Li W, Ding W, Liang Y, Yang F, Zhou W, Dong H, Yuan S | 2023 | Cancer Letters | Oncology | HALO, HALO Link | |
| Pumilio1 regulates NPM3/NPM1 axis to promote PD-L1-mediated immune escape in gastric cancer | Wang H, Zhou Z, Zhang J, Hao T, Wang P, Wu P, Su R, Yang H, Deng G, Chen S, Gu L, He Y, Zeng L, Zhang C, Yin S | 2023 | Cancer Letters | Immuno-oncology | HALO | |
| A cluster of neuropeptide S neurons regulates breathing and arousal | Angelakos C, Girven K, Liu Y, Gonzalez O, Murphy K, Jennings K, Giardino W, Zweifel L, Suko A, Palmiter R, Clark S, Krasnow M, Bruchas M, de Lecea L | 2023 | Current Biology | Neuroscience | HALO | |
| Overall Survival Prediction by Tumor Microenvironment Lymphocyte Distribution in Hepatocellular Carcinoma After Liver Transplantation | Gulla A, Stulpinas R, Grigonyte A, Zilenaite-Petrulaitiene D, Rasmusson A, Laurinavicius A, Strupas K | 2023 | Journal of Surgical Research | Oncology | HALO, HALO AI | |
| Therapeutic Effects of In Vivo Administration of An Inhibitor of Tryptophan 2,3-dioxygenase (680C91) for the Treatment of Fibroids: A Preclinical Study | Chuang TS, Ton N, Rysling S, Quintanilla D, Boos D, Khorram O | 2023 | Fertility and Sterility | Review | HALO | |
| The prognostic value of CD39 as a marker of tumor-specific T cells in triple-negative breast cancer in Asian women | Meng J, Tan JYT, Joseph CR, Ye J, Lim JCT, Goh D, Yuezhen X, Lim X, Koh VCY, Wee F, Tay TKY, Chan JY, Ng CCY, Iqbal J, Lau MC, Lim HE, Toh HC, Teh BT, Dent RA, Tan PH, Sheng JYP | 2023 | Laboratory Investigation | Immuno-oncology | HALO | |
| Applications of Artificial Intelligence in Lung Pathology | Hartman DJ | 2023 | Surgical Pathology Clinics | Review | HALO | |
| Role of Hepatic Stellate and Liver Sinusoidal Endothelial Cells in a Human Primary Cell Three-Dimensional Model of Nonalcoholic Steatohepatitis | Tan P K, Ostertag T, Rosenthal S B, Chilin-Fuentes D, Aidnik H, Linker S, Murphy K, Miner J N, Brenner D A | 2023 | The American Journal of Pathology | Gastroenterology | HALO | |
| PrECOG PrE0807: A Phase 1b Feasibility Trial of Neoadjuvant Nivolumab Without and with Lirilumab in Patients with Muscle-invasive Bladder Cancer Ineligible for or Refusing Cisplatin-based Neoadjuvant Chemotherapy | Grivas P, Koshkin VS, Chu X, Cole S, Jain RK, Dreicer R, Cetnar JP, Sundi D, Gartrell BA, Galsky MD, Woo B, Li-Ning-Tapia EL, Hahn NM, Carducci MA | 2023 | European Urology Oncology | Immuno-oncology | HALO | |
| Prevalence and Therapeutic Targeting of High Level ERBB2 Amplification in Non-Small Cell Lung Cancer | Odintsov I, Makarem M, Nishino M, Bachert S, Zhang T, LoPiccolo J, Paweletz C P, Gokhale P C, Ivanova E, Saldanha A, Rudin C M, Lockwood W W, Ladanyi M, Somwar R, Jänne P A, Sholl L M | 2023 | Journal of Thoracic Oncology | Oncology | HALO | |
| BacilliFinder: Revolutionizing Tuberculosis Detection with Computer Vision | Nagaraju Y, Venkatesh, Rajani G, Basapur S | 2023 | Indian Journal of Tuberculosis | Infectious Disease | HALO | |
| The prognostic value of CD39 as a marker of tumor-specific T cells in triple-negative breast cancer in Asian women | Meng J, Tan JYT, Joseph CR, Ye J, Lim JCT, Goh D, Yuezhen X, Lim X, Koh VCY, Wee F, Tay TKY, Chan JY, Ng CCY, Iqbal J, Lau MC, Lim HE, Toh HC, Teh BT, Dent RA, Tan PH, Sheng JYP | 2023 | Laboratory Investigation | Oncology | HALO | |
| Role of Hepatic Stellate and Liver Sinusoidal Endothelial Cells in a Human Primary Cell Three-Dimensional Model of Nonalcoholic Steatohepatitis | Tan PK, Ostertag T, Rosenthal SB, Chilin-Fuentes DC, Aidnik H, Linker S, Murphy K, Miner JN, Brenner DA | 2023 | The American Journal of Pathology | Gastroenterology | HALO |
Related HALO Modules
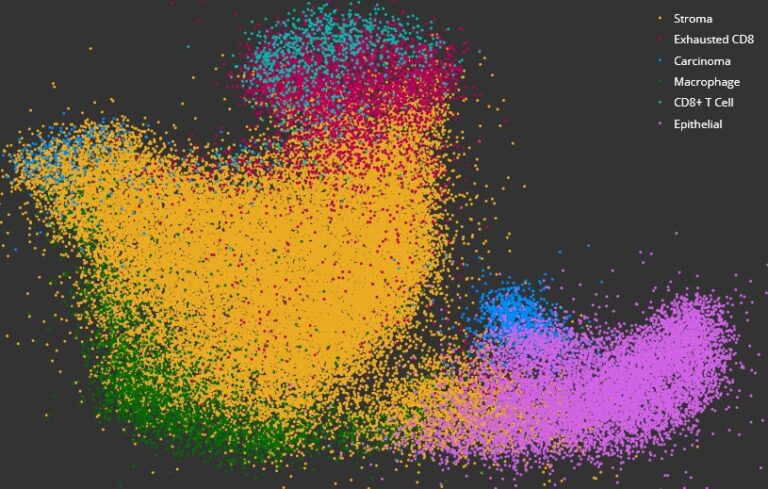
Acquire deeper insights into complex data sets using dimensional reduction and unsupervised clustering with interactive plotting.
Learn More
Simultaneously analyze up to three chromogenic and/or silver-labelled DNA or RNA ISH probes on a cell-by-cell basis, measuring spot numbers and area per cell and compartment, and calculated H-scores for each probe.
Learn More
Simultaneously analyze a nuclear stain and up to four IHC biomarkers or ISH probes on a cell-by-cell basis across brightfield images.
Learn MoreUse the arrows above to view additional related modules
Want to Learn More?
Fill out the form below to request information about any of our software products.
You can also drop us an email at info@indicalab.com
Products & Services
Interested in purchasing or learning more about our products and services? Our highly trained application scientists are a couple of clicks away.
Software Maintenance & Support Coverage
Interested in purchasing an SMS plan? We would be happy to give you a quote.
Technical Support
Need technical support? Our IT specialists are here to help.